SlideShare ist ein Scribd-Unternehmen logo
1 von 17
Downloaden Sie, um offline zu lesen
Demand Forecasting: Evidence-based Methods

                                A chapter for the forthcoming book
                 Strategic Marketing Management: A Business Process Approach,
                           edited by Luiz Moutinho and Geoff Southern.


                                       J. Scott Armstrong
                           The Wharton School, University of Pennsylvania

                                     Kesten C. Green
            Department of Econometrics and Business Statistics, Monash University

                                         Demandforecasting35.doc
                                            January 13, 2006


                                              INTRODUCTION

We looked at evidence from comparative empirical studies to identify methods that can be useful for predicting
demand in various situations and to warn against methods that should not be used. In general, use structured
methods and avoid intuition, unstructured meetings, focus groups, and data mining. In situations where there are
sufficient data, use quantitative methods including extrapolation, quantitative analogies, rule-based forecasting,
and causal methods. Otherwise, use methods that structure judgement including surveys of intentions and
expectations, judgmental bootstrapping, structured analogies, and simulated interaction. Managers’ domain
knowledge should be incorporated into statistical forecasts. Methods for combining forecasts, including Delphi
and prediction markets, improve accuracy. We provide guidelines for the effective use of forecasts, including
such procedures as scenarios. Few organizations use many of the methods described in this paper. Thus, there
are opportunities to improve efficiency by adopting these forecasting practices.

Marketing practitioners regard forecasting as an important part of their jobs. For example, Dalrymple (1987), in
his survey of 134 US companies, found that 99% prepared formal forecasts when they developed written
marketing plans. In Dalrymple (1975), 93% of the companies sampled indicated that sales forecasting was ‘one
of the most critical’ aspects, or a ‘very important’ aspect of their company’s success. Jobber, Hooley and
Sanderson (1985), in a survey of 353 marketing directors from British textile firms, found that sales forecasting
was the most common of nine activities on which they reported.

We discuss methods to forecast demand. People often use the terms ‘demand’ and ‘sales’ interchangeably. It is
reasonable to do so because the two equate when sales are not limited by supply.

Sometimes it is appropriate to forecast demand directly. For example, a baker might extrapolate historical data
on bread sales to predict demand in the week ahead. When direct prediction is not feasible, or where uncertainty
and changes are expected to be substantial, marketing managers may need to forecast the size of a market or
product category. Also, they would need to forecast the actions and reactions of key decision makers such as
competitors, suppliers, distributors, collaborators, governments, and themselves – especially when strategic
issues are involved. These actions can help to forecast market share. The resulting forecasts allow one to
calculate a demand forecast. These forecasting needs and their relationships are illustrated in Figure 1.
FIGURE 1
        Needs for marketing forecasts


FORECASTING METHODS

In this section we provide brief descriptions of forecasting methods and their application. Detailed descriptions
are provided in forecasting textbooks such as Makridakis, Wheelwright, and Hyndman (1998).

Forecasting methods and the relationships between them are shown in Figure 2, starting with the primary
distinction between methods that rely on judgement and those that require quantitative data.

                     -----------------------------------------------------------------------------------
                    Put FIGURE 2: Methodology Tree for Forecasting about here
                                  ---------------------------------------------------------


Methods Based on Judgment

Unaided judgment

It is common practice to ask experts what will happen. This is a good procedure to use when
              • experts are unbiased
              • large changes are unlikely
              • relationships are well understood by experts (e.g., demand goes up when prices go down)
              • experts possess privileged information
              • experts receive accurate and well-summarized feedback about their forecasts.


Unfortunately, unaided judgement is often used when the above conditions do not hold. Green and Armstrong
(2005a), for example, found that experts were no better than chance when they use their unaided judgement to
forecast decisions made by people in conflict situations. If this surprises you, think of the ease with which
producers of current affairs programmes seem able to assemble plausible experts who confidently express


                                                                                                               2
forecasts on how a situation will turn out, or how things would have turned out had they followed another
approach.


Prediction markets

Prediction markets, also known as betting markets, information markets, and futures markets have a long
history. Between the end of the US Civil War and World War II, well-organized markets for betting on
presidential elections correctly picked the winner in every case but 1916; also, they were highly successful in
identifying those elections that would be very close (Rhode and Strumpf, 2004). More recently, in the four
elections prior to 2004, the Iowa Electronic Markets (IEM) has performed better than polls in predicting the
margin of victory for the presidential election winner. In the week leading up to the election, these markets
predicted vote shares for the Democratic and Republican candidates with an average absolute error of around
1.5 percentage points. The final Gallup poll, by comparison, yielded forecasts that erred by 2.1 percentage
points (Wolfers and Zitzewitz, 2004).

Despite numerous attempts since the 1930s, no methods have been found to be superior to markets when
forecasting prices. However, few people seem to believe this as they pay handsomely for advice about what to
invest in.

Some commercial organisations provide internet markets and software that to allow participants to bet by
trading contracts. Markets can be used to market to predict such things as the percentage of US households with
an HDTV by the end of a given time period. Confidential betting markets can also be set up within firms to bet
on such things as the sales growth of a new product. Some unpublished studies suggest that they can produce
accurate sales forecasts when used within companies. However, there are no empirical studies that compare
forecasts from prediction markets with those from traditional groups or from other methods.


Delphi

The Delphi technique was developed at RAND Corporation in the 1950s to help capture the knowledge of
diverse experts while avoiding the disadvantages of traditional group meetings. The latter include bullying and
time-wasting.

To forecast with Delphi the administrator should recruit between five and twenty suitable experts and poll them
for their forecasts and reasons. The administrator then provides the experts with anonymous summary statistics
on the forecasts, and experts’ reasons for their forecasts. The process is repeated until there is little change in
forecasts between rounds – two or three rounds are usually sufficient. The Delphi forecast is the median or mode
of the experts’ final forecasts. Software to guide you through the procedure is available at
forecastingprinciples.com.

Rowe and Wright (2001) provide evidence on the accuracy of Delphi forecasts. The forecasts from Delphi
groups are substantially more accurate than forecasts from unaided judgement and traditional groups, and are
somewhat more accurate than combined forecasts from unaided judgement.


Structured analogies

The outcomes of similar situations from the past (analogies) may help a marketer to forecast the outcome of a
new (target) situation. For example, the introduction of new products in US markets can provide analogies for
the outcomes of the subsequent release of similar products in other countries.

People often use analogies to make forecasts, but they do not do so in a structured manner. For example, they
might search for an analogy that suits their prior beliefs or they might stop searching when they identify one
analogy. The structured-analogies method uses a formal process to overcome biased and inefficient use of
information from analogous situations.

To use the structured analogies method, an administrator prepares a description of the target situation and selects
experts who have knowledge of analogous situations; preferably direct experience. The experts identify and
describe analogous situations, rate their similarity to the target situation, and match the outcomes of their


                                                                                                                 3
analogies with potential outcomes in the target situation. The administrator then derives forecasts from the
information the experts provided on their most similar analogies.

There has been little research on forecasting using analogies, but results are promising. Green and Armstrong
(2005b) found that structured analogies were more accurate than unaided judgment in forecasting decisions in
eight conflicts. Further information on structured analogies is available at conflictforecasting.com.


Game theory

Game theory has been touted in textbooks and research papers as a way to obtain better forecasts in situations
involving negotiations or other conflicts. A Google search for “game theory” and “forecasting” or “prediction”
identified 147,300 sites. Despite a vast research effort, there is no research that directly tests the forecasting
ability of game theory. However, Green (2002, 2005) tested the ability of game theorists, who were urged to use
game theory in predicting the outcome of eight real (but disguised) situations. In that study, game theorists were
no more accurate than university students.


Judgmental Decomposition

The basic idea behind judgemental decomposition is to divide the forecasting problem into parts that are easier
to forecast than the whole. One then forecasts the parts individually, using methods appropriate to each part.
Finally, the parts are combined to obtain a forecast.

One approach is to break the problem down into multiplicative components. For example, to forecast sales for a
brand, one can forecast industry sales volume, market share, and selling price per unit. Then reassemble the
problem by multiplying the components together. Empirical results indicate that, in general, forecasts from
decomposition are more accurate than those from a global approach (MacGregor 2001). In particular,
decomposition is more accurate where there is much uncertainty about the aggregate forecast and where large
numbers (over one million) are involved.


Judgmental bootstrapping

Judgmental bootstrapping converts subjective judgments into structured procedures. Experts are asked what
information they use to make predictions about a class of situations. They are then asked to make predictions for
diverse cases, which can be real or hypothetical. For example, they might forecast next year’s sales for
alternative designs for a new product. The resulting data are then converted to a model by estimating a
regression equation relating the judgmental forecasts to the information used by the forecasters. The general
proposition seems preposterous. It is that the model of the man will be more accurate than the man. The reason
is that the model applies the man’s rules more consistently.

Judgemental bootstrapping models are most useful for repetitive complex forecasting problems where data on
the dependent variable are not available (e.g. demand for a new telecommunications device) or data does not
vary sufficiently for the estimation of an econometric model.

Once developed, judgmental bootstrapping models provide a low-cost procedure for making forecasts. The
review in Armstrong (2001a) found that judgmental bootstrapping was more accurate than unaided judgment
(the normal method for these situations) in 8 of the 11 comparisons, with two tests showing no difference, and
one showing a small loss. The typical error reduction was about 6%.

Judgmental bootstrapping also allows experts to see how they are weighting various factors. This knowledge
can help to improve judgmental forecasting. For example, with respect to personnel selection, bootstrapping
might reveal that some factors, such as height, weight or looks, are used, even though they are not relevant for
the job. Bootstrapping also allows for estimating effects of changing key variables when historical data are not
sufficient to allow for estimates.


                                                                                                                4
Expert systems

As the name implies, expert systems are structured representations of the rules experts use to make predictions
or diagnoses. For example, ‘if local household incomes are in the bottom quartile, then do not supply premium
brands’. The forecast is implicit in the foregoing conditional action statement: i.e., premium brands are unlikely
to make an acceptable return in the locale. Rules are often created from protocols, whereby forecasters talk
about what they are doing while making forecasts. Where empirical estimates of relationships from structured
analysis such as econometric studies are available, expert systems should use that information. Expert opinion,
conjoint analysis, and bootstrapping can also aid in the development of expert systems.

Expert systems forecasting involves identifying forecasting rules used by experts and rules learned from
empirical research. One should aim for simplicity and completeness in the resulting system, and the system
should explain forecasts to users.

Developing an expert system is expensive and so the method will only be of interest in situations where many
forecasts of a similar kind are required. Expert systems are feasible where problems are sufficiently well-
structured for rules to be identified.

Collopy, Adya, and Armstrong (2001), in their review, found that expert systems forecasts are more accurate
than those from unaided judgement. This conclusion, however, was based on only a small number of studies.


Simulated interaction

Simulated interaction is a form of role playing for predicting decisions by people who are interacting with
others. It is especially useful when the situation involves conflict. For example, one might wish to forecast how
best to secure an exclusive distribution arrangement with a major supplier.

To use simulated interaction, an administrator prepares a description of the target situation, describes the main
protagonists’ roles, and provides a list of possible decisions. Role players adopt a role and read about the
situation. They then improvise realistic interactions with the other role players until they reach a decision; for
example to sign a trial one-year exclusive distribution agreement. The role players’ decisions are used to make
the forecast.

Using eight conflict situations, Green (2005) found that forecasts from simulated interactions were substantially
more accurate than can be obtained from unaided judgement. Simulated interaction can also help to maintain
secrecy. Information on simulated interaction is available from conflictforecasting.com.


Intentions and expectations surveys

With intentions surveys, people are asked how they intend to behave in specified situations. In a similar manner,
an expectations survey asks people how they expect to behave. Expectations differ from intentions because
people realize that unintended things happen. For example, if you were asked whether you intended to visit the
dentist in the next six months you might say no. However, you realize that a problem might arise that would
necessitate such a visit, so your expectations would be that the event had a probability greater than zero. This
distinction was proposed and tested by Juster (1966) and its evidence on its importance was summarised by
Morwitz (2001).

Expectations and intentions can be obtained using probability scales such as Juster’s eleven-point scale. The
scale should have descriptions such as 0 = ‘No chance, or almost no chance (1 in 100)’ to 10 = ‘Certain, or
practically certain (99 in 100)’.

To forecast demand using a survey of potential consumers, the administrator should prepare an accurate and
comprehensive description of the product and conditions of sale. He should select a representative sample of the
population of interest and develop questions to elicit expectations from respondents. Bias in responses should be
assessed if possible and the data adjusted accordingly. The behaviour of the population is forecast by
aggregating the survey responses.


                                                                                                                5
Useful methods have been developed for selecting samples, obtaining high response rates, compensating for
non-response bias, and reducing response error. Dillman (2000) provides advice for designing surveys.
Response error (where respondent information is not accurately reported) is probably the largest component of
total error for marketing problems.

Expectations are most likely to be useful in cases where survey respondents have previously indulged in the
behaviour of interest, for example visited a theme park. Other conditions favouring the use of expectations
surveys are: (1) responses can be obtained; (2) the behaviour is important to the respondent; (3) the behaviour is
planned; (4) the plan is reported correctly; (5) the respondent is able to fulfil the plan; (6) the plan is unlikely to
change (Morwitz 2001).

Intentions and expectations surveys are especially useful when demand data are not available, such as for new
product forecasts.

One popular type of survey, focus groups, violates five important principles and they should not, therefore, be
used in forecasting. First, focus groups are seldom representative of the population of interest. Second, the
responses of each participant are influenced by the expressed opinions of others in the group. Third, a focus
group is a small sample – samples for intentions or expectations surveys typically include several hundred
people whereas a focus group will consist of between six and ten individuals. Fourth, questions for the
participants are generally not well structured. And fifth, summaries of focus groups responses are often subject
to bias. There is no evidence to show that focus groups provide useful forecasts.


Conjoint analysis

By surveying consumers about their preferences for alternative product designs in a structured way, it is possible
to infer how different features will influence demand. Potential customers might be presented with a series of
perhaps 20 pairs of offerings. For example, various features of a personal digital assistant such as price, weight,
battery life, screen clarity and memory could be varied substantially such that the features do not correlate with
one another. The potential customer is thus forced to make trade-offs among various features by choosing one of
each pair of offerings in a way that is representative of how they would choose in the marketplace. The resulting
data can be analysed by regressing respondents’ choices against the product features. The method, which is
similar to bootstrapping, is called ‘conjoint analysis’ because respondents consider the product features jointly.

In general, the accuracy of forecasts from conjoint analysis is likely to increase with increasing realism of the
choices presented to respondents (Wittink and Bergesteun 2001). The method is based on sound principles, such
as using experimental design and soliciting independent intentions from a sample of potential customers.
Unfortunately however, there do not appear to be studies that compare conjoint-analysis forecasts with forecasts
from other reasonable methods.


Methods requiring quantitative data

Extrapolation

Extrapolation methods use historical data on that which one wishes to forecast. Exponential smoothing is the
most popular and cost effective of the statistical extrapolation methods. It implements the principle that recent
data should be weighted more heavily and ‘smoothes’ out cyclical fluctuations to forecast the trend. To use
exponential smoothing to extrapolate, the administrator should first clean and deseasonalise the data, and select
reasonable smoothing factors. The administrator then calculates an average and trend from the data and uses
these to derive a forecast (Makridakis, Wheelwright & Hyndman 1998).

Statistical extrapolations are cost effective when forecasts are needed for each of hundreds of inventory items.
They are also useful where forecasters are biased or ignorant of the situation (Armstrong 2001b).

Allow for seasonality when using quarterly, monthly, or daily data. Most firms do this (Dalrymple 1987).
Seasonality adjustments led to substantial gains in accuracy in the large-scale study of time series by Makridakis
et al. (1984). They should be dampened because seasonal adjustment programs tend to over-adjust for
seasonality (Miller and Williams 2004); this follows the principle of being conservative in the face of


                                                                                                                     6
uncertainty. Software for          calculating   damped      seasonal    adjustment     factors    is   available    at
forecastingprinciples.com.

Retail scanner technology provides reliable and up-to-date data for extrapolating sales of existing products. As a
result, forecast accuracy should improve, especially because error in assessing the current situation is reduced.
Not knowing where you are starting from is often a major source of error in predicting future values.


Quantitative analogies

Experts can identify situations that are analogous to a given situation. These can be used to extrapolate the
outcome of a target situation. For example, to assess the loss in sales when the patent protection for a drug is
removed, one might examine the historical pattern of sales for analogous drugs.

To forecast using quantitative analogies, ask experts to identify situations that are analogous to the target
situation and for which data are available. If the analogous data provides information about the future of the
target situation, such as per capita ticket sales for a play that is touring from city to city, forecast by calculating
averages. If not, construct one model using target situation data and another using analogous data. Combine the
parameters of the models, and forecast with the combined model.

While Duncan et al. (2001) provide evidence that accuracy can be improved by using data from analogous time
series we found no other evidence on the relative accuracy of quantitative analogies forecasts.


Rule-based forecasting

Rule-based forecasting (RBF) is a type of expert system that allows one to integrate managers’ knowledge about
the domain with time-series data in a structured and inexpensive way. For example, in many cases a useful
guideline is that trends should be extrapolated only when they agree with managers’ prior expectations. When
the causal forces are contrary to the trend in the historical series, forecast errors tend to be large (Armstrong and
Collopy 1993). Although such problems occur only in a small percentage of cases, their effects are serious.

To apply RBF, one must first identify features of the series using statistical analysis, inspection, and domain
knowledge (including causal forces). The rules are then used to adjust data, and to estimate short- and long-
range models. RBF forecasts are a blend of the short- and long-range model forecasts.

RBF is most useful when substantive domain knowledge is available, patterns are discernable in the series,
trends are strong, and forecasts are needed for long horizons. Under such conditions, errors for rule-based
forecasts are substantially less than those for combined forecasts (Armstrong, Adya, and Collopy 2001). In cases
where the conditions were not met, forecast accuracy is not harmed. Information on rule-based forecasting is
available from the special-interest-group pages at forecastingprinciples.com.


Neural nets

Neural networks are computer intensive methods that use decision processes analogous to those of the human
brain. Like the brain, they have the capability of learning as patterns change and updating their parameter
estimates. However, much data is needed in order to estimate neural network models and to reduce the risk of
over-fitting the data (Adya and Collopy 1998).

There is some evidence that neural network models can produce forecasts that are more accurate than those from
other methods (Adya and Collopy 1998). While this is encouraging, our current advice is to avoid neural
networks because the method ignores prior knowledge and because the results are difficult to understand.
Information on neural networks is available from the special interest group pages on the
forecastingprinciples.com site. Reviews of commercial software are available from the same site.


                                                                                                                     7
Data mining

Data mining uses sophisticated statistical analyses to identify relationships. It is a popular approach. For
example, an August 2005 Google search using the term “data mining” found over seven million sites. When we
included either “prediction” or “forecasting” in the search, Google found over 560,000 sites.

Data mining ignores theory and prior knowledge in a search for patterns. Despite ambitious claims and much
research effort, we are not aware of evidence that data mining techniques provide benefits for forecasting. In
their extensive search and reanalysis of data from published research, Keogh and Kasetty (2002) found little
evidence for that data mining is useful. A large part of this, they said, was due to the fact that few studies have
used a proper design to assess data mining. To find out more about data mining, see the-data-mine.com.


Causal models

Causal models are based on prior knowledge and theory. Time-series regression and cross-sectional regression
are commonly used for estimating model parameters or coefficients. These models allow one to examine the
effects of marketing activity, such as a change in price, as well as key aspects of the market, thus providing
information for contingency planning.

To develop causal models, one needs to select causal variables by using theory and prior knowledge. The key is
to identify important variables, the direction of their effects, and any constraints. One should aim for a
relatively simple model and use all available data to estimate it (Allen and Fildes 2001). Surprisingly,
sophisticated statistical procedures have not led to more accurate forecasts. In fact, crude estimates are often
sufficient to provide accurate forecasts when using cross-sectional data (Dawes and Corrigan 1974; Dana and
Dawes 2005).

Statisticians have developed sophisticated procedures for analyzing how well models fit historical data. Such
procedures have, however, been on little value to forecasters. Measures of fit (such as R2 or the standard error
of the estimate of the model) have little relationship with forecast accuracy and they should therefore be
avoided. Instead, holdout data should be used to assess the predictive validity of a model. This conclusion is
based on findings from many studies with time-series data (Armstrong, 2001c). Statistical fit does relate to
forecast accuracy for cross-sectional data, although the relationship is tenuous.

Causal models are most useful when (1) strong causal relationships are expected, (2) the direction of the
relationship is known, (3) causal relationships are known or they can be estimated, (4) large changes are
expected to occur in the causal variables over the forecast horizon, and (5) changes in the causal variables can
be accurately forecast or controlled, especially with respect to their direction. Reviews of commercial software
that can be used to develop causal models are provided at the forecastingprinciples.com site.


Segmentation

Segmentation involves breaking a problem down into independent parts, using data for each part to make a
forecast, and then combining the parts. For example, a company could forecast sales of wool carpet separately
for each climatic region, and then add the forecasts.

To forecast using segmentation, one must first identify important causal variables that can be used to define the
segments, and their priorities. For example, age and proximity to a beach are both likely to influence demand for
surfboards, but the latter variable should have the higher priority; therefore, segment by proximity, then age. For
each variable, cut-points are determined such that the stronger the relationship with dependent variable, the
greater the non-linearity in the relationship, and the more data that are available the more cut-points should be
used. Forecasts are made for the population of each segment and the behaviour of the population within the
segment using the best method or methods given the information available. Population and behaviour forecasts
are combined for each segment and the segment forecasts summed.

Where there is interaction between variables, the effect of variables on demand are non-linear, and the effects of
some variables can dominate others, segmentation has advantages over regression analysis (Armstrong 1985).
Segmentation is most useful when there are benefits from compensating errors. This is likely to occur where the
segments are independent and are of roughly equal importance, and when information on each segment is good.


                                                                                                                 8
Segmentation based on a priori selection of variables offers the possibility of improved accuracy at a low risk.
Dangerfield and Morris (1992), for example, found that bottom-up forecasting, a simple application of
segmentation, was more accurate than top-down forecasts for 74% of the 192 monthly time series tested.

In some situations changes in segments are dependent on changes in other segments. For example, liberalisation
of gambling laws in city-A might result in decreased gambling revenue in already liberal cities B, C, and D.
Efforts at dependent segmentation have gone under the names of microsimulation, world dynamics, and system
dynamics. While the simulation approach seems reasonable, the models are complex and hence there are many
opportunities for judgemental errors and biases. Armstrong (1985) found no evidence that these simulation
approaches provide valid forecasts and we have found no reason to change this assessment.


SELECTING METHODS

To use a new forecasting method, one must at least know about it. The traditional methods of gaining
knowledge, such as attending courses, reading textbooks, and using consultants, are being augmented by the
Internet. The latest methods can be fully disclosed on web sites and they can be incorporated into software
packages. For example, the complete set of rules for rule-based forecasting is available on the
forecastingprinciples.com website.


Choosing a method based on evidence

Choosing the best forecasting method for any particular situation is not a simple task, and sometimes more
than one method may be appropriate. We used empirical findings and expert opinions to develop the
flowchart for selecting methods shown in Figure 3.

                          ----------------------------------------------------------------
                             INSERT FIGURE 3: Selection Tree about here
                          -----------------------------------------------------------------

The first issue the analyst needs to address is whether the data are sufficient to permit quantitative analysis.
If not, judgmental procedures are called for. Some cases call for both approaches.

For judgmental procedures, the first issue is whether the situation involves small or large changes. For small
changes, where no policy analysis is needed and where one gets good feedback – such as with the number of
diners that will come to a restaurant at a given time – unaided judgement can work well. But if the feedback
is poor, it helps to use many experts as with Delphi or prediction markets. Where the analyst wishes to predict
the effects of different policies, he must determine whether predictions from experts or from participants such
as potential customers would be most appropriate. If it is inappropriate to ask potential customers for
predictions, judgemental bootstrapping or decomposition will help to use experts’ knowledge effectively.
Where the conditions are met for conjoint analysis, it may be possible to obtain useful forecasts from surveys
of potential customers. For cases where large changes are expected but policy analysis is not required, one
should consider expectations or intentions surveys.

Where large changes are expected and only a few decision makers are involved, competitors or suppliers for
example, simulated interaction is the best method. If experts are able think of several analogous situations,
structured analogies is also likely to provide useful forecasts.

If one has a lot of time-series data, the analyst should determine whether there is knowledge about what
empirical relationships might exist, and their magnitudes. For example, in most situations there is excellent
prior knowledge about price elasticities (Tellis 1988). If empirical knowledge of relationships is available,
use causal models. In addition, one should consider using domain knowledge, such as a manager's knowledge
about the situation. Extrapolation or neural networks may be useful in situations where large changes are
unlikely.

For time-series situations where one lacks causal knowledge, extrapolation is appropriate. If there is no prior
knowledge about relationships, but domain knowledge exists (such as if a manager knows that sales will
increase due to advertising of a price reduction), use rule-based forecasting.


                                                                                                              9
In situations where one lacks time-series data and knowledge about relationships, quantitative analogies are
appropriate. In the presence of domain knowledge or where policy analysis is needed, expert systems can be
used.

The conditions may not always be clear. In such cases, one should use two or more relevant methods, and
then combine the forecasts.


Combining forecasts

Combined forecasts improve accuracy and reduce the likelihood of large errors. In a meta-analysis,
Armstrong found an average error reduction of about 12% across 30 comparisons. They are especially useful
when the component methods differ substantially from one another. For example, Blattberg and Hoch (1990)
obtained improved sales forecast by averaging managers’ judgmental forecasts and forecasts from a
quantitative model. Considerable research suggests that, lacking well-structured domain knowledge,
unweighted averages are typically as accurate as other weighting schemes (Armstrong, 2001d).

Judgmental and statistical methods should be integrated. Armstrong and Collopy (1998) summarize research
in this area. Integration is effective when judgments are collected in a systematic manner and then used as
inputs to the quantitative models, rather than simply used as adjustments to the outputs. Unfortunately, the
latter procedure is commonly used.

In the light of the above guidelines, we now examine the needs for the types of marketing forecasts that we
identified in Figure 1.


FORECASTING MARKET SIZE

Market size is influenced by environmental factors such as economic conditions. For example, the demand for
alcoholic beverages will be influenced by such things as the size and age distribution of the population,
distribution of disposable income, publication of health research findings, laws, culture, and religious beliefs. To
forecast market size, one can use Delphi, intentions or expectations, extrapolation, causal methods, and
segmentation.


Methods that rely on judgment

Market forecasts are often based on judgement, particularly for relatively new or rapidly changing markets.
Given the risk of bias from unaided judgement, we recommend using structured methods. For example, the
Delphi technique could be used to answer questions about market size such as: ‘By what percentage will the
wine market grow over the next 10 years?’ or ‘What proportion of households will subscribe to movies on
demand over telephone or cable lines?’


Methods requiring quantitative data

When considering forecasts of market size, one can use either time-series extrapolation methods or causal
methods. Time-series extrapolation is inexpensive. Causal methods such as econometrics, while more
expensive, are expected to be the most accurate method when large changes are expected.

Organizations should use systematic procedures for scanning the environment to be sure that they do not
overlook variables that may have a large impact on their market. Periodic brainstorming with a diverse group of
experts should be sufficient to identify which variables to track.


                                                                                                                 10
FORECASTING DECISION MAKERS’ ACTIONS

The development of a successful marketing strategy sometimes depends upon having good forecasts of the
actions and reactions of competitors who might have an influence on market share. For example, if you lower
your price, will competitors follow? A variety of judgmental methods can be used to forecast competitive
actions. These include:

             • expert opinion (ask experts who know about this and similar markets);
             • intentions (ask the competitors how they would respond in a variety of situations);
             • structured analogies;
             • simulated interaction (formal acting out of the interactions among decision makers for the firm
               and its competitors); and
             • experimentation (trying the strategy on a small scale and monitoring the results).

It may also be important to forecast the actions of suppliers, distributors, collaborators, governments, and people
within one’s firm in order to develop a successful marketing strategy. Sometimes one may need to forecast the
actions of other interest groups, such as ‘concerned minorities.’ For example, how would an environmental
group react to the introduction of plastic packaging by a large fast food restaurant chain? Techniques similar to
those for forecasting competitors’ actions are likely to be useful.

Company plans typically require the cooperation of many people. An organization may decide to implement a
given marketing strategy, but will it be able to carry out the plan? Sometimes an organization fails to implement
a plan because of a lack of resources, misunderstanding, opposition by key stakeholders, or a lack of
commitment by key people. The need to forecast organizational behaviour is sometimes overlooked and can be
important. Better forecasting here might lead to more realistic plans and to plans that are easier to implement.
Surveys of key decision makers in an organization may help to assess whether a given strategy can be
implemented successfully. Simulated interactions can provide useful forecasts in such situations.

It is also important to predict the effects of the various actions. One can make such forecasts by using expert
judgment, judgmental bootstrapping, or econometric methods.


FORECASTING MARKET SHARE

If one expects the same causal forces and the same types of actions to persist into the future, a simple
extrapolation of market share, such as from a naive no-change model, is usually sufficient.

When large changes are expected, one should draw upon methods that incorporate causal reasoning. If the
anticipated changes are unusual, judgmental methods such as Delphi would be appropriate. If the changes are
expected to be large, the causes are well-understood, and if one lacks historical data, then judgmental
bootstrapping can be used to improve forecasting.

The conditions for using econometric models for forecasting market share are described by Brodie et al. (2001).
Econometric methods should be used when (1) the effects of current marketing activity are strong relative to the
residual effects of previous activity; (2) there are enough data and there is sufficient variability in the data; (3)
models can allow for different responses by different brands; (4) models can be estimated at store level; (5)
competitors actions can be forecast. Methods for predicting competitors’ actions are identified in the previous
section.

There are many ways to formulate market share models and much prior research exists to help specify them. For
example, a meta-analysis by Tellis (1988) of price elasticities of demand for 367 branded products, estimated
using econometric models, reported a mean value of -2.5. Hamilton et al.’s (1997) analysis of 406 brand price
elasticities also reported a value of -2.5. Estimates can also be made about other measures of market activity,
such as advertising elasticity.


                                                                                                                  11
FORECASTING DEMAND DIRECTLY

By direct forecasts, we mean those that focus only on the last box in our Figure 1. We first describe methods
that rely on judgment. The most important application here is to new products. Following that we describe
methods that can be used when quantitative data are available.


Methods that rely on judgment

The choice of a forecasting method to estimate customer demand for a product depends on what stage it has
reached in its life cycle. As a product moves from the concept phase to prototype, test market, introduction,
growth, maturation, and declining stages, the relative value of the alternative forecasting methods changes. In
general, the movement is from purely judgmental approaches to quantitative models.

Surveys of consumers’ intentions and expectations are often used for new product forecasts. Intentions to
purchase new products are complicated because potential customers may not be sufficiently familiar with the
proposed product and because the various features of the product affect one another (e.g., price, quality and
distribution channel). This suggests the need to prepare a good description of the proposed product. A product
description may involve prototypes, visual aids, product clinics or laboratory tests. They can also improve
forecasts even when you already have other data (Armstrong, Morwitz, & Kumar 2000).

Expert opinions are widely used in the concept phase. For example, it is common to obtain forecasts from the
sales force. It is important to properly pose the questions, adjust for biases in experts’ forecasts, and aggregate
their responses. The Delphi method provides a useful way to conduct such surveys.

Errors in the description can be critical. For example, one of us was asked to forecast demand for the product of
a new electricity retailer. As the retailer described the proposed product, an important feature was the ease with
which customers would be able to swap their account to the new supplier. All they would have to do was to call
the toll-free number and tell the friendly operator their telephone number. Despite our concern that this level of
ease might not be achievable we proceeded to forecast demand using the electricity company’s description. In
the event, the existing supplier refused to transfer accounts without onerous proof, and demand was lower than
predicted. This suggests the need to prepare alternative descriptions so as to forecast for possible changes.

Intentions surveys are most likely to be useful for short-term forecasts and business-to-business sales. As an
alternative to asking potential customers about their intentions to purchase, one can ask experts to predict how
consumers will respond. For example, Wotruba and Thurlow (1976) discuss how opinions from members of the
sales force can be used to forecast demand. One could also ask distributors or marketing executives to make
forecasts. Experts may be able to make better forecasts if the problem is decomposed in such a way that the
parts to be forecast are better known to them than the whole. Thus, if the task was to forecast the sales of high-
definition television sets rather than making a direct forecast, one could break the problem into parts such as
‘How many households will there be in the U.S. in the forecast year?’ ‘Of these households, what percentage
will make more than $30,000 per year?’ ‘Of these households, how many have not purchased a large screen TV
in the past year?’ and so on. The forecasts are obtained by multiplying the components. Unfortunately, experts
are often subject to biases when they make forecasts for new products (Tyebjee 1987). Sales people may try to
forecast on the low side if their forecasts will be used to set quotas. Marketing executives may forecast high,
believing that this will gain approval for the project or motivate the sales force. If possible, you should avoid
experts who would have obvious reasons to be biased. Another strategy is to use a heterogeneous group of
experts in the hope that their differing biases tend to cancel one another.

Conjoint analysis is widely used by firms (Wittink and Bergestuen, 2001). It was used successfully in the
design of a new Marriott hotel chain (Wind et al., 1989). The use of the method to forecast new product
demand can be expensive because it requires large samples of potential customers, the potential customers
may be difficult to locate, and the questionnaires are not easy for respondents to complete. Respondents must
also understand the concepts that they are being asked to evaluate.

Expert judgments can be used in a manner analogous to conjoint analysis. That is, experts would make
predictions about situations involving alternative product designs and alternative marketing plans. These
predictions would then be related to the situations by regression analysis. It has advantages as compared to
conjoint analysis in that few experts are needed (probably between five and twenty). In addition, expert
judgments can incorporate policy variables, such as advertising, that are difficult for consumers to assess.


                                                                                                                12
Analogous products can be used to forecast demand for new products. One collects a set of analogous products
and examines their growth patterns (Claycamp and Liddy, 1969). The typical pattern can then be used as a
forecast.

Large errors are typical for new product forecasts. Tull (1967) estimated the mean absolute percentage error for
new product sales to be about 65 percent. It is not surprising then, that pre-test models have gained wide
acceptance among business firms. Shocker and Hall (1986) provided an evaluation of some of these models
Because of the lack of systematic and unbiased forecast validation studies they could draw no conclusions about
which methods were most accurate.


Methods requiring quantitative data

Once a new product is on the market, it is possible to use extrapolation methods. For early sales, much
attention has been given to the selection of the proper functional form. The diffusion literature uses an S-
shaped curve to predict new product sales. That is, growth builds up slowly at first, becomes rapid if word of
mouth is good and if people see the product being used by others. Then it slows as it approaches a saturation
level. A substantial literature exists on diffusion models. Despite this, the number of comparative validation
studies is small and the benefits of choosing the best functional form are modest (Meade and Islam, 2001).

When many demand forecasts are needed, extrapolation is often preferred. Relatively simple methods suffice.
Sophistication beyond a modest level does not improve accuracy, but it does increase costs and reduce
understanding. Decomposition is appropriate when component series can be forecast more accurately than the
aggregate.


UNCERTAINTY

In addition to improving accuracy, forecasting is concerned with assessing uncertainty. This can help manage
the risk associated with alternative plans.

Traditional error measures, such as the mean square error (MSE), do not provide a reliable basis for
comparison of forecasting methods (Armstrong and Collopy, 1992). The median absolute percentage error
(MdAPE) is more appropriate because it is invariant to scale and is not influenced by outliers. When
comparing methods, especially when testing on a small number of series, control for degree of difficulty in
forecasting by using the median relative absolute error (MdRAE), which compares the error for a given
model against errors for the naive, no change forecast (Armstrong and Collopy, 1992).

Statisticians have relied heavily on tests of statistical significance for assessing uncertainty. However, statistical
significance is inappropriate for assessing uncertainty in forecasting. Furthermore, its use has been attacked as
being misleading (e.g., see Cohen, 1994). It is difficult to find studies in marketing forecasting where statistical
significance has made an important contribution.

Instead of statistical significance, the focus should be on prediction intervals. Chatfield (2001) summarizes
research on prediction intervals. Unfortunately, prediction intervals are not widely used in practice. Tull’s
(1967) survey noted that only 25% of 16 respondent companies said they provided confidence intervals with
their forecasts. Dalrymple (1987) found that 48% did not use confidence intervals, and only 10% ‘usually’ used
them.

The fit of a model to historical data is a poor way to estimate prediction intervals. It typically results in
confidence intervals that are too narrow. It is best to simulate the actual forecasting procedure as closely as
possible, and use the distribution of the resulting ex ante forecasts to assess uncertainty. For example, if you
need to make forecasts for two years ahead, withhold enough data to be able to have a number of two-year-
ahead ex ante forecasts.


                                                                                                                   13
Uncertainty in judgmental forecasts

Experts are typically overconfident (Arkes, 2001). In McNee’s (1992) examination of economic forecasts from
22 economists over 11 years, the actual values fell outside the range of their prediction intervals about 43% of
the time. This occurs even when subjects are warned in advance against overconfidence. Fortunately, there are
procedures to improve the calibration of judges. Where possible, judges should be provided with timely and
unambiguous information on outcomes along with reasons why they were right or wrong. When feedback is
good, judges’ confidence intervals are well-calibrated. For example, 60% of the times weather forecasters say
that there is a 60% chance of rain, it rains. This suggests that marketing forecasters would do well to seek the
standard of feedback received by weather forecasters.

In cases where good feedback is not possible, ask experts to write all the reasons why their forecasts might be
wrong (Arkes, 2001). Alternatively, use the devil’s advocate procedure, where someone is assigned for a
short time to raise arguments about why the forecast might be wrong. But, be warned, being a devil’s
advocate can be make you unpopular with your group.

Still another way to assess uncertainty is to examine the agreement among judgmental forecasts. For
example, Ashton (1985), in a study of forecasts of annual advertising sales for Time magazine, found that the
agreement among the individual judgmental forecasts was a good proxy for uncertainty.


Uncertainty in quantitative forecasts

Prediction intervals from quantitative forecasts tend to be too narrow even when based on ex ante n-ahead
forecasts. Some empirical studies have shown that the percentage of actual values that fall outside the 95%
prediction intervals is substantially greater than 5%, and sometimes greater than 50% (Makridakis et al.,
1987). One reason this occurs is because the estimates ignore various sources of uncertainty. For example,
discontinuities might occur over the forecast horizon. In addition, forecast errors in time series are often
asymmetric, so this makes it difficult to estimate prediction intervals. Asymmetry of errors is likely to occur
when the forecasting model uses an additive trend. The most sensible procedure is to transform the forecast
and actual values to logs, then calculate the prediction intervals using logged differences. Interestingly,
researchers and practitioners seldom follow this advice (except where the original forecasting model has been
formulated in logs). Evidence on the issue of asymmetrical errors is provided in Armstrong and Collopy
(2001).

Loss functions can also be asymmetric. For example, the cost of a forecast that is too low by 50 units may
differ from the cost if it is too high by 50 units. But this is a problem for the planner, not the forecaster.


GAINING ACCEPTANCE OF FORECASTS

Forecasts that contradict management’s expectations have much potential value. However, they may be
ignored (Griffith and Wellman, 1979). One way to avoid this problem is to gain agreement on what
forecasting procedures to use prior to presenting the forecasts. This may involve making adjustments to the
forecasting method in order to develop forecasts that will be used.

Another way to gain acceptance of forecasts is to ask decision makers to decide in advance what decisions
they will make given different possible forecasts. Are the decisions affected by the forecasts?

Prior agreements on process and on decisions can greatly enhance the value of forecasts, but they are difficult
to achieve in many organizations. The use of scenarios can aid this process. Scenarios involve providing
information about a future situation to a decision maker and asking him to project himself into the situation
and write the stories about what he did. They should be written in the past tense. Detailed instructions for
writing scenarios are summarized in Gregory and Duran (2001). Scenarios are effective in getting managers
to accept the possibility that certain events might occur. They should not be used to make forecasts, however,
because they distort one’s assessment of the likelihood that the events will occur.


                                                                                                             14
CONCLUSIONS

Significant gains have been made in forecasting for marketing, especially since 1960. Advances have
occurred in the development of methods based on judgment, such as Delphi, simulated interactions,
intentions studies, opinions surveys, bootstrapping, and combining. They have also occurred for methods
based on statistical data, such as extrapolation, rule-based forecasting, and econometric methods. Most
recently, gains have come from the integration of statistical and judgmental forecasts.


General principles

    •    Managers’ domain knowledge should be incorporated into forecasting methods.
    •    When making forecasts in highly uncertain situations, be conservative. For example, the trend
         should be dampened over the forecast horizon.
    •    Complex methods have not proven to be more accurate than relatively simple methods. Given their
         added cost and the reduced understanding among users, highly complex procedures cannot be
         justified.
    •    When possible, forecasting methods should use data on actual behaviour, rather than judgments or
         intentions, to predict behaviour.
    •    Methods that integrate judgmental and statistical data and procedures (e.g., rule-based forecasting)
         can improve forecast accuracy in many situations.
    •    Overconfidence occurs with quantitative and judgmental methods.
    •    When making forecasts in situations with high uncertainty, use more than one method and combine
         the forecasts, generally using simple averages.


Methods based on judgment

    •    When using judgment, rely on structured procedures such as Delphi, simulated interaction,
         structured analogies, and conjoint analysis.
    •    Simulated interaction is useful to predict the decisions in conflict situations, such as in negotiations.
    •    In addition to seeking good feedback, forecasters should explicitly list all the things that might be
         wrong about their forecast. This will produce better calibrated prediction intervals.


Methods based on statistical data

    •    With the proliferation of data, causal models play an increasingly important role in forecasting
         market size, market share, and sales.
    •    Methods should be developed primarily on the basis of theory, not data.

Finally, efforts should be made to ensure forecasts are free of political considerations in a firm. To help with
this, emphasis should be on gaining agreement about the forecasting methods. Also, for important forecasts,
decisions on their use should be made before the forecasts are provided. Scenarios are helpful in guiding this
process.


                                                   REFERENCES


Adya, M. and Collopy, F. (1998), “How effective are neural nets at forecasting and prediction? A review and
      evaluation,” Journal of Forecasting, 17, 451-461.
Allen, P. G. and Fildes, R. (2001), “Econometric forecasting,” in J. S. Armstrong (Ed.) Principles of Forecasting.
      Norwell, MA: Kluwer Academic Publishers, pp. 303-362..
Arkes, M. R. (2001), “Overconfidence in judgmental forecasting,” in J. S. Armstrong (Ed.) Principles of Forecasting.
      Norwell, MA: Kluwer Academic Publishers, pp. 495-515.
Armstrong, J. S. (Ed.) (2001), Principles of Forecasting. Norwell, MA: Kluwer Academic Publishers.
Armstrong, J. S. (1985), Long-term Forecasting: From Crystal Ball to Computer (2nd ed.). New York: John Wiley.
Armstrong, J. S. (2001a), “Judgmental bootstrapping: Inferring experts' rules for forecasting,” in J. S. Armstrong (Ed.)
      Principles of Forecasting. Norwell, MA: Kluwer Academic Publishers, pp. 171-192.


                                                                                                                     15
Armstrong, J. S. (2001b), “Extrapolation of time-series and cross-sectional data,” in J. S. Armstrong (Ed.) Principles
       of Forecasting. Norwell, MA: Kluwer Academic Publishers, pp. 217-243.
Armstrong, J. S. (2001c), “Evaluating forecasting methods,” in J. S. Armstrong (Ed.) Principles of Forecasting.
       Norwell, MA: Kluwer Academic Publishers, pp. 365-382.
Armstrong, J. S. (2001d), “Combining forecasts,” in J. S. Armstrong (Ed.) Principles of Forecastings. Norwell, MA:
       Kluwer Academic Publishers, pp. 417-439.
Armstrong, J. S., Adya, M. and Collopy, F. (2001), “Rule-based forecasting: Using judgment in time-series
       extrapolation,” in J. S. Armstrong (Ed.) Principles of Forecasting. Norwell, MA: Kluwer Academic Publishers,
       pp. 259-282.
Armstrong, J. S. and Collopy, F. (2001), “Identification of asymmetric prediction intervals through causal forces,”
       Journal of Forecasting, 20, 273-283.
Armstrong, J. S. and Collopy, F. (1998), “Integration of statistical methods and judgment for time series forecasting:
       Principles from empirical research, “in G. Wright and P. Goodwin (Eds.), Forecasting with Judgment.
       Chichester: John Wiley.
Armstrong, J. S. and Collopy, F. (1993), “Causal forces: Structuring knowledge for time series extrapolation,” Journal
       of Forecasting, 12, 103-115.
Armstrong, J. S. and Collopy, F. (1992), “Error measures for generalizing about forecasting methods: empirical
       comparisons,” International Journal of Forecasting, 8, 69-80.
Armstrong, J. S., Morwitz V. and Kumar. V. (2000), “Sales forecasts for existing consumer products and
       services: Do purchase intentions contribute to accuracy?” International Journal of Forecasting, 16, 383-
       397.
Ashton, A. H. (1985), “Does consensus imply accuracy in accounting studies of decision making?” Accounting
       Review, 60, 173-185.
Blattberg, R. C. and Hoch, S. J. (1990), “Database models and managerial intuition: 50 percent model + 50 percent
       manager,” Management Science, 36, 887-899.
Brodie, R. J., Danaher, P., Kumar, V. and Leeflang, R. (2001), “Econometric models for forecasting market share,” in
       J. S. Armstrong (Ed.) Principles of Forecasting. Norwell, MA: Kluwer Academic Publishers, pp. 597-611.
Chatfield, C. (2001), “Prediction intervals for time series,” in J. S. Armstrong (Ed.) Principles of Forecasting:.
       Norwell, MA: Kluwer Academic Publishers, pp. 475-494.
Claycamp, H. J. and Liddy, L. E. (1969), “Prediction of new product performance: An analytical approach,” Journal
       of Marketing Research, 6, 414-420.
Cohen, J. (1994), “The earth is round (p < .05),” American Psychologist, 49, 997-1003.
Collopy, F, Adya, M. and Armstrong, J. S. (2001), “Expert systems for forecasting,” in J. S. Armstrong (Ed.)
       Principles of Forecastin. Norwell, MA: Kluwer Academic Publishers, pp. 285-300
Dalrymple, D. J. (1975), “Sales forecasting: Methods and accuracy,” Business Horizons, 18, 69-73.
Dalrymple, D. J. (1987), “Sales forecasting practices: Results from a U.S. survey,” International Journal of
       Forecasting, 3, 379-391.
Dana, Jason & Robyn M. Dawes (2004), “The superiority of simple alternatives to regression for social science
       predictions,” Journal of Educational and Behavioral Statistics, 29 (3), 317-331.
Dangerfield, B. J. and Morris, J. S. (1992), “Top-down or bottom-up: Aggregate versus disaggregate
       extrapolations,” International Journal of Forecasting, 8, 233-241.
Dawes, Robyn M. & B. Corrigan (1974), “Linear models in decision making,” Psychological Bulletin, 81, 95-
       106.
Dillman, D. A. (2000), Mail and Internet Surveys: The Tailored Design Method, (2nd ed.). New York: John Wiley.
Duncan, G., Gorr, W. and Szczypula, J. (2001),, “Forecasting analogous time series,” in J. S. Armstrong (Ed.)
       Principles of Forecasting. Norwell, MA: Kluwer Academic Publishers, pp. 195-213.
Gregory, L. and Duran, A. (2001), “Scenarios and acceptance of forecasts,” in J. S. Armstrong (Ed.) Principles of
       Forecasting. Norwell, MA: Kluwer Academic Publishers, pp. 519-541.
Green, K. C. (2005), Game theory, simulated interaction, and unaided judgment for forecasting decisions in
       conflicts: Further evidence. International Journal of Forecasting, 21, 463-472.
Green, K. C. (2002), Forecasting decisions in conflict situations: A comparison of game theory, role-playing,
       and unaided judgement. International Journal of Forecasting, 18, 321-344.
Green, Kesten C. & J. S. Armstrong (2005a), “Value of expertise for forecasting decisions in conflicts"
       Department of Marketing Working Paper, The Wharton School.
Green, Kesten C. & J. S. Armstrong (2005b), “Structured analogies for forecasting,” Department of Marketing
       Working Paper, The Wharton School.
Griffith, J. R. and Wellman, B. T. (1979), “Forecasting bed needs and recommending facilities plans for community
       hospitals: A review of past performance,” Medical Care, 17, 293-303.
Hamilton, W, East, R. and Kilafatis, S. (1997), “The measurement and utility of brand price elasticities,” Journal of
       Marketing Management, 13, 285-298.


                                                                                                                   16
Jobber, D., Hooley G. and Sanderson, S. (1985), “Marketing in a hostile environment: The British textile industry,”
       Industrial Marketing Management, 14, 35-41.
Juster, T. (1966), “Consumer buying intentions and purchase probability: An experiment in survey design,” Journal of
       the American Statistical Association, 61, 658-696.
Keogh, Eamonn & Shruti Kasetty (2002), “On the need for time series data mining benchmarks: A survey and
       empirical demonstration,” Proceedings of the Eighth ACM SIGKDD International Conference on
       Knowledge Discovery and Data Mining.
MacGregor, D. (2001), “Decomposition for judgmental forecasting and estimation,” in J. S. Armstrong (Ed.)
       Principles of Forecasting. Norwell, MA: Kluwer Academic Publishers, pp. 107-123.
Makridakis, S., Andersen, A., Carbone, R., Fildes, R., Hibon, M., Lewandowski, R., Newton, J., Parzen, E. and
       Winkler, R. (1984), The Forecasting Accuracy of Major Times-Series Methods. Chichester: John Wiley.
Makridakis, S., Hibon, M., Lusk, F. and Belhadjali, M. (1987), “Confidence intervals: An empirical investigation of
       tine series in the M-competition,” International Journal of Forecasting, 3, 489-508.
Makridakis, S., Wheelwright, S. C., and Hyndman, R. J. (1998), Forecasting Methods for Management, Third
       edition. New York: John Wiley.
McNees, S. K. (1992), The uses and abuses of consensus’ forecasts,” Journal of Forecasting, 11, 703-710.
Meade, N. and Islam, T. (2001), “Forecasting the diffusion of innovations: Implications for time series extrapolation,”
       in J. S. Armstrong (Ed.) Principles of Forecasting. Norwell, MA: Kluwer Academic Publishers, pp. 4577-595.
Miller, Don M. & Dan Williams (2004), “Shrinkage estimators for damping X12-ARIMA seasonals,”
       International Journal of Forecasting, 20, 529-549.
Morwitz, V. (2001), “Methods for forecasting from intentions data,” in J. S. Armstrong (Ed.) Principles of
       Forecasting. Norwell, MA: Kluwer Academic Publishers, pp. 33-56.
Rhode, Paul W. and Koleman S. Strumpf (2004), “Historical presidential betting markets,” Journal of
       Economic Perspectives, 18 (2): 127-142.
Rowe, G. and Wright, G. (2001), “Expert opinions in forecasting role of the Delphi technique,” in J. S.
       Armstrong (Ed.) Principles of Forecasting:. Norwell, MA: Kluwer Academic Publishers, pp. 125-144.
Shocker, A. D. and Hall, W. G. (1986), “Pretest market models: A critical evaluation,” Journal of Product
       Innovation Management, 3, 86-107.
Tellis, G. J. (1988),”The price elasticity of selective demand: A meta-analysis of econometric models of
       sales,” Journal of Marketing Research, 25, 331-341.
Tull, D. S. (1967), “The relationship of actual and predicted sales and profits in new product introductions,”
       Journal of Business, 40, 233-250.
Tyebjee, T. T. (1987), “Behavioral biases in new product forecasting,” International Journal of Forecasting,
       3, 393-404.
Wind, J., Green, P. E, Shifflet, D., and Scarbrough, M. (1989), “Courtyard by Marriott: Designing a hotel
       facility with consumer-based marketing,” Interfaces, 19, 1, 25-47.
Wittink, D. R, and Bergestuen, T. (2001), “Forecasting with conjoint analysis,” in J. S. Armstrong (Ed.)
       Principles of Forecasting:. Norwell MA: Kluwer Academic Publishers, pp. 147-167.
Wolfers, Justin & Eric Zitzewitz (2004), “Prediction markets,” Journal of Economic Perspectives, 18 (2), 107-
       126.
Wotruba, T. R. and Thurlow, M.L. (1976), “Sales force participation in quota setting and sales forecasting,”
       Journal of Consumer Research, 8, 162-171.


                                                                                                                    17

Weitere ähnliche Inhalte

Was ist angesagt?

WeikaiLi_Publication
WeikaiLi_PublicationWeikaiLi_Publication
WeikaiLi_PublicationWeikai Li
 
Sentiment Analysis
Sentiment AnalysisSentiment Analysis
Sentiment AnalysisUdit Gupta
 
3 demand-forecasting
3 demand-forecasting3 demand-forecasting
3 demand-forecastingSatish Raju
 
Forecasting lessons from FMCG aisles
Forecasting lessons from FMCG aisles   Forecasting lessons from FMCG aisles
Forecasting lessons from FMCG aisles Tristan Wiggill
 
Approach based on linear regression for
Approach based on linear regression forApproach based on linear regression for
Approach based on linear regression forijaia
 
Indian Stock Market Using Machine Learning(Volume1, oct 2017)
Indian Stock Market Using Machine Learning(Volume1, oct 2017)Indian Stock Market Using Machine Learning(Volume1, oct 2017)
Indian Stock Market Using Machine Learning(Volume1, oct 2017)sk joshi
 
Demand forecasting
Demand forecastingDemand forecasting
Demand forecastingdkamalim92
 
Regressioin mini case
Regressioin mini caseRegressioin mini case
Regressioin mini caseveesingh
 
Persistence performance
Persistence performancePersistence performance
Persistence performancebfmresearch
 
Star mine arm_white_paper
Star mine arm_white_paperStar mine arm_white_paper
Star mine arm_white_paperIta Kamis
 
TOURISM DEMAND FORECASTING MODEL USING NEURAL NETWORK
TOURISM DEMAND FORECASTING MODEL USING NEURAL NETWORKTOURISM DEMAND FORECASTING MODEL USING NEURAL NETWORK
TOURISM DEMAND FORECASTING MODEL USING NEURAL NETWORKijcsit
 
Presentation on forecasting
Presentation on forecasting Presentation on forecasting
Presentation on forecasting Muhammad Sharjeel
 
The Statistical Mystique
The Statistical MystiqueThe Statistical Mystique
The Statistical Mystiquetpkcfa
 

Was ist angesagt? (18)

ymca821-.pdf-published paper-5.pdf++
ymca821-.pdf-published paper-5.pdf++ymca821-.pdf-published paper-5.pdf++
ymca821-.pdf-published paper-5.pdf++
 
WeikaiLi_Publication
WeikaiLi_PublicationWeikaiLi_Publication
WeikaiLi_Publication
 
Sentiment Analysis
Sentiment AnalysisSentiment Analysis
Sentiment Analysis
 
3 demand-forecasting
3 demand-forecasting3 demand-forecasting
3 demand-forecasting
 
Forecasting lessons from FMCG aisles
Forecasting lessons from FMCG aisles   Forecasting lessons from FMCG aisles
Forecasting lessons from FMCG aisles
 
Production operations management
Production operations managementProduction operations management
Production operations management
 
Approach based on linear regression for
Approach based on linear regression forApproach based on linear regression for
Approach based on linear regression for
 
Indian Stock Market Using Machine Learning(Volume1, oct 2017)
Indian Stock Market Using Machine Learning(Volume1, oct 2017)Indian Stock Market Using Machine Learning(Volume1, oct 2017)
Indian Stock Market Using Machine Learning(Volume1, oct 2017)
 
Demand forecasting
Demand forecastingDemand forecasting
Demand forecasting
 
Aliano neural
Aliano neuralAliano neural
Aliano neural
 
Regressioin mini case
Regressioin mini caseRegressioin mini case
Regressioin mini case
 
Stock market model
Stock market modelStock market model
Stock market model
 
Persistence performance
Persistence performancePersistence performance
Persistence performance
 
Star mine arm_white_paper
Star mine arm_white_paperStar mine arm_white_paper
Star mine arm_white_paper
 
TOURISM DEMAND FORECASTING MODEL USING NEURAL NETWORK
TOURISM DEMAND FORECASTING MODEL USING NEURAL NETWORKTOURISM DEMAND FORECASTING MODEL USING NEURAL NETWORK
TOURISM DEMAND FORECASTING MODEL USING NEURAL NETWORK
 
Presentation on forecasting
Presentation on forecasting Presentation on forecasting
Presentation on forecasting
 
13F_working_paper
13F_working_paper13F_working_paper
13F_working_paper
 
The Statistical Mystique
The Statistical MystiqueThe Statistical Mystique
The Statistical Mystique
 

Ähnlich wie Demand forcasting

Uncertainty
UncertaintyUncertainty
UncertaintyJan Zika
 
3rd alex marketing club (pharmaceutical forecasting) dr. ahmed sham'a
3rd  alex marketing club (pharmaceutical forecasting) dr. ahmed sham'a3rd  alex marketing club (pharmaceutical forecasting) dr. ahmed sham'a
3rd alex marketing club (pharmaceutical forecasting) dr. ahmed sham'aMahmoud Bahgat
 
A Sales Forecasting Model Based on Internal Organizational Variables.pdf
A Sales Forecasting Model Based on Internal Organizational Variables.pdfA Sales Forecasting Model Based on Internal Organizational Variables.pdf
A Sales Forecasting Model Based on Internal Organizational Variables.pdfAnna Landers
 
HollyGauldin_Unit 3_Assignment_MT450
HollyGauldin_Unit 3_Assignment_MT450HollyGauldin_Unit 3_Assignment_MT450
HollyGauldin_Unit 3_Assignment_MT450Holly Gauldin
 
Alessandro Comai (2005) Discover Hidden Needs brf frontiers - proceeding pa...
Alessandro Comai (2005) Discover Hidden Needs   brf frontiers - proceeding pa...Alessandro Comai (2005) Discover Hidden Needs   brf frontiers - proceeding pa...
Alessandro Comai (2005) Discover Hidden Needs brf frontiers - proceeding pa...miniera
 
Statistics For Bi
Statistics For BiStatistics For Bi
Statistics For BiAngela Hays
 
Marketing analytics hasn in lahore
Marketing analytics hasn in lahoreMarketing analytics hasn in lahore
Marketing analytics hasn in lahorewaleednaveed3
 
Assessing Internal ControlsAs a professional working for a large.docx
Assessing Internal ControlsAs a professional working for a large.docxAssessing Internal ControlsAs a professional working for a large.docx
Assessing Internal ControlsAs a professional working for a large.docxdavezstarr61655
 
Strategy under uncertainty by
Strategy under uncertainty byStrategy under uncertainty by
Strategy under uncertainty bysunil prasad
 
FDA_SAKEC2018.pptx
FDA_SAKEC2018.pptxFDA_SAKEC2018.pptx
FDA_SAKEC2018.pptxmviji
 
Case Study of Forecasting Fundamentals - Fashion
Case Study of Forecasting Fundamentals - FashionCase Study of Forecasting Fundamentals - Fashion
Case Study of Forecasting Fundamentals - FashionAkansha Choudhary
 
Time Series Analysis
Time Series AnalysisTime Series Analysis
Time Series AnalysisAmanda Reed
 
Competitive Intelligence Management
Competitive Intelligence ManagementCompetitive Intelligence Management
Competitive Intelligence ManagementHendry Hartono
 
Keys to extract value from the data analytics life cycle
Keys to extract value from the data analytics life cycleKeys to extract value from the data analytics life cycle
Keys to extract value from the data analytics life cycleGrant Thornton LLP
 
Deman forcasting
Deman forcastingDeman forcasting
Deman forcastingTinku Kumar
 
Analytics, business cycles and disruptions
Analytics, business cycles and disruptionsAnalytics, business cycles and disruptions
Analytics, business cycles and disruptionsMark Albala
 
Capital structure decisions
Capital structure decisionsCapital structure decisions
Capital structure decisionsphuongthao6689
 

Ähnlich wie Demand forcasting (20)

Uncertainty
UncertaintyUncertainty
Uncertainty
 
3rd alex marketing club (pharmaceutical forecasting) dr. ahmed sham'a
3rd  alex marketing club (pharmaceutical forecasting) dr. ahmed sham'a3rd  alex marketing club (pharmaceutical forecasting) dr. ahmed sham'a
3rd alex marketing club (pharmaceutical forecasting) dr. ahmed sham'a
 
A Sales Forecasting Model Based on Internal Organizational Variables.pdf
A Sales Forecasting Model Based on Internal Organizational Variables.pdfA Sales Forecasting Model Based on Internal Organizational Variables.pdf
A Sales Forecasting Model Based on Internal Organizational Variables.pdf
 
HollyGauldin_Unit 3_Assignment_MT450
HollyGauldin_Unit 3_Assignment_MT450HollyGauldin_Unit 3_Assignment_MT450
HollyGauldin_Unit 3_Assignment_MT450
 
Alessandro Comai (2005) Discover Hidden Needs brf frontiers - proceeding pa...
Alessandro Comai (2005) Discover Hidden Needs   brf frontiers - proceeding pa...Alessandro Comai (2005) Discover Hidden Needs   brf frontiers - proceeding pa...
Alessandro Comai (2005) Discover Hidden Needs brf frontiers - proceeding pa...
 
Statistics For Bi
Statistics For BiStatistics For Bi
Statistics For Bi
 
Marketing analytics hasn in lahore
Marketing analytics hasn in lahoreMarketing analytics hasn in lahore
Marketing analytics hasn in lahore
 
Assessing Internal ControlsAs a professional working for a large.docx
Assessing Internal ControlsAs a professional working for a large.docxAssessing Internal ControlsAs a professional working for a large.docx
Assessing Internal ControlsAs a professional working for a large.docx
 
Strategy under uncertainty by
Strategy under uncertainty byStrategy under uncertainty by
Strategy under uncertainty by
 
FDA_SAKEC2018.pptx
FDA_SAKEC2018.pptxFDA_SAKEC2018.pptx
FDA_SAKEC2018.pptx
 
Case Study of Forecasting Fundamentals - Fashion
Case Study of Forecasting Fundamentals - FashionCase Study of Forecasting Fundamentals - Fashion
Case Study of Forecasting Fundamentals - Fashion
 
Marketing project
Marketing projectMarketing project
Marketing project
 
Time Series Analysis
Time Series AnalysisTime Series Analysis
Time Series Analysis
 
Competitive Intelligence Management
Competitive Intelligence ManagementCompetitive Intelligence Management
Competitive Intelligence Management
 
6 Demand forecasting
6 Demand forecasting6 Demand forecasting
6 Demand forecasting
 
Keys to extract value from the data analytics life cycle
Keys to extract value from the data analytics life cycleKeys to extract value from the data analytics life cycle
Keys to extract value from the data analytics life cycle
 
Forecasting in OPM.pptx
Forecasting in OPM.pptxForecasting in OPM.pptx
Forecasting in OPM.pptx
 
Deman forcasting
Deman forcastingDeman forcasting
Deman forcasting
 
Analytics, business cycles and disruptions
Analytics, business cycles and disruptionsAnalytics, business cycles and disruptions
Analytics, business cycles and disruptions
 
Capital structure decisions
Capital structure decisionsCapital structure decisions
Capital structure decisions
 

Mehr von Praveen Ojha

Responsibility accounting
Responsibility accountingResponsibility accounting
Responsibility accountingPraveen Ojha
 
Activity based costing
Activity based costingActivity based costing
Activity based costingPraveen Ojha
 
Basic concepte of cost
Basic concepte of costBasic concepte of cost
Basic concepte of costPraveen Ojha
 
A project report on dmrc
A project report on dmrcA project report on dmrc
A project report on dmrcPraveen Ojha
 
Perception & personality
Perception & personalityPerception & personality
Perception & personalityPraveen Ojha
 
Supply and elasticity of supply
Supply and elasticity of supplySupply and elasticity of supply
Supply and elasticity of supplyPraveen Ojha
 
Production analysis 3
Production analysis 3Production analysis 3
Production analysis 3Praveen Ojha
 
Demand forecasting
Demand forecastingDemand forecasting
Demand forecastingPraveen Ojha
 
IAS 7 sataements of cash flows
IAS 7 sataements of cash flowsIAS 7 sataements of cash flows
IAS 7 sataements of cash flowsPraveen Ojha
 
Ias 14 segment reporting
Ias 14 segment reportingIas 14 segment reporting
Ias 14 segment reportingPraveen Ojha
 
Financial accounting
Financial accountingFinancial accounting
Financial accountingPraveen Ojha
 

Mehr von Praveen Ojha (19)

Responsibility accounting
Responsibility accountingResponsibility accounting
Responsibility accounting
 
Marginal costing
Marginal costingMarginal costing
Marginal costing
 
Cost concept
Cost conceptCost concept
Cost concept
 
Activity based costing
Activity based costingActivity based costing
Activity based costing
 
Basic concepte of cost
Basic concepte of costBasic concepte of cost
Basic concepte of cost
 
A project report on dmrc
A project report on dmrcA project report on dmrc
A project report on dmrc
 
Stp new
Stp new Stp new
Stp new
 
Mktg. environment
Mktg. environmentMktg. environment
Mktg. environment
 
Perception & personality
Perception & personalityPerception & personality
Perception & personality
 
Supply and elasticity of supply
Supply and elasticity of supplySupply and elasticity of supply
Supply and elasticity of supply
 
Production analysis 3
Production analysis 3Production analysis 3
Production analysis 3
 
Production 1
Production 1Production 1
Production 1
 
Demand forecast
Demand forecastDemand forecast
Demand forecast
 
Elasticity
ElasticityElasticity
Elasticity
 
Demand forecasting
Demand forecastingDemand forecasting
Demand forecasting
 
Production 2
Production 2Production 2
Production 2
 
IAS 7 sataements of cash flows
IAS 7 sataements of cash flowsIAS 7 sataements of cash flows
IAS 7 sataements of cash flows
 
Ias 14 segment reporting
Ias 14 segment reportingIas 14 segment reporting
Ias 14 segment reporting
 
Financial accounting
Financial accountingFinancial accounting
Financial accounting
 

Kürzlich hochgeladen

Regression analysis: Simple Linear Regression Multiple Linear Regression
Regression analysis:  Simple Linear Regression Multiple Linear RegressionRegression analysis:  Simple Linear Regression Multiple Linear Regression
Regression analysis: Simple Linear Regression Multiple Linear RegressionRavindra Nath Shukla
 
BEST ✨ Call Girls In Indirapuram Ghaziabad ✔️ 9871031762 ✔️ Escorts Service...
BEST ✨ Call Girls In  Indirapuram Ghaziabad  ✔️ 9871031762 ✔️ Escorts Service...BEST ✨ Call Girls In  Indirapuram Ghaziabad  ✔️ 9871031762 ✔️ Escorts Service...
BEST ✨ Call Girls In Indirapuram Ghaziabad ✔️ 9871031762 ✔️ Escorts Service...noida100girls
 
Cash Payment 9602870969 Escort Service in Udaipur Call Girls
Cash Payment 9602870969 Escort Service in Udaipur Call GirlsCash Payment 9602870969 Escort Service in Udaipur Call Girls
Cash Payment 9602870969 Escort Service in Udaipur Call GirlsApsara Of India
 
HONOR Veterans Event Keynote by Michael Hawkins
HONOR Veterans Event Keynote by Michael HawkinsHONOR Veterans Event Keynote by Michael Hawkins
HONOR Veterans Event Keynote by Michael HawkinsMichael W. Hawkins
 
Best VIP Call Girls Noida Sector 40 Call Me: 8448380779
Best VIP Call Girls Noida Sector 40 Call Me: 8448380779Best VIP Call Girls Noida Sector 40 Call Me: 8448380779
Best VIP Call Girls Noida Sector 40 Call Me: 8448380779Delhi Call girls
 
M.C Lodges -- Guest House in Jhang.
M.C Lodges --  Guest House in Jhang.M.C Lodges --  Guest House in Jhang.
M.C Lodges -- Guest House in Jhang.Aaiza Hassan
 
Insurers' journeys to build a mastery in the IoT usage
Insurers' journeys to build a mastery in the IoT usageInsurers' journeys to build a mastery in the IoT usage
Insurers' journeys to build a mastery in the IoT usageMatteo Carbone
 
7.pdf This presentation captures many uses and the significance of the number...
7.pdf This presentation captures many uses and the significance of the number...7.pdf This presentation captures many uses and the significance of the number...
7.pdf This presentation captures many uses and the significance of the number...Paul Menig
 
It will be International Nurses' Day on 12 May
It will be International Nurses' Day on 12 MayIt will be International Nurses' Day on 12 May
It will be International Nurses' Day on 12 MayNZSG
 
Mysore Call Girls 8617370543 WhatsApp Number 24x7 Best Services
Mysore Call Girls 8617370543 WhatsApp Number 24x7 Best ServicesMysore Call Girls 8617370543 WhatsApp Number 24x7 Best Services
Mysore Call Girls 8617370543 WhatsApp Number 24x7 Best ServicesDipal Arora
 
Pharma Works Profile of Karan Communications
Pharma Works Profile of Karan CommunicationsPharma Works Profile of Karan Communications
Pharma Works Profile of Karan Communicationskarancommunications
 
Unlocking the Secrets of Affiliate Marketing.pdf
Unlocking the Secrets of Affiliate Marketing.pdfUnlocking the Secrets of Affiliate Marketing.pdf
Unlocking the Secrets of Affiliate Marketing.pdfOnline Income Engine
 
VIP Call Girls In Saharaganj ( Lucknow ) 🔝 8923113531 🔝 Cash Payment (COD) 👒
VIP Call Girls In Saharaganj ( Lucknow  ) 🔝 8923113531 🔝  Cash Payment (COD) 👒VIP Call Girls In Saharaganj ( Lucknow  ) 🔝 8923113531 🔝  Cash Payment (COD) 👒
VIP Call Girls In Saharaganj ( Lucknow ) 🔝 8923113531 🔝 Cash Payment (COD) 👒anilsa9823
 
0183760ssssssssssssssssssssssssssss00101011 (27).pdf
0183760ssssssssssssssssssssssssssss00101011 (27).pdf0183760ssssssssssssssssssssssssssss00101011 (27).pdf
0183760ssssssssssssssssssssssssssss00101011 (27).pdfRenandantas16
 
Monthly Social Media Update April 2024 pptx.pptx
Monthly Social Media Update April 2024 pptx.pptxMonthly Social Media Update April 2024 pptx.pptx
Monthly Social Media Update April 2024 pptx.pptxAndy Lambert
 
Boost the utilization of your HCL environment by reevaluating use cases and f...
Boost the utilization of your HCL environment by reevaluating use cases and f...Boost the utilization of your HCL environment by reevaluating use cases and f...
Boost the utilization of your HCL environment by reevaluating use cases and f...Roland Driesen
 
Understanding the Pakistan Budgeting Process: Basics and Key Insights
Understanding the Pakistan Budgeting Process: Basics and Key InsightsUnderstanding the Pakistan Budgeting Process: Basics and Key Insights
Understanding the Pakistan Budgeting Process: Basics and Key Insightsseri bangash
 
Value Proposition canvas- Customer needs and pains
Value Proposition canvas- Customer needs and painsValue Proposition canvas- Customer needs and pains
Value Proposition canvas- Customer needs and painsP&CO
 
The Coffee Bean & Tea Leaf(CBTL), Business strategy case study
The Coffee Bean & Tea Leaf(CBTL), Business strategy case studyThe Coffee Bean & Tea Leaf(CBTL), Business strategy case study
The Coffee Bean & Tea Leaf(CBTL), Business strategy case studyEthan lee
 

Kürzlich hochgeladen (20)

Regression analysis: Simple Linear Regression Multiple Linear Regression
Regression analysis:  Simple Linear Regression Multiple Linear RegressionRegression analysis:  Simple Linear Regression Multiple Linear Regression
Regression analysis: Simple Linear Regression Multiple Linear Regression
 
BEST ✨ Call Girls In Indirapuram Ghaziabad ✔️ 9871031762 ✔️ Escorts Service...
BEST ✨ Call Girls In  Indirapuram Ghaziabad  ✔️ 9871031762 ✔️ Escorts Service...BEST ✨ Call Girls In  Indirapuram Ghaziabad  ✔️ 9871031762 ✔️ Escorts Service...
BEST ✨ Call Girls In Indirapuram Ghaziabad ✔️ 9871031762 ✔️ Escorts Service...
 
Cash Payment 9602870969 Escort Service in Udaipur Call Girls
Cash Payment 9602870969 Escort Service in Udaipur Call GirlsCash Payment 9602870969 Escort Service in Udaipur Call Girls
Cash Payment 9602870969 Escort Service in Udaipur Call Girls
 
HONOR Veterans Event Keynote by Michael Hawkins
HONOR Veterans Event Keynote by Michael HawkinsHONOR Veterans Event Keynote by Michael Hawkins
HONOR Veterans Event Keynote by Michael Hawkins
 
Best VIP Call Girls Noida Sector 40 Call Me: 8448380779
Best VIP Call Girls Noida Sector 40 Call Me: 8448380779Best VIP Call Girls Noida Sector 40 Call Me: 8448380779
Best VIP Call Girls Noida Sector 40 Call Me: 8448380779
 
M.C Lodges -- Guest House in Jhang.
M.C Lodges --  Guest House in Jhang.M.C Lodges --  Guest House in Jhang.
M.C Lodges -- Guest House in Jhang.
 
Insurers' journeys to build a mastery in the IoT usage
Insurers' journeys to build a mastery in the IoT usageInsurers' journeys to build a mastery in the IoT usage
Insurers' journeys to build a mastery in the IoT usage
 
7.pdf This presentation captures many uses and the significance of the number...
7.pdf This presentation captures many uses and the significance of the number...7.pdf This presentation captures many uses and the significance of the number...
7.pdf This presentation captures many uses and the significance of the number...
 
It will be International Nurses' Day on 12 May
It will be International Nurses' Day on 12 MayIt will be International Nurses' Day on 12 May
It will be International Nurses' Day on 12 May
 
Mysore Call Girls 8617370543 WhatsApp Number 24x7 Best Services
Mysore Call Girls 8617370543 WhatsApp Number 24x7 Best ServicesMysore Call Girls 8617370543 WhatsApp Number 24x7 Best Services
Mysore Call Girls 8617370543 WhatsApp Number 24x7 Best Services
 
Pharma Works Profile of Karan Communications
Pharma Works Profile of Karan CommunicationsPharma Works Profile of Karan Communications
Pharma Works Profile of Karan Communications
 
Unlocking the Secrets of Affiliate Marketing.pdf
Unlocking the Secrets of Affiliate Marketing.pdfUnlocking the Secrets of Affiliate Marketing.pdf
Unlocking the Secrets of Affiliate Marketing.pdf
 
VIP Call Girls In Saharaganj ( Lucknow ) 🔝 8923113531 🔝 Cash Payment (COD) 👒
VIP Call Girls In Saharaganj ( Lucknow  ) 🔝 8923113531 🔝  Cash Payment (COD) 👒VIP Call Girls In Saharaganj ( Lucknow  ) 🔝 8923113531 🔝  Cash Payment (COD) 👒
VIP Call Girls In Saharaganj ( Lucknow ) 🔝 8923113531 🔝 Cash Payment (COD) 👒
 
0183760ssssssssssssssssssssssssssss00101011 (27).pdf
0183760ssssssssssssssssssssssssssss00101011 (27).pdf0183760ssssssssssssssssssssssssssss00101011 (27).pdf
0183760ssssssssssssssssssssssssssss00101011 (27).pdf
 
Monthly Social Media Update April 2024 pptx.pptx
Monthly Social Media Update April 2024 pptx.pptxMonthly Social Media Update April 2024 pptx.pptx
Monthly Social Media Update April 2024 pptx.pptx
 
VVVIP Call Girls In Greater Kailash ➡️ Delhi ➡️ 9999965857 🚀 No Advance 24HRS...
VVVIP Call Girls In Greater Kailash ➡️ Delhi ➡️ 9999965857 🚀 No Advance 24HRS...VVVIP Call Girls In Greater Kailash ➡️ Delhi ➡️ 9999965857 🚀 No Advance 24HRS...
VVVIP Call Girls In Greater Kailash ➡️ Delhi ➡️ 9999965857 🚀 No Advance 24HRS...
 
Boost the utilization of your HCL environment by reevaluating use cases and f...
Boost the utilization of your HCL environment by reevaluating use cases and f...Boost the utilization of your HCL environment by reevaluating use cases and f...
Boost the utilization of your HCL environment by reevaluating use cases and f...
 
Understanding the Pakistan Budgeting Process: Basics and Key Insights
Understanding the Pakistan Budgeting Process: Basics and Key InsightsUnderstanding the Pakistan Budgeting Process: Basics and Key Insights
Understanding the Pakistan Budgeting Process: Basics and Key Insights
 
Value Proposition canvas- Customer needs and pains
Value Proposition canvas- Customer needs and painsValue Proposition canvas- Customer needs and pains
Value Proposition canvas- Customer needs and pains
 
The Coffee Bean & Tea Leaf(CBTL), Business strategy case study
The Coffee Bean & Tea Leaf(CBTL), Business strategy case studyThe Coffee Bean & Tea Leaf(CBTL), Business strategy case study
The Coffee Bean & Tea Leaf(CBTL), Business strategy case study
 

Demand forcasting

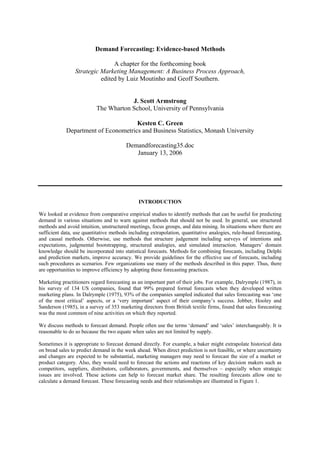
  • 1. Demand Forecasting: Evidence-based Methods A chapter for the forthcoming book Strategic Marketing Management: A Business Process Approach, edited by Luiz Moutinho and Geoff Southern. J. Scott Armstrong The Wharton School, University of Pennsylvania Kesten C. Green Department of Econometrics and Business Statistics, Monash University Demandforecasting35.doc January 13, 2006 INTRODUCTION We looked at evidence from comparative empirical studies to identify methods that can be useful for predicting demand in various situations and to warn against methods that should not be used. In general, use structured methods and avoid intuition, unstructured meetings, focus groups, and data mining. In situations where there are sufficient data, use quantitative methods including extrapolation, quantitative analogies, rule-based forecasting, and causal methods. Otherwise, use methods that structure judgement including surveys of intentions and expectations, judgmental bootstrapping, structured analogies, and simulated interaction. Managers’ domain knowledge should be incorporated into statistical forecasts. Methods for combining forecasts, including Delphi and prediction markets, improve accuracy. We provide guidelines for the effective use of forecasts, including such procedures as scenarios. Few organizations use many of the methods described in this paper. Thus, there are opportunities to improve efficiency by adopting these forecasting practices. Marketing practitioners regard forecasting as an important part of their jobs. For example, Dalrymple (1987), in his survey of 134 US companies, found that 99% prepared formal forecasts when they developed written marketing plans. In Dalrymple (1975), 93% of the companies sampled indicated that sales forecasting was ‘one of the most critical’ aspects, or a ‘very important’ aspect of their company’s success. Jobber, Hooley and Sanderson (1985), in a survey of 353 marketing directors from British textile firms, found that sales forecasting was the most common of nine activities on which they reported. We discuss methods to forecast demand. People often use the terms ‘demand’ and ‘sales’ interchangeably. It is reasonable to do so because the two equate when sales are not limited by supply. Sometimes it is appropriate to forecast demand directly. For example, a baker might extrapolate historical data on bread sales to predict demand in the week ahead. When direct prediction is not feasible, or where uncertainty and changes are expected to be substantial, marketing managers may need to forecast the size of a market or product category. Also, they would need to forecast the actions and reactions of key decision makers such as competitors, suppliers, distributors, collaborators, governments, and themselves – especially when strategic issues are involved. These actions can help to forecast market share. The resulting forecasts allow one to calculate a demand forecast. These forecasting needs and their relationships are illustrated in Figure 1.
  • 2. FIGURE 1 Needs for marketing forecasts FORECASTING METHODS In this section we provide brief descriptions of forecasting methods and their application. Detailed descriptions are provided in forecasting textbooks such as Makridakis, Wheelwright, and Hyndman (1998). Forecasting methods and the relationships between them are shown in Figure 2, starting with the primary distinction between methods that rely on judgement and those that require quantitative data. ----------------------------------------------------------------------------------- Put FIGURE 2: Methodology Tree for Forecasting about here --------------------------------------------------------- Methods Based on Judgment Unaided judgment It is common practice to ask experts what will happen. This is a good procedure to use when • experts are unbiased • large changes are unlikely • relationships are well understood by experts (e.g., demand goes up when prices go down) • experts possess privileged information • experts receive accurate and well-summarized feedback about their forecasts. Unfortunately, unaided judgement is often used when the above conditions do not hold. Green and Armstrong (2005a), for example, found that experts were no better than chance when they use their unaided judgement to forecast decisions made by people in conflict situations. If this surprises you, think of the ease with which producers of current affairs programmes seem able to assemble plausible experts who confidently express 2
  • 3. forecasts on how a situation will turn out, or how things would have turned out had they followed another approach. Prediction markets Prediction markets, also known as betting markets, information markets, and futures markets have a long history. Between the end of the US Civil War and World War II, well-organized markets for betting on presidential elections correctly picked the winner in every case but 1916; also, they were highly successful in identifying those elections that would be very close (Rhode and Strumpf, 2004). More recently, in the four elections prior to 2004, the Iowa Electronic Markets (IEM) has performed better than polls in predicting the margin of victory for the presidential election winner. In the week leading up to the election, these markets predicted vote shares for the Democratic and Republican candidates with an average absolute error of around 1.5 percentage points. The final Gallup poll, by comparison, yielded forecasts that erred by 2.1 percentage points (Wolfers and Zitzewitz, 2004). Despite numerous attempts since the 1930s, no methods have been found to be superior to markets when forecasting prices. However, few people seem to believe this as they pay handsomely for advice about what to invest in. Some commercial organisations provide internet markets and software that to allow participants to bet by trading contracts. Markets can be used to market to predict such things as the percentage of US households with an HDTV by the end of a given time period. Confidential betting markets can also be set up within firms to bet on such things as the sales growth of a new product. Some unpublished studies suggest that they can produce accurate sales forecasts when used within companies. However, there are no empirical studies that compare forecasts from prediction markets with those from traditional groups or from other methods. Delphi The Delphi technique was developed at RAND Corporation in the 1950s to help capture the knowledge of diverse experts while avoiding the disadvantages of traditional group meetings. The latter include bullying and time-wasting. To forecast with Delphi the administrator should recruit between five and twenty suitable experts and poll them for their forecasts and reasons. The administrator then provides the experts with anonymous summary statistics on the forecasts, and experts’ reasons for their forecasts. The process is repeated until there is little change in forecasts between rounds – two or three rounds are usually sufficient. The Delphi forecast is the median or mode of the experts’ final forecasts. Software to guide you through the procedure is available at forecastingprinciples.com. Rowe and Wright (2001) provide evidence on the accuracy of Delphi forecasts. The forecasts from Delphi groups are substantially more accurate than forecasts from unaided judgement and traditional groups, and are somewhat more accurate than combined forecasts from unaided judgement. Structured analogies The outcomes of similar situations from the past (analogies) may help a marketer to forecast the outcome of a new (target) situation. For example, the introduction of new products in US markets can provide analogies for the outcomes of the subsequent release of similar products in other countries. People often use analogies to make forecasts, but they do not do so in a structured manner. For example, they might search for an analogy that suits their prior beliefs or they might stop searching when they identify one analogy. The structured-analogies method uses a formal process to overcome biased and inefficient use of information from analogous situations. To use the structured analogies method, an administrator prepares a description of the target situation and selects experts who have knowledge of analogous situations; preferably direct experience. The experts identify and describe analogous situations, rate their similarity to the target situation, and match the outcomes of their 3
  • 4. analogies with potential outcomes in the target situation. The administrator then derives forecasts from the information the experts provided on their most similar analogies. There has been little research on forecasting using analogies, but results are promising. Green and Armstrong (2005b) found that structured analogies were more accurate than unaided judgment in forecasting decisions in eight conflicts. Further information on structured analogies is available at conflictforecasting.com. Game theory Game theory has been touted in textbooks and research papers as a way to obtain better forecasts in situations involving negotiations or other conflicts. A Google search for “game theory” and “forecasting” or “prediction” identified 147,300 sites. Despite a vast research effort, there is no research that directly tests the forecasting ability of game theory. However, Green (2002, 2005) tested the ability of game theorists, who were urged to use game theory in predicting the outcome of eight real (but disguised) situations. In that study, game theorists were no more accurate than university students. Judgmental Decomposition The basic idea behind judgemental decomposition is to divide the forecasting problem into parts that are easier to forecast than the whole. One then forecasts the parts individually, using methods appropriate to each part. Finally, the parts are combined to obtain a forecast. One approach is to break the problem down into multiplicative components. For example, to forecast sales for a brand, one can forecast industry sales volume, market share, and selling price per unit. Then reassemble the problem by multiplying the components together. Empirical results indicate that, in general, forecasts from decomposition are more accurate than those from a global approach (MacGregor 2001). In particular, decomposition is more accurate where there is much uncertainty about the aggregate forecast and where large numbers (over one million) are involved. Judgmental bootstrapping Judgmental bootstrapping converts subjective judgments into structured procedures. Experts are asked what information they use to make predictions about a class of situations. They are then asked to make predictions for diverse cases, which can be real or hypothetical. For example, they might forecast next year’s sales for alternative designs for a new product. The resulting data are then converted to a model by estimating a regression equation relating the judgmental forecasts to the information used by the forecasters. The general proposition seems preposterous. It is that the model of the man will be more accurate than the man. The reason is that the model applies the man’s rules more consistently. Judgemental bootstrapping models are most useful for repetitive complex forecasting problems where data on the dependent variable are not available (e.g. demand for a new telecommunications device) or data does not vary sufficiently for the estimation of an econometric model. Once developed, judgmental bootstrapping models provide a low-cost procedure for making forecasts. The review in Armstrong (2001a) found that judgmental bootstrapping was more accurate than unaided judgment (the normal method for these situations) in 8 of the 11 comparisons, with two tests showing no difference, and one showing a small loss. The typical error reduction was about 6%. Judgmental bootstrapping also allows experts to see how they are weighting various factors. This knowledge can help to improve judgmental forecasting. For example, with respect to personnel selection, bootstrapping might reveal that some factors, such as height, weight or looks, are used, even though they are not relevant for the job. Bootstrapping also allows for estimating effects of changing key variables when historical data are not sufficient to allow for estimates. 4
  • 5. Expert systems As the name implies, expert systems are structured representations of the rules experts use to make predictions or diagnoses. For example, ‘if local household incomes are in the bottom quartile, then do not supply premium brands’. The forecast is implicit in the foregoing conditional action statement: i.e., premium brands are unlikely to make an acceptable return in the locale. Rules are often created from protocols, whereby forecasters talk about what they are doing while making forecasts. Where empirical estimates of relationships from structured analysis such as econometric studies are available, expert systems should use that information. Expert opinion, conjoint analysis, and bootstrapping can also aid in the development of expert systems. Expert systems forecasting involves identifying forecasting rules used by experts and rules learned from empirical research. One should aim for simplicity and completeness in the resulting system, and the system should explain forecasts to users. Developing an expert system is expensive and so the method will only be of interest in situations where many forecasts of a similar kind are required. Expert systems are feasible where problems are sufficiently well- structured for rules to be identified. Collopy, Adya, and Armstrong (2001), in their review, found that expert systems forecasts are more accurate than those from unaided judgement. This conclusion, however, was based on only a small number of studies. Simulated interaction Simulated interaction is a form of role playing for predicting decisions by people who are interacting with others. It is especially useful when the situation involves conflict. For example, one might wish to forecast how best to secure an exclusive distribution arrangement with a major supplier. To use simulated interaction, an administrator prepares a description of the target situation, describes the main protagonists’ roles, and provides a list of possible decisions. Role players adopt a role and read about the situation. They then improvise realistic interactions with the other role players until they reach a decision; for example to sign a trial one-year exclusive distribution agreement. The role players’ decisions are used to make the forecast. Using eight conflict situations, Green (2005) found that forecasts from simulated interactions were substantially more accurate than can be obtained from unaided judgement. Simulated interaction can also help to maintain secrecy. Information on simulated interaction is available from conflictforecasting.com. Intentions and expectations surveys With intentions surveys, people are asked how they intend to behave in specified situations. In a similar manner, an expectations survey asks people how they expect to behave. Expectations differ from intentions because people realize that unintended things happen. For example, if you were asked whether you intended to visit the dentist in the next six months you might say no. However, you realize that a problem might arise that would necessitate such a visit, so your expectations would be that the event had a probability greater than zero. This distinction was proposed and tested by Juster (1966) and its evidence on its importance was summarised by Morwitz (2001). Expectations and intentions can be obtained using probability scales such as Juster’s eleven-point scale. The scale should have descriptions such as 0 = ‘No chance, or almost no chance (1 in 100)’ to 10 = ‘Certain, or practically certain (99 in 100)’. To forecast demand using a survey of potential consumers, the administrator should prepare an accurate and comprehensive description of the product and conditions of sale. He should select a representative sample of the population of interest and develop questions to elicit expectations from respondents. Bias in responses should be assessed if possible and the data adjusted accordingly. The behaviour of the population is forecast by aggregating the survey responses. 5
  • 6. Useful methods have been developed for selecting samples, obtaining high response rates, compensating for non-response bias, and reducing response error. Dillman (2000) provides advice for designing surveys. Response error (where respondent information is not accurately reported) is probably the largest component of total error for marketing problems. Expectations are most likely to be useful in cases where survey respondents have previously indulged in the behaviour of interest, for example visited a theme park. Other conditions favouring the use of expectations surveys are: (1) responses can be obtained; (2) the behaviour is important to the respondent; (3) the behaviour is planned; (4) the plan is reported correctly; (5) the respondent is able to fulfil the plan; (6) the plan is unlikely to change (Morwitz 2001). Intentions and expectations surveys are especially useful when demand data are not available, such as for new product forecasts. One popular type of survey, focus groups, violates five important principles and they should not, therefore, be used in forecasting. First, focus groups are seldom representative of the population of interest. Second, the responses of each participant are influenced by the expressed opinions of others in the group. Third, a focus group is a small sample – samples for intentions or expectations surveys typically include several hundred people whereas a focus group will consist of between six and ten individuals. Fourth, questions for the participants are generally not well structured. And fifth, summaries of focus groups responses are often subject to bias. There is no evidence to show that focus groups provide useful forecasts. Conjoint analysis By surveying consumers about their preferences for alternative product designs in a structured way, it is possible to infer how different features will influence demand. Potential customers might be presented with a series of perhaps 20 pairs of offerings. For example, various features of a personal digital assistant such as price, weight, battery life, screen clarity and memory could be varied substantially such that the features do not correlate with one another. The potential customer is thus forced to make trade-offs among various features by choosing one of each pair of offerings in a way that is representative of how they would choose in the marketplace. The resulting data can be analysed by regressing respondents’ choices against the product features. The method, which is similar to bootstrapping, is called ‘conjoint analysis’ because respondents consider the product features jointly. In general, the accuracy of forecasts from conjoint analysis is likely to increase with increasing realism of the choices presented to respondents (Wittink and Bergesteun 2001). The method is based on sound principles, such as using experimental design and soliciting independent intentions from a sample of potential customers. Unfortunately however, there do not appear to be studies that compare conjoint-analysis forecasts with forecasts from other reasonable methods. Methods requiring quantitative data Extrapolation Extrapolation methods use historical data on that which one wishes to forecast. Exponential smoothing is the most popular and cost effective of the statistical extrapolation methods. It implements the principle that recent data should be weighted more heavily and ‘smoothes’ out cyclical fluctuations to forecast the trend. To use exponential smoothing to extrapolate, the administrator should first clean and deseasonalise the data, and select reasonable smoothing factors. The administrator then calculates an average and trend from the data and uses these to derive a forecast (Makridakis, Wheelwright & Hyndman 1998). Statistical extrapolations are cost effective when forecasts are needed for each of hundreds of inventory items. They are also useful where forecasters are biased or ignorant of the situation (Armstrong 2001b). Allow for seasonality when using quarterly, monthly, or daily data. Most firms do this (Dalrymple 1987). Seasonality adjustments led to substantial gains in accuracy in the large-scale study of time series by Makridakis et al. (1984). They should be dampened because seasonal adjustment programs tend to over-adjust for seasonality (Miller and Williams 2004); this follows the principle of being conservative in the face of 6
  • 7. uncertainty. Software for calculating damped seasonal adjustment factors is available at forecastingprinciples.com. Retail scanner technology provides reliable and up-to-date data for extrapolating sales of existing products. As a result, forecast accuracy should improve, especially because error in assessing the current situation is reduced. Not knowing where you are starting from is often a major source of error in predicting future values. Quantitative analogies Experts can identify situations that are analogous to a given situation. These can be used to extrapolate the outcome of a target situation. For example, to assess the loss in sales when the patent protection for a drug is removed, one might examine the historical pattern of sales for analogous drugs. To forecast using quantitative analogies, ask experts to identify situations that are analogous to the target situation and for which data are available. If the analogous data provides information about the future of the target situation, such as per capita ticket sales for a play that is touring from city to city, forecast by calculating averages. If not, construct one model using target situation data and another using analogous data. Combine the parameters of the models, and forecast with the combined model. While Duncan et al. (2001) provide evidence that accuracy can be improved by using data from analogous time series we found no other evidence on the relative accuracy of quantitative analogies forecasts. Rule-based forecasting Rule-based forecasting (RBF) is a type of expert system that allows one to integrate managers’ knowledge about the domain with time-series data in a structured and inexpensive way. For example, in many cases a useful guideline is that trends should be extrapolated only when they agree with managers’ prior expectations. When the causal forces are contrary to the trend in the historical series, forecast errors tend to be large (Armstrong and Collopy 1993). Although such problems occur only in a small percentage of cases, their effects are serious. To apply RBF, one must first identify features of the series using statistical analysis, inspection, and domain knowledge (including causal forces). The rules are then used to adjust data, and to estimate short- and long- range models. RBF forecasts are a blend of the short- and long-range model forecasts. RBF is most useful when substantive domain knowledge is available, patterns are discernable in the series, trends are strong, and forecasts are needed for long horizons. Under such conditions, errors for rule-based forecasts are substantially less than those for combined forecasts (Armstrong, Adya, and Collopy 2001). In cases where the conditions were not met, forecast accuracy is not harmed. Information on rule-based forecasting is available from the special-interest-group pages at forecastingprinciples.com. Neural nets Neural networks are computer intensive methods that use decision processes analogous to those of the human brain. Like the brain, they have the capability of learning as patterns change and updating their parameter estimates. However, much data is needed in order to estimate neural network models and to reduce the risk of over-fitting the data (Adya and Collopy 1998). There is some evidence that neural network models can produce forecasts that are more accurate than those from other methods (Adya and Collopy 1998). While this is encouraging, our current advice is to avoid neural networks because the method ignores prior knowledge and because the results are difficult to understand. Information on neural networks is available from the special interest group pages on the forecastingprinciples.com site. Reviews of commercial software are available from the same site. 7
  • 8. Data mining Data mining uses sophisticated statistical analyses to identify relationships. It is a popular approach. For example, an August 2005 Google search using the term “data mining” found over seven million sites. When we included either “prediction” or “forecasting” in the search, Google found over 560,000 sites. Data mining ignores theory and prior knowledge in a search for patterns. Despite ambitious claims and much research effort, we are not aware of evidence that data mining techniques provide benefits for forecasting. In their extensive search and reanalysis of data from published research, Keogh and Kasetty (2002) found little evidence for that data mining is useful. A large part of this, they said, was due to the fact that few studies have used a proper design to assess data mining. To find out more about data mining, see the-data-mine.com. Causal models Causal models are based on prior knowledge and theory. Time-series regression and cross-sectional regression are commonly used for estimating model parameters or coefficients. These models allow one to examine the effects of marketing activity, such as a change in price, as well as key aspects of the market, thus providing information for contingency planning. To develop causal models, one needs to select causal variables by using theory and prior knowledge. The key is to identify important variables, the direction of their effects, and any constraints. One should aim for a relatively simple model and use all available data to estimate it (Allen and Fildes 2001). Surprisingly, sophisticated statistical procedures have not led to more accurate forecasts. In fact, crude estimates are often sufficient to provide accurate forecasts when using cross-sectional data (Dawes and Corrigan 1974; Dana and Dawes 2005). Statisticians have developed sophisticated procedures for analyzing how well models fit historical data. Such procedures have, however, been on little value to forecasters. Measures of fit (such as R2 or the standard error of the estimate of the model) have little relationship with forecast accuracy and they should therefore be avoided. Instead, holdout data should be used to assess the predictive validity of a model. This conclusion is based on findings from many studies with time-series data (Armstrong, 2001c). Statistical fit does relate to forecast accuracy for cross-sectional data, although the relationship is tenuous. Causal models are most useful when (1) strong causal relationships are expected, (2) the direction of the relationship is known, (3) causal relationships are known or they can be estimated, (4) large changes are expected to occur in the causal variables over the forecast horizon, and (5) changes in the causal variables can be accurately forecast or controlled, especially with respect to their direction. Reviews of commercial software that can be used to develop causal models are provided at the forecastingprinciples.com site. Segmentation Segmentation involves breaking a problem down into independent parts, using data for each part to make a forecast, and then combining the parts. For example, a company could forecast sales of wool carpet separately for each climatic region, and then add the forecasts. To forecast using segmentation, one must first identify important causal variables that can be used to define the segments, and their priorities. For example, age and proximity to a beach are both likely to influence demand for surfboards, but the latter variable should have the higher priority; therefore, segment by proximity, then age. For each variable, cut-points are determined such that the stronger the relationship with dependent variable, the greater the non-linearity in the relationship, and the more data that are available the more cut-points should be used. Forecasts are made for the population of each segment and the behaviour of the population within the segment using the best method or methods given the information available. Population and behaviour forecasts are combined for each segment and the segment forecasts summed. Where there is interaction between variables, the effect of variables on demand are non-linear, and the effects of some variables can dominate others, segmentation has advantages over regression analysis (Armstrong 1985). Segmentation is most useful when there are benefits from compensating errors. This is likely to occur where the segments are independent and are of roughly equal importance, and when information on each segment is good. 8
  • 9. Segmentation based on a priori selection of variables offers the possibility of improved accuracy at a low risk. Dangerfield and Morris (1992), for example, found that bottom-up forecasting, a simple application of segmentation, was more accurate than top-down forecasts for 74% of the 192 monthly time series tested. In some situations changes in segments are dependent on changes in other segments. For example, liberalisation of gambling laws in city-A might result in decreased gambling revenue in already liberal cities B, C, and D. Efforts at dependent segmentation have gone under the names of microsimulation, world dynamics, and system dynamics. While the simulation approach seems reasonable, the models are complex and hence there are many opportunities for judgemental errors and biases. Armstrong (1985) found no evidence that these simulation approaches provide valid forecasts and we have found no reason to change this assessment. SELECTING METHODS To use a new forecasting method, one must at least know about it. The traditional methods of gaining knowledge, such as attending courses, reading textbooks, and using consultants, are being augmented by the Internet. The latest methods can be fully disclosed on web sites and they can be incorporated into software packages. For example, the complete set of rules for rule-based forecasting is available on the forecastingprinciples.com website. Choosing a method based on evidence Choosing the best forecasting method for any particular situation is not a simple task, and sometimes more than one method may be appropriate. We used empirical findings and expert opinions to develop the flowchart for selecting methods shown in Figure 3. ---------------------------------------------------------------- INSERT FIGURE 3: Selection Tree about here ----------------------------------------------------------------- The first issue the analyst needs to address is whether the data are sufficient to permit quantitative analysis. If not, judgmental procedures are called for. Some cases call for both approaches. For judgmental procedures, the first issue is whether the situation involves small or large changes. For small changes, where no policy analysis is needed and where one gets good feedback – such as with the number of diners that will come to a restaurant at a given time – unaided judgement can work well. But if the feedback is poor, it helps to use many experts as with Delphi or prediction markets. Where the analyst wishes to predict the effects of different policies, he must determine whether predictions from experts or from participants such as potential customers would be most appropriate. If it is inappropriate to ask potential customers for predictions, judgemental bootstrapping or decomposition will help to use experts’ knowledge effectively. Where the conditions are met for conjoint analysis, it may be possible to obtain useful forecasts from surveys of potential customers. For cases where large changes are expected but policy analysis is not required, one should consider expectations or intentions surveys. Where large changes are expected and only a few decision makers are involved, competitors or suppliers for example, simulated interaction is the best method. If experts are able think of several analogous situations, structured analogies is also likely to provide useful forecasts. If one has a lot of time-series data, the analyst should determine whether there is knowledge about what empirical relationships might exist, and their magnitudes. For example, in most situations there is excellent prior knowledge about price elasticities (Tellis 1988). If empirical knowledge of relationships is available, use causal models. In addition, one should consider using domain knowledge, such as a manager's knowledge about the situation. Extrapolation or neural networks may be useful in situations where large changes are unlikely. For time-series situations where one lacks causal knowledge, extrapolation is appropriate. If there is no prior knowledge about relationships, but domain knowledge exists (such as if a manager knows that sales will increase due to advertising of a price reduction), use rule-based forecasting. 9
  • 10. In situations where one lacks time-series data and knowledge about relationships, quantitative analogies are appropriate. In the presence of domain knowledge or where policy analysis is needed, expert systems can be used. The conditions may not always be clear. In such cases, one should use two or more relevant methods, and then combine the forecasts. Combining forecasts Combined forecasts improve accuracy and reduce the likelihood of large errors. In a meta-analysis, Armstrong found an average error reduction of about 12% across 30 comparisons. They are especially useful when the component methods differ substantially from one another. For example, Blattberg and Hoch (1990) obtained improved sales forecast by averaging managers’ judgmental forecasts and forecasts from a quantitative model. Considerable research suggests that, lacking well-structured domain knowledge, unweighted averages are typically as accurate as other weighting schemes (Armstrong, 2001d). Judgmental and statistical methods should be integrated. Armstrong and Collopy (1998) summarize research in this area. Integration is effective when judgments are collected in a systematic manner and then used as inputs to the quantitative models, rather than simply used as adjustments to the outputs. Unfortunately, the latter procedure is commonly used. In the light of the above guidelines, we now examine the needs for the types of marketing forecasts that we identified in Figure 1. FORECASTING MARKET SIZE Market size is influenced by environmental factors such as economic conditions. For example, the demand for alcoholic beverages will be influenced by such things as the size and age distribution of the population, distribution of disposable income, publication of health research findings, laws, culture, and religious beliefs. To forecast market size, one can use Delphi, intentions or expectations, extrapolation, causal methods, and segmentation. Methods that rely on judgment Market forecasts are often based on judgement, particularly for relatively new or rapidly changing markets. Given the risk of bias from unaided judgement, we recommend using structured methods. For example, the Delphi technique could be used to answer questions about market size such as: ‘By what percentage will the wine market grow over the next 10 years?’ or ‘What proportion of households will subscribe to movies on demand over telephone or cable lines?’ Methods requiring quantitative data When considering forecasts of market size, one can use either time-series extrapolation methods or causal methods. Time-series extrapolation is inexpensive. Causal methods such as econometrics, while more expensive, are expected to be the most accurate method when large changes are expected. Organizations should use systematic procedures for scanning the environment to be sure that they do not overlook variables that may have a large impact on their market. Periodic brainstorming with a diverse group of experts should be sufficient to identify which variables to track. 10
  • 11. FORECASTING DECISION MAKERS’ ACTIONS The development of a successful marketing strategy sometimes depends upon having good forecasts of the actions and reactions of competitors who might have an influence on market share. For example, if you lower your price, will competitors follow? A variety of judgmental methods can be used to forecast competitive actions. These include: • expert opinion (ask experts who know about this and similar markets); • intentions (ask the competitors how they would respond in a variety of situations); • structured analogies; • simulated interaction (formal acting out of the interactions among decision makers for the firm and its competitors); and • experimentation (trying the strategy on a small scale and monitoring the results). It may also be important to forecast the actions of suppliers, distributors, collaborators, governments, and people within one’s firm in order to develop a successful marketing strategy. Sometimes one may need to forecast the actions of other interest groups, such as ‘concerned minorities.’ For example, how would an environmental group react to the introduction of plastic packaging by a large fast food restaurant chain? Techniques similar to those for forecasting competitors’ actions are likely to be useful. Company plans typically require the cooperation of many people. An organization may decide to implement a given marketing strategy, but will it be able to carry out the plan? Sometimes an organization fails to implement a plan because of a lack of resources, misunderstanding, opposition by key stakeholders, or a lack of commitment by key people. The need to forecast organizational behaviour is sometimes overlooked and can be important. Better forecasting here might lead to more realistic plans and to plans that are easier to implement. Surveys of key decision makers in an organization may help to assess whether a given strategy can be implemented successfully. Simulated interactions can provide useful forecasts in such situations. It is also important to predict the effects of the various actions. One can make such forecasts by using expert judgment, judgmental bootstrapping, or econometric methods. FORECASTING MARKET SHARE If one expects the same causal forces and the same types of actions to persist into the future, a simple extrapolation of market share, such as from a naive no-change model, is usually sufficient. When large changes are expected, one should draw upon methods that incorporate causal reasoning. If the anticipated changes are unusual, judgmental methods such as Delphi would be appropriate. If the changes are expected to be large, the causes are well-understood, and if one lacks historical data, then judgmental bootstrapping can be used to improve forecasting. The conditions for using econometric models for forecasting market share are described by Brodie et al. (2001). Econometric methods should be used when (1) the effects of current marketing activity are strong relative to the residual effects of previous activity; (2) there are enough data and there is sufficient variability in the data; (3) models can allow for different responses by different brands; (4) models can be estimated at store level; (5) competitors actions can be forecast. Methods for predicting competitors’ actions are identified in the previous section. There are many ways to formulate market share models and much prior research exists to help specify them. For example, a meta-analysis by Tellis (1988) of price elasticities of demand for 367 branded products, estimated using econometric models, reported a mean value of -2.5. Hamilton et al.’s (1997) analysis of 406 brand price elasticities also reported a value of -2.5. Estimates can also be made about other measures of market activity, such as advertising elasticity. 11
  • 12. FORECASTING DEMAND DIRECTLY By direct forecasts, we mean those that focus only on the last box in our Figure 1. We first describe methods that rely on judgment. The most important application here is to new products. Following that we describe methods that can be used when quantitative data are available. Methods that rely on judgment The choice of a forecasting method to estimate customer demand for a product depends on what stage it has reached in its life cycle. As a product moves from the concept phase to prototype, test market, introduction, growth, maturation, and declining stages, the relative value of the alternative forecasting methods changes. In general, the movement is from purely judgmental approaches to quantitative models. Surveys of consumers’ intentions and expectations are often used for new product forecasts. Intentions to purchase new products are complicated because potential customers may not be sufficiently familiar with the proposed product and because the various features of the product affect one another (e.g., price, quality and distribution channel). This suggests the need to prepare a good description of the proposed product. A product description may involve prototypes, visual aids, product clinics or laboratory tests. They can also improve forecasts even when you already have other data (Armstrong, Morwitz, & Kumar 2000). Expert opinions are widely used in the concept phase. For example, it is common to obtain forecasts from the sales force. It is important to properly pose the questions, adjust for biases in experts’ forecasts, and aggregate their responses. The Delphi method provides a useful way to conduct such surveys. Errors in the description can be critical. For example, one of us was asked to forecast demand for the product of a new electricity retailer. As the retailer described the proposed product, an important feature was the ease with which customers would be able to swap their account to the new supplier. All they would have to do was to call the toll-free number and tell the friendly operator their telephone number. Despite our concern that this level of ease might not be achievable we proceeded to forecast demand using the electricity company’s description. In the event, the existing supplier refused to transfer accounts without onerous proof, and demand was lower than predicted. This suggests the need to prepare alternative descriptions so as to forecast for possible changes. Intentions surveys are most likely to be useful for short-term forecasts and business-to-business sales. As an alternative to asking potential customers about their intentions to purchase, one can ask experts to predict how consumers will respond. For example, Wotruba and Thurlow (1976) discuss how opinions from members of the sales force can be used to forecast demand. One could also ask distributors or marketing executives to make forecasts. Experts may be able to make better forecasts if the problem is decomposed in such a way that the parts to be forecast are better known to them than the whole. Thus, if the task was to forecast the sales of high- definition television sets rather than making a direct forecast, one could break the problem into parts such as ‘How many households will there be in the U.S. in the forecast year?’ ‘Of these households, what percentage will make more than $30,000 per year?’ ‘Of these households, how many have not purchased a large screen TV in the past year?’ and so on. The forecasts are obtained by multiplying the components. Unfortunately, experts are often subject to biases when they make forecasts for new products (Tyebjee 1987). Sales people may try to forecast on the low side if their forecasts will be used to set quotas. Marketing executives may forecast high, believing that this will gain approval for the project or motivate the sales force. If possible, you should avoid experts who would have obvious reasons to be biased. Another strategy is to use a heterogeneous group of experts in the hope that their differing biases tend to cancel one another. Conjoint analysis is widely used by firms (Wittink and Bergestuen, 2001). It was used successfully in the design of a new Marriott hotel chain (Wind et al., 1989). The use of the method to forecast new product demand can be expensive because it requires large samples of potential customers, the potential customers may be difficult to locate, and the questionnaires are not easy for respondents to complete. Respondents must also understand the concepts that they are being asked to evaluate. Expert judgments can be used in a manner analogous to conjoint analysis. That is, experts would make predictions about situations involving alternative product designs and alternative marketing plans. These predictions would then be related to the situations by regression analysis. It has advantages as compared to conjoint analysis in that few experts are needed (probably between five and twenty). In addition, expert judgments can incorporate policy variables, such as advertising, that are difficult for consumers to assess. 12
  • 13. Analogous products can be used to forecast demand for new products. One collects a set of analogous products and examines their growth patterns (Claycamp and Liddy, 1969). The typical pattern can then be used as a forecast. Large errors are typical for new product forecasts. Tull (1967) estimated the mean absolute percentage error for new product sales to be about 65 percent. It is not surprising then, that pre-test models have gained wide acceptance among business firms. Shocker and Hall (1986) provided an evaluation of some of these models Because of the lack of systematic and unbiased forecast validation studies they could draw no conclusions about which methods were most accurate. Methods requiring quantitative data Once a new product is on the market, it is possible to use extrapolation methods. For early sales, much attention has been given to the selection of the proper functional form. The diffusion literature uses an S- shaped curve to predict new product sales. That is, growth builds up slowly at first, becomes rapid if word of mouth is good and if people see the product being used by others. Then it slows as it approaches a saturation level. A substantial literature exists on diffusion models. Despite this, the number of comparative validation studies is small and the benefits of choosing the best functional form are modest (Meade and Islam, 2001). When many demand forecasts are needed, extrapolation is often preferred. Relatively simple methods suffice. Sophistication beyond a modest level does not improve accuracy, but it does increase costs and reduce understanding. Decomposition is appropriate when component series can be forecast more accurately than the aggregate. UNCERTAINTY In addition to improving accuracy, forecasting is concerned with assessing uncertainty. This can help manage the risk associated with alternative plans. Traditional error measures, such as the mean square error (MSE), do not provide a reliable basis for comparison of forecasting methods (Armstrong and Collopy, 1992). The median absolute percentage error (MdAPE) is more appropriate because it is invariant to scale and is not influenced by outliers. When comparing methods, especially when testing on a small number of series, control for degree of difficulty in forecasting by using the median relative absolute error (MdRAE), which compares the error for a given model against errors for the naive, no change forecast (Armstrong and Collopy, 1992). Statisticians have relied heavily on tests of statistical significance for assessing uncertainty. However, statistical significance is inappropriate for assessing uncertainty in forecasting. Furthermore, its use has been attacked as being misleading (e.g., see Cohen, 1994). It is difficult to find studies in marketing forecasting where statistical significance has made an important contribution. Instead of statistical significance, the focus should be on prediction intervals. Chatfield (2001) summarizes research on prediction intervals. Unfortunately, prediction intervals are not widely used in practice. Tull’s (1967) survey noted that only 25% of 16 respondent companies said they provided confidence intervals with their forecasts. Dalrymple (1987) found that 48% did not use confidence intervals, and only 10% ‘usually’ used them. The fit of a model to historical data is a poor way to estimate prediction intervals. It typically results in confidence intervals that are too narrow. It is best to simulate the actual forecasting procedure as closely as possible, and use the distribution of the resulting ex ante forecasts to assess uncertainty. For example, if you need to make forecasts for two years ahead, withhold enough data to be able to have a number of two-year- ahead ex ante forecasts. 13
  • 14. Uncertainty in judgmental forecasts Experts are typically overconfident (Arkes, 2001). In McNee’s (1992) examination of economic forecasts from 22 economists over 11 years, the actual values fell outside the range of their prediction intervals about 43% of the time. This occurs even when subjects are warned in advance against overconfidence. Fortunately, there are procedures to improve the calibration of judges. Where possible, judges should be provided with timely and unambiguous information on outcomes along with reasons why they were right or wrong. When feedback is good, judges’ confidence intervals are well-calibrated. For example, 60% of the times weather forecasters say that there is a 60% chance of rain, it rains. This suggests that marketing forecasters would do well to seek the standard of feedback received by weather forecasters. In cases where good feedback is not possible, ask experts to write all the reasons why their forecasts might be wrong (Arkes, 2001). Alternatively, use the devil’s advocate procedure, where someone is assigned for a short time to raise arguments about why the forecast might be wrong. But, be warned, being a devil’s advocate can be make you unpopular with your group. Still another way to assess uncertainty is to examine the agreement among judgmental forecasts. For example, Ashton (1985), in a study of forecasts of annual advertising sales for Time magazine, found that the agreement among the individual judgmental forecasts was a good proxy for uncertainty. Uncertainty in quantitative forecasts Prediction intervals from quantitative forecasts tend to be too narrow even when based on ex ante n-ahead forecasts. Some empirical studies have shown that the percentage of actual values that fall outside the 95% prediction intervals is substantially greater than 5%, and sometimes greater than 50% (Makridakis et al., 1987). One reason this occurs is because the estimates ignore various sources of uncertainty. For example, discontinuities might occur over the forecast horizon. In addition, forecast errors in time series are often asymmetric, so this makes it difficult to estimate prediction intervals. Asymmetry of errors is likely to occur when the forecasting model uses an additive trend. The most sensible procedure is to transform the forecast and actual values to logs, then calculate the prediction intervals using logged differences. Interestingly, researchers and practitioners seldom follow this advice (except where the original forecasting model has been formulated in logs). Evidence on the issue of asymmetrical errors is provided in Armstrong and Collopy (2001). Loss functions can also be asymmetric. For example, the cost of a forecast that is too low by 50 units may differ from the cost if it is too high by 50 units. But this is a problem for the planner, not the forecaster. GAINING ACCEPTANCE OF FORECASTS Forecasts that contradict management’s expectations have much potential value. However, they may be ignored (Griffith and Wellman, 1979). One way to avoid this problem is to gain agreement on what forecasting procedures to use prior to presenting the forecasts. This may involve making adjustments to the forecasting method in order to develop forecasts that will be used. Another way to gain acceptance of forecasts is to ask decision makers to decide in advance what decisions they will make given different possible forecasts. Are the decisions affected by the forecasts? Prior agreements on process and on decisions can greatly enhance the value of forecasts, but they are difficult to achieve in many organizations. The use of scenarios can aid this process. Scenarios involve providing information about a future situation to a decision maker and asking him to project himself into the situation and write the stories about what he did. They should be written in the past tense. Detailed instructions for writing scenarios are summarized in Gregory and Duran (2001). Scenarios are effective in getting managers to accept the possibility that certain events might occur. They should not be used to make forecasts, however, because they distort one’s assessment of the likelihood that the events will occur. 14
  • 15. CONCLUSIONS Significant gains have been made in forecasting for marketing, especially since 1960. Advances have occurred in the development of methods based on judgment, such as Delphi, simulated interactions, intentions studies, opinions surveys, bootstrapping, and combining. They have also occurred for methods based on statistical data, such as extrapolation, rule-based forecasting, and econometric methods. Most recently, gains have come from the integration of statistical and judgmental forecasts. General principles • Managers’ domain knowledge should be incorporated into forecasting methods. • When making forecasts in highly uncertain situations, be conservative. For example, the trend should be dampened over the forecast horizon. • Complex methods have not proven to be more accurate than relatively simple methods. Given their added cost and the reduced understanding among users, highly complex procedures cannot be justified. • When possible, forecasting methods should use data on actual behaviour, rather than judgments or intentions, to predict behaviour. • Methods that integrate judgmental and statistical data and procedures (e.g., rule-based forecasting) can improve forecast accuracy in many situations. • Overconfidence occurs with quantitative and judgmental methods. • When making forecasts in situations with high uncertainty, use more than one method and combine the forecasts, generally using simple averages. Methods based on judgment • When using judgment, rely on structured procedures such as Delphi, simulated interaction, structured analogies, and conjoint analysis. • Simulated interaction is useful to predict the decisions in conflict situations, such as in negotiations. • In addition to seeking good feedback, forecasters should explicitly list all the things that might be wrong about their forecast. This will produce better calibrated prediction intervals. Methods based on statistical data • With the proliferation of data, causal models play an increasingly important role in forecasting market size, market share, and sales. • Methods should be developed primarily on the basis of theory, not data. Finally, efforts should be made to ensure forecasts are free of political considerations in a firm. To help with this, emphasis should be on gaining agreement about the forecasting methods. Also, for important forecasts, decisions on their use should be made before the forecasts are provided. Scenarios are helpful in guiding this process. REFERENCES Adya, M. and Collopy, F. (1998), “How effective are neural nets at forecasting and prediction? A review and evaluation,” Journal of Forecasting, 17, 451-461. Allen, P. G. and Fildes, R. (2001), “Econometric forecasting,” in J. S. Armstrong (Ed.) Principles of Forecasting. Norwell, MA: Kluwer Academic Publishers, pp. 303-362.. Arkes, M. R. (2001), “Overconfidence in judgmental forecasting,” in J. S. Armstrong (Ed.) Principles of Forecasting. Norwell, MA: Kluwer Academic Publishers, pp. 495-515. Armstrong, J. S. (Ed.) (2001), Principles of Forecasting. Norwell, MA: Kluwer Academic Publishers. Armstrong, J. S. (1985), Long-term Forecasting: From Crystal Ball to Computer (2nd ed.). New York: John Wiley. Armstrong, J. S. (2001a), “Judgmental bootstrapping: Inferring experts' rules for forecasting,” in J. S. Armstrong (Ed.) Principles of Forecasting. Norwell, MA: Kluwer Academic Publishers, pp. 171-192. 15
  • 16. Armstrong, J. S. (2001b), “Extrapolation of time-series and cross-sectional data,” in J. S. Armstrong (Ed.) Principles of Forecasting. Norwell, MA: Kluwer Academic Publishers, pp. 217-243. Armstrong, J. S. (2001c), “Evaluating forecasting methods,” in J. S. Armstrong (Ed.) Principles of Forecasting. Norwell, MA: Kluwer Academic Publishers, pp. 365-382. Armstrong, J. S. (2001d), “Combining forecasts,” in J. S. Armstrong (Ed.) Principles of Forecastings. Norwell, MA: Kluwer Academic Publishers, pp. 417-439. Armstrong, J. S., Adya, M. and Collopy, F. (2001), “Rule-based forecasting: Using judgment in time-series extrapolation,” in J. S. Armstrong (Ed.) Principles of Forecasting. Norwell, MA: Kluwer Academic Publishers, pp. 259-282. Armstrong, J. S. and Collopy, F. (2001), “Identification of asymmetric prediction intervals through causal forces,” Journal of Forecasting, 20, 273-283. Armstrong, J. S. and Collopy, F. (1998), “Integration of statistical methods and judgment for time series forecasting: Principles from empirical research, “in G. Wright and P. Goodwin (Eds.), Forecasting with Judgment. Chichester: John Wiley. Armstrong, J. S. and Collopy, F. (1993), “Causal forces: Structuring knowledge for time series extrapolation,” Journal of Forecasting, 12, 103-115. Armstrong, J. S. and Collopy, F. (1992), “Error measures for generalizing about forecasting methods: empirical comparisons,” International Journal of Forecasting, 8, 69-80. Armstrong, J. S., Morwitz V. and Kumar. V. (2000), “Sales forecasts for existing consumer products and services: Do purchase intentions contribute to accuracy?” International Journal of Forecasting, 16, 383- 397. Ashton, A. H. (1985), “Does consensus imply accuracy in accounting studies of decision making?” Accounting Review, 60, 173-185. Blattberg, R. C. and Hoch, S. J. (1990), “Database models and managerial intuition: 50 percent model + 50 percent manager,” Management Science, 36, 887-899. Brodie, R. J., Danaher, P., Kumar, V. and Leeflang, R. (2001), “Econometric models for forecasting market share,” in J. S. Armstrong (Ed.) Principles of Forecasting. Norwell, MA: Kluwer Academic Publishers, pp. 597-611. Chatfield, C. (2001), “Prediction intervals for time series,” in J. S. Armstrong (Ed.) Principles of Forecasting:. Norwell, MA: Kluwer Academic Publishers, pp. 475-494. Claycamp, H. J. and Liddy, L. E. (1969), “Prediction of new product performance: An analytical approach,” Journal of Marketing Research, 6, 414-420. Cohen, J. (1994), “The earth is round (p < .05),” American Psychologist, 49, 997-1003. Collopy, F, Adya, M. and Armstrong, J. S. (2001), “Expert systems for forecasting,” in J. S. Armstrong (Ed.) Principles of Forecastin. Norwell, MA: Kluwer Academic Publishers, pp. 285-300 Dalrymple, D. J. (1975), “Sales forecasting: Methods and accuracy,” Business Horizons, 18, 69-73. Dalrymple, D. J. (1987), “Sales forecasting practices: Results from a U.S. survey,” International Journal of Forecasting, 3, 379-391. Dana, Jason & Robyn M. Dawes (2004), “The superiority of simple alternatives to regression for social science predictions,” Journal of Educational and Behavioral Statistics, 29 (3), 317-331. Dangerfield, B. J. and Morris, J. S. (1992), “Top-down or bottom-up: Aggregate versus disaggregate extrapolations,” International Journal of Forecasting, 8, 233-241. Dawes, Robyn M. & B. Corrigan (1974), “Linear models in decision making,” Psychological Bulletin, 81, 95- 106. Dillman, D. A. (2000), Mail and Internet Surveys: The Tailored Design Method, (2nd ed.). New York: John Wiley. Duncan, G., Gorr, W. and Szczypula, J. (2001),, “Forecasting analogous time series,” in J. S. Armstrong (Ed.) Principles of Forecasting. Norwell, MA: Kluwer Academic Publishers, pp. 195-213. Gregory, L. and Duran, A. (2001), “Scenarios and acceptance of forecasts,” in J. S. Armstrong (Ed.) Principles of Forecasting. Norwell, MA: Kluwer Academic Publishers, pp. 519-541. Green, K. C. (2005), Game theory, simulated interaction, and unaided judgment for forecasting decisions in conflicts: Further evidence. International Journal of Forecasting, 21, 463-472. Green, K. C. (2002), Forecasting decisions in conflict situations: A comparison of game theory, role-playing, and unaided judgement. International Journal of Forecasting, 18, 321-344. Green, Kesten C. & J. S. Armstrong (2005a), “Value of expertise for forecasting decisions in conflicts" Department of Marketing Working Paper, The Wharton School. Green, Kesten C. & J. S. Armstrong (2005b), “Structured analogies for forecasting,” Department of Marketing Working Paper, The Wharton School. Griffith, J. R. and Wellman, B. T. (1979), “Forecasting bed needs and recommending facilities plans for community hospitals: A review of past performance,” Medical Care, 17, 293-303. Hamilton, W, East, R. and Kilafatis, S. (1997), “The measurement and utility of brand price elasticities,” Journal of Marketing Management, 13, 285-298. 16
  • 17. Jobber, D., Hooley G. and Sanderson, S. (1985), “Marketing in a hostile environment: The British textile industry,” Industrial Marketing Management, 14, 35-41. Juster, T. (1966), “Consumer buying intentions and purchase probability: An experiment in survey design,” Journal of the American Statistical Association, 61, 658-696. Keogh, Eamonn & Shruti Kasetty (2002), “On the need for time series data mining benchmarks: A survey and empirical demonstration,” Proceedings of the Eighth ACM SIGKDD International Conference on Knowledge Discovery and Data Mining. MacGregor, D. (2001), “Decomposition for judgmental forecasting and estimation,” in J. S. Armstrong (Ed.) Principles of Forecasting. Norwell, MA: Kluwer Academic Publishers, pp. 107-123. Makridakis, S., Andersen, A., Carbone, R., Fildes, R., Hibon, M., Lewandowski, R., Newton, J., Parzen, E. and Winkler, R. (1984), The Forecasting Accuracy of Major Times-Series Methods. Chichester: John Wiley. Makridakis, S., Hibon, M., Lusk, F. and Belhadjali, M. (1987), “Confidence intervals: An empirical investigation of tine series in the M-competition,” International Journal of Forecasting, 3, 489-508. Makridakis, S., Wheelwright, S. C., and Hyndman, R. J. (1998), Forecasting Methods for Management, Third edition. New York: John Wiley. McNees, S. K. (1992), The uses and abuses of consensus’ forecasts,” Journal of Forecasting, 11, 703-710. Meade, N. and Islam, T. (2001), “Forecasting the diffusion of innovations: Implications for time series extrapolation,” in J. S. Armstrong (Ed.) Principles of Forecasting. Norwell, MA: Kluwer Academic Publishers, pp. 4577-595. Miller, Don M. & Dan Williams (2004), “Shrinkage estimators for damping X12-ARIMA seasonals,” International Journal of Forecasting, 20, 529-549. Morwitz, V. (2001), “Methods for forecasting from intentions data,” in J. S. Armstrong (Ed.) Principles of Forecasting. Norwell, MA: Kluwer Academic Publishers, pp. 33-56. Rhode, Paul W. and Koleman S. Strumpf (2004), “Historical presidential betting markets,” Journal of Economic Perspectives, 18 (2): 127-142. Rowe, G. and Wright, G. (2001), “Expert opinions in forecasting role of the Delphi technique,” in J. S. Armstrong (Ed.) Principles of Forecasting:. Norwell, MA: Kluwer Academic Publishers, pp. 125-144. Shocker, A. D. and Hall, W. G. (1986), “Pretest market models: A critical evaluation,” Journal of Product Innovation Management, 3, 86-107. Tellis, G. J. (1988),”The price elasticity of selective demand: A meta-analysis of econometric models of sales,” Journal of Marketing Research, 25, 331-341. Tull, D. S. (1967), “The relationship of actual and predicted sales and profits in new product introductions,” Journal of Business, 40, 233-250. Tyebjee, T. T. (1987), “Behavioral biases in new product forecasting,” International Journal of Forecasting, 3, 393-404. Wind, J., Green, P. E, Shifflet, D., and Scarbrough, M. (1989), “Courtyard by Marriott: Designing a hotel facility with consumer-based marketing,” Interfaces, 19, 1, 25-47. Wittink, D. R, and Bergestuen, T. (2001), “Forecasting with conjoint analysis,” in J. S. Armstrong (Ed.) Principles of Forecasting:. Norwell MA: Kluwer Academic Publishers, pp. 147-167. Wolfers, Justin & Eric Zitzewitz (2004), “Prediction markets,” Journal of Economic Perspectives, 18 (2), 107- 126. Wotruba, T. R. and Thurlow, M.L. (1976), “Sales force participation in quota setting and sales forecasting,” Journal of Consumer Research, 8, 162-171. 17