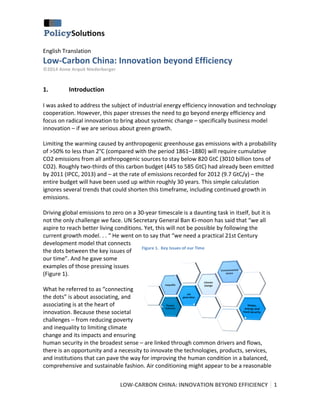
Radical innovation is essential to achieve green growth. This paper presents three case studies of business model innovation: fertilizer, lighting services and end-of-life treatment of tires. It makes the case that a culture of innovation is the basis for a low-carbon economy, which demands that we individually and collectively:
• Aspire to transformational, not incremental change;
• Adopt new behaviors and think differently.
English translation of Mandarin original (in press with the Chinese journal Plant Engineering Consultants)
2.
adaptation
to
a
warmer
world,
for
example,
but
conventional
technologies
can
exacerbate
the
problem
by
requiring
more
electricity
to
be
generated
by
combusting
fossil
fuels
and
are
in
any
case
out
of
reach
for
a
significant
share
of
the
global
population
without
access
to
power.
Error!
Reference
source
not
found.
aptly
illustrates
this
complexity
with
another
example:
China
has
managed
to
reduce
its
energy
and
carbon
intensity
significantly
over
the
past
two
decades.
But
total
CO2
emissions
nonetheless
rose
by
350%
over
the
same
period,
as
a
result
of
successful
poverty
Figure
2.
Percentage
Change
in
Critical
Indicators
1990
-‐
2011
alleviation
efforts
and
population
growth.
This
means
that
–
although
“lower
carbon”
is
clearly
happening
today
–
a
truly
“low-‐
carbon”
and
sustainable
economy
will
require
(disruptive)
innovation
and
solutions
that
do
not
yet
exist.
In
the
12th
Five-‐Year
Plan
for
Economic
and
Social
Development
(2011
–
2015),
China’s
leadership
explicitly
highlighted
the
imperative
to
transform
the
economic
and
political
system
to
deliver
“higher
quality”
and
“inclusive”
economic
growth
that
is
balanced
and
sustainable.
And
the
plan
spells
out
key
strategies
and
targets
to
achieve
the
transition.
Of
particular
relevance
to
this
paper
is
the
emphasis
given
to
innovation,
including
a
specific
target
to
generate
3.3
patents
per
10,000
people
and
a
commitment
to
invest
in
seven
priority
industries
that
are
poised
to
make
a
contribution
to
green
growth,
while
moving
up
the
economic
value
chain:
energy
savings
and
environmental
protection;
new
energy;
clean
energy
vehicles;
biotechnology;
new
materials;
new
IT;
and
high-‐end
manufacturing.
China
also
has
a
recent
history
of
establishing
its
own
and
hosting
global
corporate
R&D
centers.
But
will
China
manage
to
realize
a
sustainable
green
growth
model?
The
answer
will
be
of
existential
interest
to
us
all.
2.
Innovation
Case
Studies
The
need
for
radical
new
business
models
is
illustrated
with
three
specific
examples
(Error!
Reference
source
not
found.).
The
first
is
fertilizer
production,
which
is
responsible
for
1.2%
of
global
CO2
emissions.
It
is
an
energy
and
carbon-‐intensive
process,
with
hydrocarbons
serving
as
both
feedstock
and
energy
source.
And
chemical
fertilizer
is
a
major
and
uncertain
cost
factor
for
farmers,
due
to
global
market
price
volatility,
as
well
as
a
major
contributor
to
land
and
water
degradation.
LOW-‐CARBON
CHINA:
INNOVATION
BEYOND
EFFICIENCY
2
3.
The
second
example
is
the
Figure
3.
Industrial
Sector
Case
Studies
provision
of
lighting
services,
which
accounts
for
an
even
greater
share
of
global
CO2
emissions,
namely
6%.
Current
business
models
offer
bulbs
as
consumable
and
largely
throw-‐
away
products.
Consumers
purchase
lamps/luminaires
from
retailers
and
pay
electric
bills
to
keep
the
lights
on.
Power
producers
have
a
tough
time
keeping
up
with
demand.
Efficient
lighting
options
that
could
cut
household
electricity
consumption
(especially
LED)
have
a
higher
purchase
price,
discouraging
their
widespread
adoption.
The
end-‐of-‐life
treatment
of
scrap
tires
is
the
third
case
study.
Tires
have
a
similar
calorific
value
to
high-‐quality
coal.
Energy-‐intensive
industries
(e.g.,
cement)
increasingly
incinerate
tires
as
a
supplemental
fuel
to
lower
fuel
costs
and
reduce
CO2
emissions.
In
all
three
cases,
business
model
innovation
can
deliver
better
results
for
people
and
the
planet
than
an
incremental
approach
that
strives
only
to
make
existing
processes
more
efficient
and
less
carbon
intensive.
Fertilizer
Production
China
is
the
largest
consumer
and
producer
of
nitrogen
(used
to
make
nitrogenous
fertilizers),
accounting
for
roughly
40%
of
global
production
capacity.
Emissions
from
the
production
and
use
of
synthetic
nitrogen
fertilizer
in
China
have
been
estimated
at
400–840
MtCO2e
in
2005,
accounting
for
a
staggering
8
to
16
%
of
China’s
total
energy-‐related
CO2
emissions
(Kahrl
et
al.,
2010),
with
fertilizer
production
responsible
for
250
MtCO2e
of
the
total
(180
MtCO2e
due
to
embodied
energy
use
and
70
MtCO2e
from
fertilizer
synthesis).
The
fertilizer
manufacturing
status
quo
in
China
relies
on
anthracite
coal
as
the
predominant
feedstock
and
emits
roughly
9
tCO2
per
ton
of
N
fertilizer,
including
fertilizer
synthesis
and
embodied
energy
use
associated
with
the
coal
feedstock,
but
not
mining
or
transportation
emissions
(Kahrl
et
al,
2010).
But
its
global
warming
impact
is
not
the
only
concern;
synthetic
fertilizer
use
can
lead
to
poor
economic
and
other
ecological
outcomes.
Fertilizer
costs
have
become
one
of
the
largest
and
most
variable
expenses
of
producing
a
crop,
and
directly
affect
profits.
The
average
urea
price
in
China,
for
example,
was
15%
lower
at
the
end
of
June
2013
than
the
same
time
the
previous
year
(Error!
Reference
source
not
found.).
LOW-‐CARBON
CHINA:
INNOVATION
BEYOND
EFFICIENCY
3
4.
Energy$Management$
Systems$
Fuel$switch$coal$!$
natural$gas$
Best$Practice$
Technologies$are$30%$
more$energy$efficient$
$
$
1.6&–&3.8&tCO2/t&ammonia&
Source:
Specific
emissions
derived
from
IFA
(2009)
Transformational&
94%$of$the$energy$
consumed$by$the$
fertilizer$industry$is$used$
for$ammonia$synthesis$
Only$25$–$33%$of$
greenhouse$gas$
emissions$from$fossil$
fuel$combustion$(rest$
feedstock)$
$
2&–&5&tCO2/t&ammonia&
Incremental&
Status&Quo&
Figure
4.
Status
quo,
Incremental
and
Transformational
Approaches
in
Fertilizer
Production
$
Cornucopia$BioRefinery$
New$business$model:$
Entire$ear$of$corn$!$
Food$(oil/protein$from$
germ)$+$Fertilizer$(bran/
cobs$gasified)$+$Fuel$
(endosperm$fermented)$
&
BioAmmoniaTM&is&net&
carbon&negative&
Although
China
is
among
the
most
Figure
5.
Average
Urea
Price
(China)
expensive
producers
of
nitrogen
fertilizer,
national
policies
to
facilitate
development
of
the
chemical
fertilizer
industry,
direct
income
subsidies
to
farmers
and
heavy
taxes
to
limit
exports
have
distorted
markets
and
encouraged
farmers
with
the
means
to
purchase
fertilizer
to
over-‐use
it.
This
contributes
to
acid
rain,
water
pollution
and
the
increasing
Source:
China
National
Chemical
Information
Center
frequency
of
red
tides.
Such
policies
also
discourage
entrepreneurs
from
seeking
better,
more
holistic
approaches
to
transition
to
sustainable
agricultural
models
that
better
maintain
ecosystem
health
and
farmer
welfare.
Instead,
the
incremental
approach
calls
for
large
chemical
companies
to
implement
energy
efficiency
and
fuel
switching
measures.
Under
such
a
scenario,
emissions
could
be
cut
by
roughly
25%,
but
there
is
not
much
room
to
go
further,
due
to
the
continued
use
of
fossil
fuels
as
a
feedstock,
which
accounts
for
over
70%
of
the
total
emissions
from
nitrogen
fertilizer
production
in
China.
Modern
plants
are
rapidly
approaching
the
theoretical
minimum
energy
consumption,
making
it
difficult
to
get
below
3.8
tCO2/tNH3
with
coal
as
the
feedstock
(IFA,
2009).
Only
a
transformational
approach
–
inspired
by
the
imperative
of
and
opportunities
to
address
multiple
challenges
simultaneously
–
can
eliminate
emissions
altogether
(Figure
4).
SynGest
is
a
US-‐based
start-‐up
company
that
has
adopted
a
completely
new
business
model,
driven
by
thinking
about
the
best
way
to
use
corn,
while
benefitting
farmers.
The
process
can
use
any
source
of
untreated
biomass,
and
its
calorific
value
is
irrelevant
for
LOW-‐CARBON
CHINA:
INNOVATION
BEYOND
EFFICIENCY
4
5.
fertilizer
production.
This
offers
farmers
the
prospect
of
reducing
or
eliminating
expenses
for
chemical
fertilizers,
as
well
as
a
new
income
stream
(selling
agricultural
waste
as
a
renewable
raw
material
for
organic
fertilizer
production),
while
eliminating
the
pollution
caused
by
open
burning
of
agricultural
waste
and
even
improving
soil
quality
(the
process
produces
a
small
amount
of
the
soil
conditioner
biochar).
The
SynGest
process
yields
an
impressive
slate
of
end
products,
including:
•
Anhydrous
ammonia
fertilizer
(0.1
ton
per
year
for
each
acre
of
corn,
plus
a
transportable
fuel
that
is
the
perfect
carrier
of
hydrogen);
•
Food
grade
corn
oil
and
high
protein
food
for
human
consumption;
•
Riboflavin
rich
dry
stillage
(animal
feed);
•
Butanol
(drop-‐in
fuel
for
internal
combustion
and
diesel
engines);
•
Biochar.
The
SynGest
technology
can
also
address
issues
that
have
arisen
in
conjunction
with
growing
and
distilling
corn-‐based
ethanol,
which
uses
immense
amounts
of
water
(contributing
to
river
and
aquifer
depletion),
energy
(some
scientists
argue
that
more
energy
goes
into
making
a
gallon
of
ethanol
than
is
contained
in
that
gallon)
and
fertilizer
production
and
use,
adding
to
harmful
runoff.
As
pointed
out
by
Zhao
Youshan,
Director,
Commercial
Petroleum
Flow
Committee,
China
General
Chamber
of
Commerce:
“Livestock
breeders
in
China
are
facing
feed
shortages
as
ethanol
fuel
makers
–
prompted
by
government
subsidies
of
roughly
1,900
yuan
($279)
per
tonne
of
ethanol
they
produce
–
have
rushed
to
buy
corn.”
SynGest’s
syngas
technology
can
make
optimal
use
the
whole
ear
of
corn
to
produce
the
“3
Fs”
(food,
fertilizer
and
fuel)
simultaneously.
This
eliminates
the
food
vs.
fuel
dilemma
and
produces
net
carbon
negative
ammonia
fertilizer.
Lighting
Services
The
second
example
of
business
model
innovation
is
lighting
(Figure
6).
Until
the
advent
of
compact
fluorescent
lamp
(CFL)
technology,
the
status
quo
had
been
incandescent,
throw-‐
away
technology
with
a
luminous
efficacy
of
roughly
15
lumen/W.
CFLs
are
four
times
more
efficient
than
incandescent
lamps,
and
quality
bulbs
can
operate
as
long
as
15,000
hours,
but
the
introduction
of
the
technology
did
not
lead
to
any
major
upheaval
in
the
lighting
market.
In
fact,
consumer
reaction
to
early
CFL
technology
was
often
negative,
due
to
the
poor
quality
and
performance
of
products,
as
well
as
concerns
about
the
mercury.
The
resulting
market
spoilage
effect,
combined
with
the
current
much
lower
price
of
CFLs,
makes
it
hard
for
solid-‐state
lighting
technology
–
with
its
longer
lifetime
and
higher
retail
price
–
to
penetrate
the
market.
LOW-‐CARBON
CHINA:
INNOVATION
BEYOND
EFFICIENCY
5
6.
Consumers*purchase*
inefficient*lamps/
luminaires*from*
retailers*and*pay*high*
electric*bills*
*
14&lumen/W*
Incandescent*!*CFL*
technology*
No*change*in*
manufacturer*or*utility*
business*model*
Slow*uptake*of*LED*
and*widening*energy*
supply*gap*
*
60&lumen/W&
Transformational&
Replacement*bulbs*
are*mass*market*
consumables*
Incremental&
Status&Quo&
Figure
6.
Status
quo,
Incremental
and
Transformational
Approaches
to
Lighting
Services
Inefficient*!*LED*
technology*
Utilities*integrate*LED*
technology*into*their*
business*model**
LED*as*infrastructure*
*
*
90&lumen/W*
Source
luminous
efficacy:
http://www.designingwithleds.com/ledfluorescentincandescent-‐efficacy-‐table/
CFLs
brought
an
incremental
improvement
in
efficiency,
but
not
a
fundamental
market
transformation.
Since
2008,
a
growing
number
of
countries
have
begun
to
adopt
regulations
to
phase-‐out
inefficient
incandescent
techology,
including
China,
where
a
ban
on
the
import
and
sale
of
all
incandescent
lamps
above
100W
came
into
force
on
1
October
2012
(further
restrictions
on
smaller
lamp
sizes
will
come
into
force
later).
These
policies
are
driving
a
profound
transition
in
the
lighting
market,
with
rapid
advances
in
solid-‐state
lighting
technology
(Climate
Group,
2012;
McKinsey,
2012;
World
Bank,
in
press).
The
fact
that
LEDs
are
long-‐lived
and
contollable,
makes
them
well
suited
as
an
integral
component
of
electrified
building
systems,
rather
than
as
a
throw-‐away
consumer
good.
We
have
already
seen
this
trend
in
the
off-‐grid
segment,
as
solar
home
system
providers
offer
super-‐efficient
LED
lights
as
part
of
the
package.
For
energy
service
companies
(ESCOs),
LED
lighting
has
already
become
a
standard
component
when
working
with
government
and
commercial
customers,
including
LED
streetlighting,
indoor
lighting
and
controls.
Grid
electricity
suppliers
have
sometimes
resorted
to
large-‐scale
programs
to
distribute
CFLs
as
a
short-‐term
fix
to
severe
supply
shortages,
but
LED
technology
presents
an
opportuntity
for
them
to
be
more
proactive
(World
Bank,
in
press).
Africa’s
largest
utility,
Eskom,
began
distributing
LED
downlights
free
of
charge
under
its
Switch
and
Save
Residential
Mass
Rollout
and
has
received
authorization
to
invest
ZAR
834
million
in
residential
LED
programs
in
the
2013/14
–
2017/18
period.
Even
without
funding
earmarked
for
demand-‐side
management
programs,
utilities
in
developing
countries
could
expand
their
business
model
by
directly
installing
LEDs
with
new
electricity
connections
and
making
it
easy
for
their
customers
to
replace
inefficient
lighting.
It
could
be
particularly
attractive
for
utilities
in
Africa
to
consider.
According
to
a
2013
analysis
by
the
International
Monetary
Fund,
effective
power
tariffs
are
set
30%
below
the
historical
average
cost
of
supplying
electricity
in
sub-‐Saharan
Africa
on
average
LOW-‐CARBON
CHINA:
INNOVATION
BEYOND
EFFICIENCY
6
7.
(excluding
South
Africa).
In
addition,
technical
line
losses
average
25%
and
the
average
collection
rate
was
only
85%,
with
as
many
as
60%
of
poor
households
not
paying
their
electricity
bills
(IMF,
2013).
Under
such
conditions,
and
given
the
sub-‐Saharan
Afican
average
electricity
tariff
of
USS
0.17/kWh,
every
kWh
of
power
used
represents
a
fiscal
loss.
Let
us
take
the
example
of
a
community
of
100,000
minimum
access
households
living
in
an
urban
slum
in
Africa
(Table
1),
each
of
which
would
use
65
kWh/y
of
electricity
to
power
a
single
40W
incandescent
lamp
and
share
a
60W
TV
with
three
other
households
for
three
hours
per
day.
Assuming
that
60%
of
these
low-‐income
households
had
illegal
electricity
connections
and
did
not
pay
for
their
electricity,
the
utility
would
lose
just
over
US$1
million
each
year
on
the
electricity
supplied
(or
US$11
per
household),
as
a
result
of
30%
underpricing,
60%
non-‐paying
customers
and
25%
line
losses
Table
1.
Impact
of
an
“LED-‐Fueled”
Efficiency
Power
Plant
Source:
The
author,
to
be
included
in
World
Bank
(in
press)
If
the
utility
instead
outfitted
these
grid-‐connected
households
with
a
single
high-‐quality
LED
that
delivered
the
same
450
lumens
using
only
7.5
Watts
at
a
cost
of
US$10
per
bulb
(“LED
Current
Technology”
scenario),
the
financial
gains
to
both
the
utility
and
the
paying
customers
would
be
significant.
The
utility
benefits,
because
losses
associated
with
meeting
electricity
demand
are
avoided
as
demand
is
reduced,
and
because
of
the
assumption
that
the
share
of
households
that
can
afford
to
pay
their
electric
bills
increases
from
40%
to
70%.
In
addition,
the
electricity
consumption
of
these
100,000
households
would
decrease
by
55%,
immediately
freeing
up
enough
energy
(3.6
GWh/y)
to
double
the
number
of
customers
served
or
the
amount
of
energy
that
a
household
could
afford
to
purchase,
with
the
same
installed
capacity.
Better
results
could
be
achieved
under
an
“LED
2015
LOW-‐CARBON
CHINA:
INNOVATION
BEYOND
EFFICIENCY
7
8.
Technology”
scenario,
based
on
expected
technology
advances
in
the
next
few
years
(i.e.,
LEDs
that
cost
US$5/bulb
and
use
3.5
W/450
lumen).
A
forthcoming
World
Bank
report
makes
the
case
that
utility
companies
in
Sub-‐Saharan
Africa
could
become
profitable,
if
they
adapted
their
business
models
to
include
constructing
efficiency
power
plants
(EPPs)
by
outfitting
households
with
LEDs
(World
Bank,
in
press).
This
would
have
other
green
economy
benefits,
as
well:
•
Households
would
see
dramatic
cuts
in
their
electricity
bills;
•
Utilities
could
use
bulk
procurement
to
ensure
LED
quality
and
drive
down
prices;
•
Peak
demand
and
grid
losses
would
be
reduced;
•
Utilities
could
serve
more
households
and
businesses
with
the
same
installed
capacity.
Best
Use
of
Scrap
Tires
The
final
example
is
scrap
tires.
The
tire
industry
uses
70%
of
all
natural
rubber
produced
worldwide,
and
consumption
is
expected
to
double
within
the
next
30
years
(ETRMA,
2012).
Applications
that
recycle
or
recover
rubber
are
therefore
critical
to
preserve
this
valuable
resource
–
and
can
result
in
significant
greenhouse
gas
emissions
reductions.
Barring
specific
legislation,
tires
are
generally
treated
as
waste
at
end-‐of-‐life
and
either
discarded
or
sent
to
landfill
(Figure
7).
Countries
with
waste
and
resource
management
legislation
have
achieved
an
incremental
improvement,
by
encouraging
the
use
of
scrap
tires
for
civil
engineering
purposes
(e.g.,
shredding
tires
for
use
as
a
drainage
layer
in
landfills)
or
as
an
alternative
fuel
to
be
co-‐combusted
in
cement
production.
However,
there
is
a
better
way:
material
recycling.
The
material
recycling
route
reduces
potential
greenhouse
gas
emissions
by
roughly
1
t
CO2e
per
ton
of
scrap
tires
recycled
relative
to
the
cement
kiln
co-‐incineration
route
and
by
1.8
t
CO2e,
compared
with
civil
engineering
applications
(Arquit
Niederberger,
Shiroff
and
Raahauge,
2012).
Genan
Business
&
Development
A/S
has
developed
a
mechanical
grinding
processes
that
generates
only
1%
waste
from
scrap
tires,
with
recovered
materials
consisting
of
67%
rubber
powder
and
granulate,
18%
steel
and
14%
textile.
Recycling
avoids
several
processes,
in
particular,
production
of
virgin
polymers,
which
saves
about
50
GJ
per
ton
of
tires,
and
the
iron
fraction
eliminates
the
need
for
400
kg
of
iron
ore
(Arquit
Niederberger,
Shiroff
and
Raahauge,
2012).
LOW-‐CARBON
CHINA:
INNOVATION
BEYOND
EFFICIENCY
8
9.
Figure
7.
Tire
End-‐of-‐Life
Pathways:
Co-‐Incineration
vs.
Material
Recycling
BEST%USE%OF%SCRAP%TIRES?%
! Transformational!
approach!
!
Avoids!0.8!tCO2e/!
t!scrap!tires!!
compared!to!!
co<incineration!!
!!Incremental!approach!
!
Arquit!Niederberger,!Anne,!Shiroff,!Samuel,!Raahauge,!Lars!(2012):!Implications!of!Carbon!Markets!
for!Implementing!Circular!Economy!Models.!ICAE!2012!(Suzhou)!
!
Advanced
tire
recycling
facilities
have
been
built
in
Europe
and
the
USA,
but
many
countries
still
encourage
co-‐incineration
in
cement
plants,
which
makes
it
virtually
impossible
for
a
recycling
facility
to
operate
profitably.
In
China,
resource
scarcity
and
environmental
considerations
led
the
Ministry
of
Industry
and
Information
Technology
to
issue
“Guidance
on
comprehensive
use
of
old
tires”
at
the
end
of
2010,
which
laid
out
principles,
specific
objectives
(e.g.,
increasing
recycled
rubber
production
to
3
Mt
annually
and
rubber
powder
output
to
100
Mt)
and
policies.
With
the
rapid
development
of
the
national
economy
and
the
gradual
improvement
of
living
standards,
China
has
become
a
large
consumer
of
rubber
(accounting
for
>30%
of
global
consumption),
and
there
is
a
large
and
growing
gap
between
the
domestic
rubber
supply
and
demand
in
China
(>70%
of
natural
rubber
and
>40%
of
composite
rubber
was
imported
in
2011).
Since
2001,
tire
production
in
China
has
grown
over
15%
annually,
reaching
470
million
in
2012.
Were
the
240
million
end-‐of-‐life
tires
that
were
generated
in
China
in
2009
recycled,
rather
than
used
for
energy
recovery
or
civil
engineering
applications,
1.9
–
4.3
MtCO2e
emissions
could
be
avoided
(Arquit
Niederberger,
Shiroff
and
Raahauge,
2012).
And
there
are
other
alternatives,
as
well.
In
Europe,
Michelin
Fleet
Solutions
leases
tires
and
offers
tire
upgrades,
maintenance
and
replacement
to
optimize
the
performance
of
trucking
fleets
and
to
lower
their
total
cost
of
ownership.
With
this
business
model,
Michelin
can
collect
tires
when
they
wear
out
and
can
extend
their
technical
utility
by
retreading
or
regrooving
them
for
resale.
The
company
estimates
that
retreads,
for
example,
require
half
of
the
raw
materials
new
tires
do
(Nguyen,
Stuchtey
&
Zils,
2014).
On
the
R&D
front,
Pirelli
is
LOW-‐CARBON
CHINA:
INNOVATION
BEYOND
EFFICIENCY
9
10.
collaborating
with
Genan
to
develop
a
de-‐vulcanisation
process
that
permits
post-‐
consumer
tires
to
be
used
as
a
milled
material
in
new
tires,
closing
the
virgin
rubber
material
loop.
3.
Culture
of
(Disruptive)
Innovation
The
current
linear
economic
model
is
fundamentally
unsustainable,
regardless
of
how
efficient
it
becomes,
and
a
radical
shift
to
a
circular
economy
model
is
urgently
needed.
The
three
case
studies
presented
above
show
that
business
model
innovation
is
needed
to
achieve
low-‐carbon
economies
–
and
they
suggest
that
changes
in
enterprise
business
models
can
transform
entire
industries
and
catalyze
broader
systems
change.
Conceptually,
China’s
leadership
is
quite
advanced
in
its
circular
economy
thinking.
Closed-‐
loop
material
use
along
with
industrial
symbiosis
–
co-‐locating
or
connecting
industries
so
that
a
waste
or
co-‐product
from
one
becomes
an
input
to
another
–
have
become
common
considerations
in
planning
economic
development
zones.
Yet
government
intent
is
not
enough.
A
culture
of
innovation
is
the
basis
for
a
low-‐carbon
economy.
This
demands
that
we
individually
and
collectively:
•
Aspire
to
transformational,
not
incremental
change;
•
Adopt
new
behaviors
and
think
differently.
Business
model
innovation
to
achieve
long-‐term
sustainability
has
often
come
from
startups,
as
in
the
SynGest
example.
It
is
much
more
challenging
to
transform
a
working
business
model,
due
to
vested
interests.
However,
it
is
the
incumbent
fossil
thermal
electricity
generators
and
chemical
and
petrochemical
industry
that
need
to
decarbonize
on
a
massive
scale.
Government
attempts
to
correct
the
failure
of
markets
to
properly
price
resource
depletion
and
greenhouse
gas
emissions
have
therefore
universally
been
too
timid.
They
may
have
encouraged
operational
efficiency,
but
they
have
failed
to
encourage
fundamental
changes
in
business
models.
Researchers
have
found
that
–
in
the
absence
of
substantial
innovation
–
the
financial
performance
of
firms
declines
as
their
environmental,
social
and
governance
(ESG)
performance
improves
(Eccles
&
Serafeim,
2013).
Companies
can
only
create
profitable
opportunities
to
transition
to
circular
economy
models,
if
they
invent
new
products
processes,
and
business
models.
In
addition
to
removing
barriers
to
change
(e.g.,
incentive
systems
and
investor
pressure
that
emphasize
short-‐term
performance),
therefore,
it
will
be
critical
to
nurture
the
behaviors
and
skills
that
set
innovative
entrepreneurs
&
managers
apart
from
execution-‐oriented,
results-‐
driven
managers
(Table
2).
LOW-‐CARBON
CHINA:
INNOVATION
BEYOND
EFFICIENCY
1
0
11.
Table
2.
Innovator's
DNA
Questioning
Observing
Networking
Experimenting
Associating
Asking
questions
that
challenge
common
wisdom
Scrutinizing
customer,
supplier,
and
competitor
behaviors
to
identify
new
ways
of
doing
things
Meeting
people
with
different
ideas,
backgrounds,
and
perspectives
Constructing
interactive
experiences
that
provoke
unorthodox
responses
to
see
what
insights
emerge
Connecting
the
unconnected
across
questions,
problems,
or
ideas
from
unrelated
fields
Source:
Christensen,
Dyer
&
Gregersen
(2011)
These
skills
and
behaviors
have
been
referred
to
as
the
“innovator’s
DNA”
(Christensen,
Dyer
&
Gregersen,
2011),
and
they
can
be
encouraged.
Engineers
have
an
established
capability
to
deliver
incremental
innovation;
radical
innovations,
however,
require
new
knowledge
and
skills.
CAPEC
is
well
positioned
to
advocate
for
changes
in
the
way
in
which
engineers
are
educated
and
trained,
as
well
as
to
foster
a
culture
of
innovation
among
Chinese
plant
engineers.
As
called
for
in
the
UK
context
(Royal
Academy
of
Engineering,
2012),
CAPEC
can
consider
including
the
responsibility
of
engineers
to
address
radical
innovation
and
drive
the
innovation
economy
in
its
professional
competency
and
training
functions.
It
can
serve
a
liaison
function
between
institutions
of
higher
education
and
employers
to
encourage
greater
focus
on
radical
innovation
through
engineering.
Transformational
innovations
are
essential,
if
China
is
to
achieve
the
12th
Five-‐Year
Plan
vision
of
an
“ecological
civilization”,
which
Hu
Jintao
has
suggested
can
be
realized
by
pursuing
development
“…in
a
scientific
way
that
puts
people
first
and
is
comprehensive,
balanced
and
sustainable”.
Yet
individual
corporate
actions
on
their
own
won’t
suffice
to
create
a
circular
economy
at
scale,
given
the
systemic
nature
of
the
barriers
(Nguyen,
Stuchtey
&
Zils,
2014).
Government
policymakers
must
focus
society’s
attention
on
transformational
change;
this
will
inspire
enterprises
and
individuals
to
innovate
the
stepping
stones
of
an
enduring,
high-‐quality
development
path.
There
is
a
real
danger
that
a
well
intentioned
rush
to
achieve
incremental
improvements
could
actually
hinder
the
transformational
approaches
needed
to
support
circular
economy
models
and
green
growth
(Arquit
Niederberger,
Shiroff
&
Raahauge,
2012).
Author:
Anne
Arquit
Niederberger,
Ph.D.
Affiliation:
Principal,
Policy
Solutions
Contact:
www.policy-‐solutions.com
This
paper
is
the
English
translation
of
a
paper
to
be
published
in
Mandarin
in
the
journal
Plant
Engineering
Consultants,
based
on
a
presentation
at
CAPEC’s
2013
International
F orum
on
Low-‐Carbon
Industry
and
Green
Economy,
held
in
Beijing
on
20
November
2013.
LOW-‐CARBON
CHINA:
INNOVATION
BEYOND
EFFICIENCY
1
1
12.
4.
References
Arquit
Niederberger,
A,
Shiroff,
S,
and
Raahauge,
L,
2012:
Implications
of
Carbon
Markets
for
Implementing
Circular
Economy
Models.
White
Paper,
ICAE
2012
(Suzhou).
Christensen,
C.M.,
Dyer,
J.,
and
Gregersen,
H.,
2011:
The
Innovator's
DNA:
Mastering
the
Five
Skills
of
Disruptive
Innovators.
Harvard
Business
Review
Press.
Climate
Group,
2012:
Lighting
the
Clean
Revolution:
The
Rise
of
LEDs
and
What
it
Means
for
Cities.
London:
The
Climate
Group,
61
pp.
Eccles,
R.,
and
Serafeim,
G.,
2013:
The
Performance
Frontier:
Innovating
for
a
Sustainable
Strategy,
Harvard
Business
Review
91
(5),
50–60.
ETRMA,
2012:
End-‐of-‐Life
Tires
–
A
Valuable
Resource
with
Growing
Potential
(2011
Edition).
Brussels:
European
Tyre
and
Rubber
Manufacturers’
Association.
IFA,
2009:
Energy
efficiency
and
CO2
emissions
in
ammonia
production,
Feeding
the
Earth
(Issue
Brief).
International
Fertilizer
Industry
Association,
Paris.
IMF,
2013:
Energy
Subsidy
Reform
in
Sub-‐Saharan
Africa:
Experiences
and
Lessons,
pre-‐
publication
draft.
Washington,
D.C.:
International
Monetary
Fund.
IPCC,
2013:
Summary
for
Policymakers.
In:
Climate
Change
2013:
The
Physical
Science
Basis.
Contribution
of
Working
Group
I
to
the
Fifth
Assessment
Report
of
the
Intergovernmental
Panel
on
Climate
Change
[Stocker,
T.F.,
D.
Qin,
G.-‐K.
Plattner,
M.
Tignor,
S.K.
Allen,
J.
Boschung,
A.
Nauels,
Y.
Xia,
V.
Bex
and
P.M.
Midgley
(eds.)].
Cambridge
University
Press,
Cambridge,
United
Kingdom
and
New
York,
NY,
USA.
Kahrl,
F,
Li,
YJ,
Su,
YF,
Tennigkeit,
T.,
Wilkes,
A.,
and
Xu,
JC,
2010:
Greenhouse
Gas
Emissions
From
Nitrogen
Fertilizer
Use
In
China.
Environmental
Science
&
Policy,
13(8),
688-‐694.
McKinsey,
2012:
Lighting
the
way:
Perspectives
on
the
Global
Lighting
Market.,
2nd
Edition.
McKinsey
&
Company,
57
pp.
Nguyen,
H.,
Stuchtey,
M.,
and
Zils,
M.,
2014:
Remaking
the
industrial
economy,
McKinsey
Quarterly,
February
2014.
Royal
Academy
of
Engineering,
2012:
Educating
Engineers
to
Drive
the
Innovation
Economy.
London:
The
Royal
Academy
of
Engineering,
28
pp.
World
Bank,
in
press:
Market
Transformation
for
Energy
Efficient
Lighting:
Focus
on
Africa.
Washington,
D.C.:
The
World
Bank.
LOW-‐CARBON
CHINA:
INNOVATION
BEYOND
EFFICIENCY
1
2