How Businesses Fare with Daily Deals: A Multi-Site Analysis of Groupon, Livingsocial, Opentable, Travelzoo, and BuyWithMe Promotions
•
3 gefällt mir•6,197 views


Empfohlen
Weitere ähnliche Inhalte
Was ist angesagt?
Was ist angesagt? (20)
Andere mochten auch
Andere mochten auch (20)
Ähnlich wie How Businesses Fare with Daily Deals: A Multi-Site Analysis of Groupon, Livingsocial, Opentable, Travelzoo, and BuyWithMe Promotions
Ähnlich wie How Businesses Fare with Daily Deals: A Multi-Site Analysis of Groupon, Livingsocial, Opentable, Travelzoo, and BuyWithMe Promotions (20)
Mehr von Phi Jack
Mehr von Phi Jack (20)
Kürzlich hochgeladen
Kürzlich hochgeladen (20)
How Businesses Fare with Daily Deals: A Multi-Site Analysis of Groupon, Livingsocial, Opentable, Travelzoo, and BuyWithMe Promotions
- 1. How Businesses Fare With Daily Deals: A Multi-Site Analysis of Groupon, LivingSocial, OpenTable, Travelzoo, and BuyWithMe Promotions Utpal M. Dholakia* Rice University This Version: June 13, 2011 Abstract We examine performance of daily deals run through five major sites in 23 US markets. In a survey-based study of 324 businesses that conducted a daily deal promotion between August 2009 and March 2011, 55.5% of businesses reported making money, 26.6% lost money and 17.9% broke even on their promotions. Although close to 80% of deal users were new customers, significantly fewer users spent beyond the deal’s value or returned to purchase at full price. 48.1% of businesses indicated they would run another daily deal promotion, 19.8% said they would not, and 32.1% said they were uncertain. We also examined drivers of deal profitability, the loyalty of merchants to a daily deal site, and how spending on daily deals has affected spending of businesses on other marketing programs. Overall, our findings lead us to conclude that there are relatively few points of differentiation between the daily deal sites, making it harder for any one site to stand out from the others. Our findings also uncovered a number of red flags regarding the industry as a whole: (1) the relatively low percentages of deal users spending beyond the deal value (35.9%) and returning for a full-price purchase (19.9%) are symptomatic of a structural weakness in the daily deal business model, (2) less than half of the businesses indicated enthusiasm about running another daily deal in the future, (3) fully 72.8% indicated openness to considering a different daily deal site, and (4) only 35.9% of restaurants/ bars and 41.5% of salons and spas that had run a daily deal asserted they would run another such promotion in the future. All of these findings point to the same conclusion: Over the next few years, it is likely that daily deal sites will have to settle for lower shares of revenues from businesses compared to their current levels, and it will be harder and more expensive for them to find viable candidates to fill their pipelines of daily deals. * Utpal M. Dholakia is an associate professor of management at the Jones Graduate School of Business, Rice University. This academic study was funded entirely through financial support received by the author from the Jones Graduate School of Business (JGSB), Rice University. I am deeply appreciative of Rice University’s support of my research. 1 Electronic copy available at: http://ssrn.com/abstract=1863466
- 2. Summary of Main Findings and Conclusions • 55.5% of surveyed businesses made money, 26.6% lost money, and 17.9% broke even on their daily deal promotions. The percentages are remarkably similar across the five daily deal sites. • On average, close to 80% of deal users were new customers of the business, and they spent $64.3 during that visit. However, just 35.9% of deal users spent beyond the deal’s face value, and only 19.9% returned to purchase at full price. 21.7% of deal buyers never redeemed their deal vouchers. By their very nature, daily deal promotions appear to be limited in their abilities to attract free-spending consumers, and to convert deal-users into repeat buyers with the propensity to be relational with, and loyal to, the business afterwards. • The daily deal’s profitability is affected positively by (1) the percentage of new customers, (2) the percentage that became repeat buyers, (3) the non-redemption rate, and (4) age of business (older, more established businesses had greater incidence of profitable deals). Interestingly, neither spending levels of customers nor size of business impacted deal profitability. • Considering deal characteristics, the deal’s face value, and placing a maximum limit on deals sold are positive predictors whereas redemption duration is a negative predictor of deal profitability. To increase the likelihood of a profitable promotion, businesses should consider offering a daily deal of relatively high face value ($50 or more), with a shallow discount (at most 25% off face value), a short redemption period (three months or less), and place a maximum limit on number of deal vouchers that consumers can buy. • 48.1% of businesses indicated they would run another daily deal promotion, 19.8% said they would not, and 32.1% said they were unsure whether they would do so. These numbers continue to raise serious questions regarding future sustainability and growth of the daily deal promotion industry. An industry which is able to convert less than half of the customers who try its service into certain second-time buyers is likely to run into trouble finding enough merchants to sustain itself at some point in the not-too-distant future. • 72.8% of surveyed businesses evince no loyalty to the daily deal site where they have run a promotion and would consider a different site for their next promotion. It appears that none of the daily deal sites have been very successful in differentiating themselves from others, or in engendering significant loyalty among their respective merchant bases. This finding raises the concern that current levels of revenue-sharing (ranging from 30%, but more often as high as 50%) demanded by daily deal sites may be unsustainable and subject to erosion in the near future, as shrewd merchants play the salesperson of one site against the other in demanding more favorable terms before agreeing to run the next deal. It also means that the sites will have to keep spending significant amounts in marketing and sales expenses even to re-sign merchants that they have done business with before, and to keep their pipeline of viable deals full, in addition to the expenditures for acquiring consumers. • Among industries, health and services, and special events are the most successful with over 70% of them making money on the promotion. However, two of the largest ones, restaurants/ bars and salons and spas don’t perform as well. Only 43.6% of the restaurants surveyed 2 Electronic copy available at: http://ssrn.com/abstract=1863466
- 3. earned a profit from the daily deal promotion, and just 35.9% of them intend to run another daily deal in the future. 53.7% of salons and spas made money on the promotion, but only 41.5% of them intend to run another daily deal in the future. Since restaurants/ bars and salons and spas represent the bread-and-butter for many daily deal sites, these findings raise questions regarding the continued availability of a sufficient pool of viable revenue- generating merchants from these two industries for daily deal sites. • When compared to deals structured as “dollar promotions” where customers get a certain amount of money to spend on anything they wish (e.g., $20 worth of food for $10), “item promotions” specifying a particular product, service, or bundle perform better. 47% of dollar promotions were profitable, whereas 59% of item promotions made money. Likewise, 58% of merchants running dollar promotions intended to run another daily deal, whereas fully 79% of those running item promotions expressed such repeat intentions. • Surveyed businesses spent an average of 10.9% of their annual revenues (approximately $198,000) on marketing programs in 2010. Daily deals constituted the single-largest category of marketing spending, with businesses spending an average of 23.5% of their annual marketing budget (or $46,530) on daily deals. Email promotions (16.1% or $31,878) and online search advertising through programs such as Google AdSense (14.7% or $29,106) were the next largest categories of marketing spending. In contrast, they spent relatively little for Yellow pages advertising (1.6%), TV advertising (1.8%) and Valpak coupons (2.1%). • All traditional marketing programs have been impacted adversely by daily deal spending. Spending on Yellow pages advertising was down 27.5% compared to 2009, print advertising was down 21.6% and self-managed direct mail was down 17.6%. Local radio and TV advertising also dropped substantially whereas, spending on email promotions and online search programs was up substantially (7.8% in each case) over the past year. Taken together, the findings of this study lead us to conclude that there are relatively few points of differentiation between the daily deal sites covered in the study, making it harder for any one site to stand out from the others. Our findings also uncovered a number of red flags regarding the industry as a whole: (1) the relatively low percentages of deal users spending beyond the deal value (35.9%) and returning for a full-price purchase (19.9%) are symptomatic of a structural weakness in the daily deal business model, (2) less than half of the businesses indicated enthusiasm about running another daily deal in the future, (3) fully 72.8% indicated openness to considering a different daily deal site for another promotion, and (4) only 35.9% of restaurants/ bars and 41.5% of salons and spas that had run a daily deal asserted they would run another such promotion in the future. All of these findings point to the same conclusion: Over the next few years, it is likely that daily deal sites will have to settle for lower shares of revenues from businesses compared to their current levels, and it will be harder and more expensive for them to find viable candidates to fill their pipelines of daily deals. 3
- 4. “Great for exposure... but the people we got only want to come back if there is a deal.” – Salon & Spa owner “It is a marketing expense to get people into the door, then it is up to my staff to turn them into lifelong customers” – Restaurant Owner Introduction After an explosion in popularity and the hype-infused enthusiasm of 2010, recent weeks have seen a considerable cooling in assessments of the daily deal promotion industry1. Nevertheless, revenue forecasts for the industry continue to foresee strong growth. For instance, although varying in their estimates, analysts concur that industry revenues will reach several billion dollars by the end of 2011, increasing at annual rates in excess of 100%2. Not surprisingly, this industry is a hotbed of investment and startup launch activity. Just within the last few weeks, Facebook, Amazon, Google and AT&T have all launched or announced daily deal sites, and Groupon has filed for an IPO3. At the same time, startups continue to be launched on a weekly basis, with numerous private equity companies, venture capitalists, and institutional investors playing active roles. Along with revenues, sales forces of new and established daily deal sites continue to grow, and aggressively compete with one another to sign up merchants to run popular deals on their respective sites. Consequently, large numbers of small- and medium-sized businesses all over the US (and in other countries) are having to make decisions on a daily basis regarding whether to 1 See for example, Cohen Peter (2011), “Memo to SEC: Groupon has no competitive advantage, stop its IPO”, Forbes blogs, June 6, Available online at: http://blogs.forbes.com/petercohan/2011/06/06/memo-to-sec-groupon- has-no-competitive-advantage-stop-its-ipo/, and Morphy, Erika (2011), “No givesies, backsies and other tips for deal-a-day market,” Forbes blogs, June 4, Available online at: http://blogs.forbes.com/erikamorphy/2011/06/04/no- givesies-backsies-and-other-tips-for-going-after-the-deal-a-day-market/. 2 Estimates of daily deal industry revenue and growth rates vary. Local Offer Network Inc, which sells advertising and technology services to daily deal sites, estimated that industry revenue will top $2.67 billion in 2011, a 138% increase from $1.12 billion in 2010 (http://www.internetretailer.com/2011/03/24/daily-deal-revenue-will-increase- 138-year), whereas BIA/Kelsey estimated that 2011 revenues will be $1.24 billion, rising from $873 million in 2010 (http://www.minonline.com/news/Daily-Deal-Revenue-to-Reach-$3-9-Billion-Publishers-Rush-In_16785.html). Regardless of the specific numbers, virtually all experts agree that the industry is poised to grow substantially this year. 3 See Martinez, Juan (2011), “Technology giants jump into packed daily deals market,” Direct Marketing News, June 1, Available online at: http://www.dmnews.com/technology-giants-jump-into-packed-daily-deals- market/article/203562/, and Ovide, Shira (2011), “Groupon IPO: It’s here,” WSJ Blogs Deal Journal, June 2, available online at: http://blogs.wsj.com/deals/2011/06/02/groupon-ipo-its-here/ 4
- 5. run a daily deal promotion in their local market, and if yes, which site or sites to go with, and what the terms of the daily deal offer should be. Despite the industry’s growth and widespread interest, knowledge regarding how businesses fare with daily deal promotions, and the factors that contribute to profitable daily deals is still relatively incomplete; nor is there sufficient information regarding the degree to which daily deal promotions are affecting other marketing activities of small and medium-sized businesses4. Anecdotal narratives and extrapolation from research regarding other types of price promotions offers some insights regarding daily deals. Considering the positives first, there is emerging evidence that daily deal promotions can provide useful exposure to start-ups by showcasing their products and services in front of a broad spectrum of consumers. Furthermore, daily deal site operators argue that merchants can convert a significant number of the flood of new customers that the deal draws into relational buyers, increasing their long-term sales and profitability. In this respect, daily deals are seen as replacing advertising and direct marketing efforts which many local businesses have traditionally done through Yellow pages, direct mailers such as Valpak coupons, and community newspaper advertising. However, specific quantitative evidence supporting or refuting these conjectures is currently lacking. On the negative side, daily deals are seen as expensive and harmful for many small and medium-sized businesses. When the deep discounts offered to consumers, and payouts withheld by site operators (which typically range from 20 to 50% of revenues) are taken into consideration, the merchant is often left with insufficient revenues to cover the costs. Drawing upon the academic price promotions literature5, other negative aspects of daily deals have also been pointed out such as their propensity to attract price-sensitive deal-prone shoppers with little 4 For a recent summary of these issues, see Dholakia, Utpal M. (2011), “What makes Groupon promotions profitable for businesses?” Available online at: http://papers.ssrn.com/sol3/papers.cfm?abstract_id=1790414. 5 See for example, Blattberg, Robert C., and Scott A. Neslin (1990), Sales Promotions: Concepts, Methods and Strategies, Englewood Cliffs, NJ: Prentice Hall, Mela, Carl F., Sunil Gupta and Donald R. Lehmann (1997), “The Long-Term Impact of Promotion and Advertising on Consumer Brand Choice,” Journal of Marketing Research, 34(May), 248-261, and Pauwels, Koen, Dominique M. Hanssens, and S. Siddharth (2002), “The long-term effects of price promotions on category incidence, brand choice, and purchase quantity,” Journal of Marketing Research, 39(4), 421-439. 5
- 6. interest in repeat purchases at full price, the frustration of employees from reduced or lost gratuity earnings and increased workloads6, and the dilution of the firm’s brand equity from indiscriminate price-cutting7. Study objectives Our goals in the study are to obtain insights into how businesses fare with daily deal promotions, and to compare their experiences with deals conducted on five major daily deal sites: Groupon, LivingSocial, OpenTable, Travelzoo, and BuyWithMe8. Through this analysis, our primary objective is to provide specific useful guidance to small- and medium-sized businesses considering a daily deal promotion. Additionally, we also wish to draw some big picture conclusions regarding the daily deal industry’s performance thus far along with its prospects for the future. Specifically, we address the following research questions in this study: • What proportions of businesses make money vs. lose money on daily deal promotions? Does incidence of profitability vary by daily deal site? • How do customer behavior metrics, specifically: (1) new customers brought in by the deal, (2) spending by deal users beyond the deal’s value, (3) repeat purchases at full price, and (4) non-redemption rates, vary by daily deal site, and which of these metrics impact deal profitability? • How do deal characteristics such as the offer’s face value, percent discount off regular price, redemption duration, and placing an upper limit on deals sold, impact deal profitability? • Having run a daily deal promotion, what proportion of businesses intends to run another daily deal in the future? How loyal are these businesses to a particular daily deal site? • How do deal profitability and repeat use intentions vary by industry? • Are item daily deals (i.e., offers for specific items or packages) better than dollar daily deals (i.e., deals letting customers spend a certain amount on whatever they wish), or vice versa? 6 Dholakia, Utpal M. (2011), “Why unhappy employees can wreck promotional offers,” Harvard Business Review, January-February, Reprint F1101C. 7 Yoo, Boonghee, Naveen Donthu, and Sungho Lee (2000), “An Examination of Selected Marketing Mix Elements and Brand Equity,” Journal of the Academy of Marketing Science, 28(2), 195-211. 8 Although referred to as “daily deals” here for ease of exposition, we note that many of the promotional offers last longer, spanning several days. 6
- 7. • How much of their marketing budgets do businesses spend on daily deal promotions, and how has this spending impacted their spending on other marketing programs? Study method We conducted a survey of businesses that had completed a daily deal promotion between August 2009 and March 2011 on one of the following sites: Groupon, LivingSocial, OpenTable, Travelzoo, and BuyWithMe. The online survey was conducted in April and May 2011. First, we identified approximately 1,200 businesses nationally from a total of 23 US cities. For each business, we identified its owner or marketing manager through the company’s website and contacted him or her by email with an invitation to participate in the study. Businesses were identified using a combination of searches on web-pages of the daily deal sites, and also through Google, Bing, and Yahoo search engines to discover other past deals that were not listed on the daily deal sites. Respondents were offered a $10 gift card for completing our survey. The survey consisted of a number of questions regarding the respondent’s experience with the specific daily deal promotion focusing on key consumer behavior metrics (discussed below). We also asked participants about their firm’s marketing budget, how they allocated it across different marketing programs, and how this allocation had changed on account of daily deal spending. Finally, we asked questions regarding their business such as its year of founding, annual revenue, and the industry it belonged to. We sent one additional email reminder to all non-respondents approximately ten days after the first invitation. When the study closed in early May 2011, we had received 324 completed responses, resulting in a response rate of 27%9. The distribution of daily deal sites in the respondent sample was as follows: Groupon = 150 (or 46.3% of the sample), LivingSocial = 115 (35.5%), OpenTable = 12 (3.7%), Travelzoo = 28 (8.6%) and BuyWithMe = 19 (5.9%). For each business, we matched data from the survey to information regarding the daily deal’s characteristics and performance (date and duration of the deal, its face value and offer value, and 9 This response rate does not factor in the fact that some of the 1,200 businesses contacted were unreachable, either because of invalid email addresses, or because the email recipients simply did not check their email in time. Although the exact number of inaccessible non-respondents is not available, we estimate it was somewhere between 5% and 10% (i.e., 60 to 120 recipients). 7
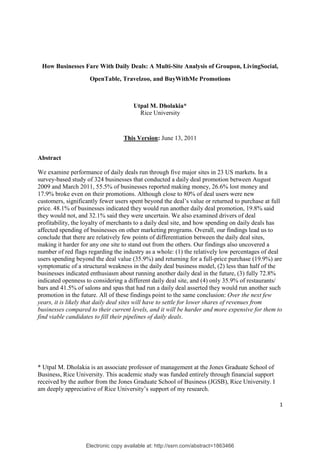
- 8. the number of daily deals sold). These variables were collected directly from the respective daily deal sites, so they are observed variables instead of self-reports provided by survey respondents. All analysis reported in this paper is based on this sample of 324 businesses. Incidence of profitable vs. unprofitable daily deal promotions Perhaps the most important question that small and medium-sized businesses considering a daily deal promotion have is: Will we make or lose money on the promotion? In a study conducted with businesses running Groupon promotions in September 2010, 66% of respondents indicated having profitable promotions, whereas 32% reported losing money10. Have things changed since that time, and are the proportions of unprofitable and unprofitable promotions different for other daily deal sites? FIGURE 1. Incidence of profitable and unprofitable promotions by daily deal site 52.6% Made money BuyWithMe 15.8% 31.6% Broke even 50.0% Travelzoo 23.1% Lost money 26.9% 41.7% OpenTable 25.0% 33.3% 59.8% LivingSocial 15.0% 25.2% 54.9% Groupon 18.8% 26.4% 55.5% Full Sample 17.9% 26.6% 0% 10% 20% 30% 40% 50% 60% 70% We asked respondents to assess the profitability of their daily deal11, categorizing their 10 Dholakia, Utpal M. (2010), “How effective are Groupon promotions for businesses?” Working paper, Rice University. Available online at: http://papers.ssrn.com/sol3/papers.cfm?abstract_id=1696327 11 The specific question asked in the present survey was: “How would you characterize the profitability of your [daily deal site] promotion?” The responses available to participants were “We lost a lot of money on the promotion”, “We lost a little money on the promotion”, “We broke even; we neither made nor lost money”, “We earned a little money on the promotion”, and “We earned a handsome profit from the promotion”. Note that in the September 2010 study, there was no middle “We broke even” option available to respondents. They had to indicate whether the Groupon promotion was profitable or not in that study. The middle option in the current study appears 8
- 9. responses into three types: whether the respondent lost money, broke even, or made money on the promotion. Figure 1 summarizes the results for the entire respondent sample and for each daily deal site. As Figure 1 reveals, considering results for the full sample, just over half, or 55.5% of the respondents made money on their daily deal promotion, whereas just over a quarter or 26.6% lost money. The remainder, 17.9% broke even, neither making nor losing money. These percentages are remarkably similar across the five daily deal sites covered in the study. A comparison revealed no statistically significant differences between the sites in incidence of profitable and unprofitable daily deal promotions. It is also worth noting that these results are consistent with the findings from our September 2010 study, providing added confidence in their validity. How consumer behavior drives daily deal promotion profitability Local businesses conduct daily deal promotions to accomplish a number of short- and long- term objectives. In the short run, their primary goal is to gain exposure within a new consumer base, specifically by getting new customers to try their offerings12. Additionally, both revenue and profits are enhanced when deal users, whether they are new or existing customers of the business, spend beyond the deal’s face value on the occasion that they use the deal. This is because the additional spending (beyond the deal value) by customers usually garners a significantly higher margin for the business. Over the longer term, the success of the daily deal promotion hinges on its ability to convert a significant proportion of deal users into repeat buyers who return to repurchase from the business at full price13. Such regular sales not only earn higher margins but they also stabilize the to have drawn some respondents from both profitable and unprofitable categories when compared to the September 2010 results. 12 See Dholakia, Utpal M. and Gur Tsabar (2011), “A startup’s experience with running a Groupon promotion,” Working paper, Rice University. Available online at: http://papers.ssrn.com/sol3/papers.cfm?abstract_id=1828003, and Lewis, Michael (2006), “Customer acquisition promotions and customer asset value,” Journal of Marketing Research, 43(May), 195-203. 13 For a detailed discussion of this issue, see Dholakia, Utpal M. (2006), “How Customer Self-Determination Influences Relational Marketing Outcomes: Evidence from Longitudinal Field Studies,” Journal of Marketing Research, 43(1), 109-120. 9
- 10. firm’s revenue and profit streams, and are crucial to its long-term viability. For each of these three consumer behaviors, we asked questions in the survey regarding both, percentage of customers (e.g., what percentage of customers using the daily deal were new customers?) and the average amount spent by them (e.g., what was the average amount spent by new customers on the occasion when they used the daily deal?). The fourth determinant of the daily deal promotion’s profitability is the percentage of daily deals that remain unredeemed at the end of the promotion period. This is because the revenue from unredeemed deals flows directly to the merchant’s bottom-line14. Note that this is a unique aspect of daily deals (relative to other types of price promotions) because consumers pay the cost of the daily deal up front, and have discretion in redeeming the deal until its expiration date. Finally, an important aspect of the promotion is the number of deals sold by the site because it affects absolute levels of all the customer metrics such as the number of new customers, the number of unredeemed deals, etc. In our dataset, this variable is not available for BuyWithMe promotions, but it is available for the remaining four sites. TABLE 1. Average levels of customer behavior metrics by daily deal site Customer Behavior Full Groupon LivingSocial OpenTable Travelzoo BuyWithMe Metrics Sample % of customers that were 79.2% 77.6% 83.0% 51.4% 85.3% 81.1% new Avg. amount spent by new $64.3 $46.0 $84.5 $127.3 $62.8 $50.9 customers % of deal users who spent 35.9% 36.7% 34.3% 67.2% 21.3% 40.7% beyond deal value Avg. amount spent beyond $60.2 $47.0 $93.5 $37.3 $24.2 $29.8 deal value % of deal users that 19.9% 20.4% 18.7% 30.0% 18.0% 22.0% became repeat buyers Avg. amount spent by $70.8 $69.6 $73.0 $103.3 $61.3 $66.5 repeat customers on next visit % of unredeemed deals 21.7% 23.4% 20.9% 13.4% 18.1% 18.5% when promotion ended Number of deals sold 913 1,205 562 665 723 NA 14 In a recent in-depth analysis of a single Groupon promotion conducted by Dholakia and Tsabar (2011), we found that unredeemed deals significantly bolstered the promotion’s profitability, adding approximately 30% to the profits otherwise earned by the business from running the promotion. 10
- 11. Table 1 summarizes the average levels of these customer metrics for the full sample of respondents, and for each of the daily deal promotions. It reveals a number of interesting results: • Across all daily deal promotions, close to 80% of those redeeming the deal were new customers. OpenTable deals attracted significantly fewer new customers when compared to the other deals: only 51.9% of OpenTable deal users were new customers. • New customers spent an average of $64.3 on the occasion when they used the deal. Groupon deal users ($46.0) spent significantly less than LivingSocial ($84.5) and OpenTable ($127.3) deal users. • Just over a third of daily deal users (35.9%) spent beyond the deal’s face value, and these customers spent an additional $60.2 on average at the business. The LivingSocial deal users ($93.5) spent significantly more when compared to the other groups. • Approximately a fifth (or 19.9%) of daily deal users returned a second time to the merchant to purchase at full price. A significantly greater proportion of OpenTable deal users (30.0%) became repeat buyers relative to the other groups. • 21.7% of deal buyers never redeemed their deals. Businesses running OpenTable deals reported the lowest non-redemption rate (13.4%); the rates for the other sites were similar to one another. • Groupon sold significantly more deals (N = 1,205) when compared to either LivingSocial (N = 562) or OpenTable (N = 665). Interestingly, Groupon and Travelzoo were not significantly different from each other, and the other three sites sold similar numbers of deals on average. Taken together, these customer behavior metrics provide useful insights into the performance of daily deal promotions. It appears that daily deal promotions are very successful in attracting new customers. It should be noted that a business can control this metric by restricting the daily deal only to its new (and inactive) customers. In fact, 21.7% of the businesses in our sample had this stipulation. Because the conversion rates for spending beyond the deal value and repeat purchase are significantly lower, we can conclude that businesses are much less successful in getting daily deal users to spend beyond the deal value, or return a second time to the business to purchase at full price. Several verbatim comments from respondents provide further support to this conclusion: • “The downside [of a daily deal promotion] is the customers we get in some cases are SUPER cheap, and look to nitpick even beyond the deal.” – BuyWithMe, Online retail. • “People also don’t tip on the vouchers so it’s bad for employee morale... Since almost half the people came in the last week, it was very difficult making sure everyone had a good 11
- 12. experience and we weren’t overwhelmed.” – Travelzoo, Restaurant/ Bar. • “Guests take advantage of the deal by buying low cost ticket items and stop buying once they meet the dollar value.” – OpenTable, Restaurant/ Bar. • “It was not a great experience. I have created a special environment and these offers do not bring in the kind of people who can appreciate it.” – LivingSocial, Salon & Spa. • “It’s not bad for exposure, but as a dental practice, most were looking for one and done. Some people travelled past hundreds of dental offices to come see me. The reality is they won’t come back.” – Groupon, Medical Services. Assessments such as these provided by business owners, along with the results of Table 1 and the findings from the September 2010 study all lead to the same conclusion: By their very nature, daily deal promotions appear to be limited in their abilities to: (1) attract free-spending consumers, and (2) to convert deal-users into repeat buyers with the propensity to be relational with, and loyal to, the business afterwards. We can call this a structural weakness of the daily deal model in the sense that it is inherent to a marketing program that is based primarily on deep discounting, and thus it is common to all daily deal sites and all daily deal marketing programs. Which consumer behaviors drive daily deal profitability? Which of these consumer behavior metrics influence the daily deal’s profitability? To answer this question, we conducted a multiple regression analysis with the seven customer behavior metrics from Table 1 as predictors of the daily deal promotion’s profitability15. For control purposes, we also included dummy variables for each daily deal site (with Groupon serving as the reference category), and the age of the business and its annual revenue as predictors. The results from this analysis are provided in Table 2. 15 We also conducted a regression by including the logarithm of number of deals sold as an additional predictor. The number of deals sold was not a significant predictor of deal profitability. We do not report this regression in Table 2 because it did not include BuyWithMe deals for which we did not have number of deals. 12
- 13. TABLE 2: Regression of daily deal profitabiliya on consumer behavior metrics Variable Standardized t-value p-value Regression Coefficient % of customers that were new .25 2.60** .01 Avg. amount spent by new -.08 -.66 .51 customers % of deal users who spent beyond .07 .80 .43 deal value Avg. amount spent beyond deal .18 1.62 .11 value % of deal users that became repeat .18 2.12** .04 buyers Avg. amount spent by repeat -.08 -.89 .38 customers on next visit % of unredeemed deals when .20 2.47** .02 promotion ended LivingSocial -.01 -.12 .91 OpenTable .10 1.18 .24 Travelzoo -.08 -.90 .37 BuyWithMe .01 .07 .94 Age of business .17 1.97** .05 Annual revenue of business .01 .12 .91 a Dependent variable is profitability of the daily deal promotion reported by respondents; **indicates statistically significant coefficient at the p=.05 level of significance; *indicates statistically significant coefficient at the p = .10 level of significance As the results in Table 2 indicate, there were four significant predictors of daily deal profitability. Both the percentage of new deal users and the percentage of deal users that became repeat buyers are positive predictors of profitability, indicating that businesses running a daily deal promotion may be better off restricting the offer to new customers or to those who have been inactive for a long time, just like the 21.7% of businesses in our sample that employed this stipulation. Likewise, getting more daily deal users to come back a second time is also important for the promotion’s profitability, and even though this is difficult, merchants are advised to at least have a game plan in place to encourage that second visit. Not surprisingly, the non-redemption rate also contributes significantly to having a profitable daily deal promotion. However, two important points about non-redemption must be noted here. 13
- 14. First, non-redemption by daily deal users is usually not under the merchant’s control; there is little the business can do to influence this particular consumer behavior metric. Second, and more importantly, non-redemption by deal buyers runs counter to the main goal that most businesses have when running such promotions which is to gain exposure to as many new customers as possible. When deal buyers don’t redeem the deal, exposure is not achieved. Thus, even though they contribute to the daily deal’s profitability, high non-redemption rates are not helpful in attaining the broader marketing objectives of businesses. Interestingly, how long the business had been in operation is also a positive predictor indicating that older, more established businesses had greater incidence of profitable deals. This is a practically significant result, running counter to the conventional wisdom and emerging evidence that has been provided elsewhere that daily deal promotions are the most effective for start-up businesses. What is also interesting about the results displayed in Table 2 is which factors do not influence daily deal profitability. None of the spending variables have significant effects on profitability, suggesting that the proportions of new and repeat users are more important than how much these customers spend on average. Notably, neither the proportion of those who spend beyond the deal’s value nor the average amount they spend appears to matter in affecting the deal’s profitability. All of the daily deal site dummy variables are also insignificant predictors indicating that the predictors of each daily deal site are comparable with Groupon. Finally, business size (as measured by its annual revenue) was not a significant predictor, indicating that daily deal promotions may be profitable (or unprofitable) for businesses of any size. To provide potentially useful benchmarks for businesses considering daily deal promotions, we also compared differences in the seven consumer behavior metrics for businesses that reported having profitable (made money) and unprofitable (lost money) promotions. Figure 2 graphically depicts the averages for the two groups. 14
- 15. FIGURE 2. Customer behavior metrics for firms with profitable and unprofitable promotions $73.5 Avg. spending by repeat customers $77.2 $74.5 Avg. spending beyond deal value $41.3 $72.4 Avg. spending by new customers $60.9 23.4%* % unredeemed deals 17.1% Made money 24.1%* Lost money % repeat buyers 15.0% 39.6%* % spending beyond deal value 29.5% 82.6%* % new customers 74.4% 0.0 10.0 20.0 30.0 40.0 50.0 60.0 70.0 80.0 90.0 *indicates a statistically significant difference at the p = .05 level of significance All four percentage metrics – % new customers, % spending beyond deal value, % repeat buyers, and % unredeemed deals – have statistically significant differences between those who made money and those who lost money from the daily deal, but none of the three spending variables did. These results further support the earlier conclusion that to have a profitable daily deal promotion, businesses may be better off focusing on the percentages of daily deal users in the different consumer behavior categories rather than on their spending levels in these categories. Although not shown in Figure 2, businesses which made money sold numerically fewer deals (N = 885) when compared to those who lost money (N = 948), but note this difference is not statistically significant. Thus, we can conclude that total number of deals sold is not diagnostic of whether the merchant makes or loses money on the daily deal promotion. Which deal characteristics drive daily deal profitability? When conducting a daily deal, the merchant usually collaborates with the daily deal site’s salesperson to determine the terms of the deal’s offer. Deal characteristics that have to be chosen 15
- 16. include its face value (e.g., $50 worth of items), percent discount off face value (e.g., 50% off, so that the customer pays only $25), the amount of time buyers will be given to redeem the deal voucher prior to its expiration, commonly known as the redemption duration, and whether to place an upper limit on the number of deals sold, and if yes, what that should be16. All of these deal characteristics are decision variables for the business decision maker. But which of them impact the deal’s profitability and how? To find out, we conducted a multiple regression analysis with these deal characteristics as predictors of the deal’s profitability. For control purposes, we included age of the business, its annual revenue, and time in days elapsed since the promotion ran. This last variable was included to determine if there was any systematic change in profitability of daily deals over time17. The results of this analysis are provided in Table 3. As can be seen, three of the four deal characteristics are significant predictors of its profitability. First, the deal’s face value is a positive predictor, indicating that offering deals with higher face value increases the possibility of having a profitable promotion. Second, we also find that placing an upper limit on the number of daily deal vouchers sold contributes positively to incidence of deal profitability. In our dataset, the average maximum limit placed by merchants on deal vouchers sold (in cases where they did so) was 1,000 daily deals, and the median was 709. But only 11% of the deals had such stipulated maximums. Third, redemption duration is a negative predictor of deal profitability, pointing to the need to have shorter redemption durations. 16 There are a large number of academic papers investigating effects of these deal characteristics. For example, see Alba, Joseph W., Carl F. Mela, Terence A. Shimp, and Joel E. Urbany (1999), “The Effect of Discount Frequency and Depth of Consumer Price Judgments,” Journal of Consumer Research, 26(2), 99-114; Bawa, Kapil, and Robert W. Shoemaker (1987), “The Effect of a Direct-Mail Coupon on Brand Choice Behavior,” Journal of Marketing Research, 24(November), 370-376; Inman, J. Jeffrey and Leigh McAlister (1994), “Do Coupon Expiration Dates Affect Consumer Behavior?” Journal of Marketing Research, 31(3), 423-428; Kalwani, Manohar U., and Chi Kin Yim (1992), “Consumer Price and Promotion Expectations: An Experimental Study,” Journal of Marketing Research, 29(1), 90-100; Krishna, Aradhna and Z. John Zhang (1999), “Short- or Long-Duration Coupons: The Effect of the Expiration Date on the Profitability of Coupon Promotions,” Management Science, 45(8), 1041-1056; and Raghubir, Priya, J. Jeffrey Inman, and Hans Grande (2004), “The Three Faces of Price Promotions,” California Management Review, 46(Summer), 23-42. 17 We also included dummy variables for each of the daily deal sites (with Groupon serving as the reference category). None of the coefficients emerged as significant, indicating that the results reported in Table 3 hold across all five daily deal sites included in the study. 16
- 17. Interestingly, the percent discount off regular price did not impact deal profitability significantly, raising questions regarding the practice of offering deep discounts to consumers in such promotions. None of the control variables were significant predictors of the deal’s profitability. TABLE 3: Regression of daily deal profitabiliya on deal characteristics Variable Standardized t-value p-value Regression Coefficient Daily deal face value .16 1.97** .05 % discount off regular price .01 .14 .89 Redemption duration -.17 -2.05** .04 Whether upper limit placed on .18 2.24** .02 number of daily deals sold Age of business .08 1.00 .31 Annual revenue of business -.08 -.91 .36 Time since the daily deal appeared -.04 -.42 .68 in days a Dependent variable is profitability of the daily deal promotion reported by respondents; **indicates statistically significant coefficient at the p=.05 level of significance; *indicates statistically significant coefficient at the p = .10 level of significance These findings provide clear and specific guidance to small and medium-sized businesses regarding how they should set the terms when running a daily deal to increase their likelihood of having a profitable promotion: Offer a daily deal of relatively high face value ($50 or more), with a shallow discount (at most 25% off face value), a short redemption period (three months or less), and place a maximum limit of 1,000 on number of daily deal vouchers that consumers can buy18. 18 The optimal limit on number of vouchers to sell would depend on the merchant’s size and capacity. Obviously, a single massage therapist would need to set a much lower limit than a ten-store salon & spa chain. 17
- 18. Repeating a daily deal promotion in the future A crucial question for daily deal site operators is the extent to which businesses, having run one daily deal promotion, want to run another such promotion in the future. More than the profitability measure, repeat use intentions of merchants regarding daily deals provide insights into the sustainability of the daily deal business model and the future of the industry as a whole. Prior academic research on customer satisfaction and loyalty suggests that businesses having profitable daily deals should be significantly more likely to run another such promotion in the future than those who lose money on the promotion19. To measure repeat use intentions, we asked survey respondents “Will you run another daily deal promotion in the future?” and respondents could choose one of “Yes”, “No” or “Unsure” as responses. Figure 3 provides the responses for the full sample as well as for each daily deal site. FIGURE 3. Intentions to run another daily deal promotion by daily deal site 70% Yes No 60% 58.3% Unsure 51.4% 52.3% 50% 48.1% 42.3% 40% 36.8% 36.8% 32.1% 31.8% 30.8% 30% 27.8% 26.9% 26.3% 25.0% 20.8% 19.8% 20% 15.9% 16.7% 10% 0% Full Sample Groupon LivingSocial OpenTable Travelzoo BuyWithMe 19 For a detailed discussion of this research, see Johnson, Michael D. and Anders Gustafsson (2000), Improving customer satisfaction, loyalty, and profit: An integrated measurement and management system. San Francisco: Jossey-Bass. 18
- 19. As can be seen from Figure 3, for the full sample, just under half of the respondents (or 48.1%) indicated they would run another daily deal promotion again, about a fifth (or 19.8%) said they would not, and approximately a third (or 32.1%) said they were unsure whether they would do so. Again, these results are consistent with those obtained in the September 2010 study. Comparing responses for the various sites, OpenTable had significantly fewer “Yes” responses and more “Unsure” responses compared to the other sites. None of the other differences between the daily deal sites were statistically significant. These numbers continue to raise serious questions from the standpoint of future sustainability and growth of the daily deal promotion industry. Any industry which is able to convert less than half of the customers who try its services into certain second-time buyers (i.e., those saying yes, they will run another daily deal) is likely to run into trouble finding enough customers (in this case, merchants) to sustain itself at some point in the near future. Does deal profitability impact the merchant’s intentions to run another daily deal promotion? We also examined whether daily deal promotion profitability impacts the merchant’s intentions to run a daily deal again, and found a very strong effect. Figure 4 summarizes merchant decisions to run another promotion (or not) based on whether they made money, broke even, or lost money on their current daily deal promotion. The results show that whereas over 95% of businesses which made money intend to run another daily deal promotion, less than a quarter (or 23.6%) of businesses which lost money on the promotion will run another one in the future. Not surprisingly, it appears that daily deal profitability is a crucial criterion of the merchant’s future interest in daily deal promotions. Thus, whether or not its profitability, measured after the promotion is complete, is the right measure of the daily deal’s value for achieving the merchant’s marketing objectives, most of the surveyed merchants seem to be using it as a key input into their decision making regarding whether to run daily deals again in the future. 19
- 20. FIGURE 4. Intentions to run another daily deal by profitability of first promotion 120% Will run another daily deal promotion 100% 95.8% Will not run another daily deal promotion 80% 76.4% 60% 58.8% 41.2% 40% 23.6% 20% 4.2% 0% Made money Broke even Lost money How loyal are merchants to a particular daily deal site? By now, most prominent merchants in markets throughout the United States have been approached by sales forces of numerous daily deal sites. As the manager of one restaurant told us, “I am bombarded weekly... it is to the point of annoying the amount of companies I am solicited...” Under such circumstances, how loyal are merchants to the daily deal site that they have run a daily deal with? To answer this question, we asked respondents to tell us whether they had considered or would consider a different daily deal site (than the one they had run the promotion with) for another daily deal promotion. Figure 5 summarizes the results. As can be seen, for the full sample, fully 72.8% of respondents indicated they had or would consider a different daily deal site for their next promotion. The percentages ranged from 66.7% for Groupon to 78.9% for LivingSocial, but there were no statistical differences between any of the sites on this measure. 20
- 21. FIGURE 5. % considering other daily deal site for their next promotion 80% 78.9% 78% 77.3% 76.5% 76% 75.0% 74% 72.8% 72% 70% 68% 66.7% 66% 64% 62% 60% Full Sample Groupon LivingSocial OpenTable Travelzoo BuyWithMe Verbatim comments provided by some respondents provide further insight into the thought processes of merchants: • “All are about the same. They collect 50% of the money raised and all they do is send out an email. We had to pay all the food and products used for the promotion.” – Restaurant owner, Atlanta. • “I’ve learned a lot and now can see that I can cherry pick who to work with to give me the cut and the percentage off that works for me.” – Bar owner, Los Angeles. • “...about the same. Not any real measurable differences [between Groupon and LivingSocial].” – Theater company marketing director. Close to three quarters of surveyed merchants evince no loyalty at all to the daily deal site where they have run a promotion. It appears that none of the daily deal sites have been very successful in differentiating themselves from others, or engendering significant loyalty among their respective merchant bases. We believe this finding has important practical implications for the daily deal industry’s future. Specifically, it raises the possibility that current levels of revenue-sharing (ranging from 30%, but more often as high as 50%) demanded by daily deal sites may be unsustainable and subject to erosion in the near future, as shrewd merchants play the salesperson of one site against the other in demanding more favorable terms for themselves before agreeing to run the next deal. Relatedly, the low merchant loyalty levels also suggest that 21
- 22. daily deal sites will have to keep spending significant amounts of money in marketing and sales costs even to re-sign merchants that they have done business with before, and to keep their pipeline of viable deals full, in addition to the expenditures for acquiring consumers. How do deal profitability and repeat use intentions vary by industry? The merchants included in this study belonged to a total of ten different industries20. Because of differences in industry-specific cost structures and variability in consumer behavior trends, there are likely to be systematic variations in how businesses in different industries fare with daily deal promotions. Figure 6 summarizes the percentage of businesses making money from the daily deal promotion and the percentage intending to run another daily deal in the future for each industry. FIGURE 6. % with profitable daily deals & % intending to run another daily deal by industry % intending to run another DD in future % making money on DD 42.9% Special events (42) 66.7% Tourism-related services (17) 64.7% 47.1% 58.3% Education services (12) 58.3% Health & fitness services 76.2% (42) 76.2% 50.0% Medical services (7) 66.7% Cleaning services (6) 66.7% 16.7% Auto Services (7) 57.1% 28.6% 47.6% Retail store (21) 57.1% 41.5% Salon & Spa (41) 53.7% 35.9% Restaurant/ Bar (78) 43.6% 0% 10% 20% 30% 40% 50% 60% 70% 80% 90% *The number in parentheses next to the industry name is the sample size for that particular industry available in our dataset. 20 The industries covered in this study include Restaurant/ bar, Salon & Spa, Retail store, Auto services, Cleaning services, Medical services, Health & fitness services, Education services, Tourism-related services, and Special events. 22
- 23. As can be seen, there are considerable differences for both metrics across industries. Where making money on the daily deal is concerned, firms providing health and fitness services are the most successful with 76.2% of them making money, followed by the special events industry (which includes concerts, shows, museum entrance for a special exhibit, etc.; 66.7%) and medical services (66.7%). The worst performers using the deal profitability metric are cleaning services (only 16.7% of them make money from the promotion) and automotive services (28.6%). Considering the ‘running another daily deal in the future’ metric, not surprisingly, respondents in the health and fitness services industry have the highest repeat intentions with 76.2% of respondents indicating that they will run another daily deal again. On the other hand, those in the restaurant/ bar and salon and spa industries have the lowest repeat use intentions among all the industries. Overall, restaurants/ bars are at the back of the pack, with less than half (43.6%) earning a profit from the daily deal promotion, and just over a third (35.9%) intending to run another daily deal promotion again in the future. Salons and spas have relatively greater incidence of profitability with 53.7% of them making money on the promotion, but only 41.5% of them intend to run another daily deal in the future. It is worth noting that the results for both industries found here are significantly lower than those obtained in the September 2010 study21. The present results are based on much larger samples and cover multiple daily deal sites. Since restaurants/ bars and salons and spas represent the bread-and-butter for daily deal site operators, these results raise another red flag by suggesting that deal profitability appears to have dropped over the eight months that elapsed between the two studies. These findings raise further questions regarding the continued availability of a sufficient pool of viable revenue-generating merchants from these two industries for daily deal sites. 21 In the September 2010 study, 58% of restaurants reported having profitable Groupon promotions, whereas 82% of salons and spas reported having profitable Groupon promotions. 23
- 24. Item daily deal promotions vs. dollar daily deal promotions A key decision that merchants must make when structuring their daily deal promotion is whether to offer consumers a dollar promotion or an item promotion. Examples of these two types of offers for the salon and spa industry are as follows: Item promotion: Get a one-hour facial and mani-pedi for $79 (Regular price = $150). Dollar promotion: Get $150 worth of beauty treatments for $79. Note that although both daily deals have exactly the same face value and offer the same discount, the key difference between the two is that a particular bundle of services is specified in the offer for the item daily deal, whereas the dollar daily deal gives discretion to the consumer regarding which products or services to buy. The strength of an item daily deal lies in the fact that it allows the merchant to offer deals on selected products or services that may be high- margin, outdated, hard-to-sell, etc., allowing specific marketing objectives to be set and met. However, on the flip side, when redeeming an item daily deal, consumers may simply purchase the product or service being offered, and leave, without buying anything else, thereby eliminating the possibility of spending beyond the deal value, or forming a relational bond with the merchant and returning in the future. Relative to a dollar daily deal, an item promotion is also more difficult for the merchant to design because of the additional thought and work involved in choosing which items to include in the offer. On balance, it is not clear which type of promotional offer – item or dollar – is superior for the merchant. Note that in our dataset, 64.8% of participants had run item daily deals and 35.2% were dollar daily deals. To find out which offer fares better for businesses, we compared the percentages of profitable daily deals and repeat intentions for businesses employing item and dollar promotions. In the analysis, we controlled for the deal’s face value, percentage discount offered, age of the business, and its annual revenue. Figure 7 summarizes the results, revealing that item daily deals outperformed dollar daily deals significantly for both measures. 24
- 25. FIGURE 7. % with profitable daily deals & % repeat intentions by type of daily deal 90% Item Daily Deal Dollar Daily Deal 79% 80% 70% 59% 58% 60% 50% 47% 40% 30% 20% 10% 0% % making money on DD % intending to run another DD in future Whereas only 47% of dollar promotions were profitable, 59% of item promotions made money for the business. Likewise, 58% of merchants running dollar promotions intended to run another daily deal in the future, whereas fully 79% of those running item promotions expressed such repeat intentions. The implications of these results for merchants are that they should try and structure their daily deal offer as an item promotion, carefully and thoughtfully choosing a particular product, service or bundle of offerings to be included in the daily deal based on their specific marketing and operational objectives. We also compared differences in the consumer behavior metrics for businesses that ran item and dollar daily deals. Figure 8 graphically summarizes the averages for the two groups. Interestingly, item daily deals bring in significantly more new customers (85.5% vs. 70.0%) but as expected, fewer deal users spend beyond the deal’s value in the case of item daily deals when compared to dollar daily deals (28.6% vs. 53.6%). What is interesting is that the item deal users who do spend beyond the deal value spend more than three times as much as dollar deal users ($78.5 vs. $24.2), and they continue to spend more on their repeat visit to the business ($83.7 vs. $51.0). These differences provide some insights into why item daily deals are more profitable than dollar daily deals for businesses. 25
- 26. FIGURE 8. Customer behavior metrics for businesses running item and dollar promotions $51.0* Avg. spending by repeat customers $83.7 $24.2* Avg. spending beyond deal value $78.5 $69.5 Avg. spending by new customers $67.1 18.8%* % unredeemed deals 24.4% Dollar Daily Deal 21.0% Item Daily Deal % repeat buyers 19.6% 53.6%* % spending beyond deal value 28.6% 70.0%* % new customers 85.5% 0.0 10.0 20.0 30.0 40.0 50.0 60.0 70.0 80.0 90.0 The impact of daily deal promotions on marketing spending of businesses Having examined various aspects of daily deal performance, we now turn to understanding how they have affected business spending on marketing programs. To this end, we first asked survey respondents what percentage of their annual firm’s revenues they spent on marketing programs in 2010. Figure 9 summarizes the results for the full sample and for each daily deal site. Across the full sample, results indicate that businesses spent 10.9% of their annual revenues on marketing programs, which translates to an average annual marketing budget of approximately $198,000 for the businesses in our sample22. Those running a Groupon daily deal reported spending the most, 12% of their annual revenues, whereas those running an OpenTable deal spent the least, 6.9%; however these differences are not statistically significant. 22 Note that this value represents the average for all the businesses in our sample. It is important to note that approximately a quarter of the small businesses in our sample have annual revenues of less than $500,000, and many of them spend little or no money on marketing programs. For such businesses, daily deals constitute the primary or even the only form of marketing program spending. 26
- 27. FIGURE 9. Marketing spending as percentage of annual revenues by daily deal site 14% 12.0% 11.9% 12% 10.9% 11.0% 10% 9.6% 8% 6.9% 6% 4% 2% 0% Full Sample Groupon LivingSocial OpenTable Travelzoo BuyWithMe How did they spend this money? Our survey respondents also told us how they allocated their marketing dollars across different marketing programs. Figure 10 summarizes the average percentages spent for various marketing programs. As can be seen, daily deals constitute the single-largest category of marketing spending, with businesses spending 23.5% of their annual marketing budget on daily deals, which translates to average annual spending on daily deal programs of $46,530 for our respondent sample. Email promotions (16.1% or $31,878) and online search advertising through programs such as Google AdSense are the next largest categories of marketing spending (respondents spent 14.7% of their marketing budget or $29,106 in 2010 on these programs). In contrast, the businesses in our sample spent relatively little for Yellow pages advertising (1.6%), TV advertising (1.8%) and Valpak coupons23 (2.1%). Overall, businesses spent money on a total of twelve different marketing programs. 23 Valpak is a direct marketing program in which local businesses can send coupons, flyers, postcards and/or promotional offers to consumers in targeted zip codes. Valpak describes itself as a “cooperative direct mail medium that contains a mix of ads from national, regional, and local advertisers.” (Accessed online on June 1, 2011 at http://www.valpak.com/advertise/products-services/cooperative-direct-mail/description.jsp). 27
- 28. FIGURE 10. Marketing spending by marketing program 25% 23.5% 20% 16.1% 15% 14.7% 10% 8.4% 8.8% 8.0% 8.0% 5% 4.6% 2.1% 2.4% 1.6% 1.8% 0% Yellow Direct Mail Val-pak Facebook Twitter Daily Radio TV Print Email Online Other Pages (e.g., Coupons Deals AdvertisingAdvertisingAdvertisingpromotions Search online Postcards) programs An equally important question is how their marketing spending for other programs has changed because of increased spending on daily deal promotions? Which marketing programs are affected adversely? These questions are relevant because virtually none of the businesses in our sample spent money on daily deal programs in 2009. To find out, we asked respondents to tell us specifically how their spending on daily deals impacted their spending for each of the other marketing programs over the past year. Using their responses, we computed percentage changes in spending for each marketing program from 2009 to 2010. Figure 11 summarizes the results. As can be seen in Figure 11 (below), all traditional marketing programs have all been impacted adversely to significant degrees by daily deal spending. The largest spending drops are in yellow pages, print advertising (e.g., in magazines and newspapers) and self-managed direct mail marketing. Spending on Yellow pages advertising was down 27.5%, print advertising was down 21.6% and self-managed direct mail was down 17.6%. Local radio and TV advertising also dropped substantially. Just as interesting, spending on email promotions and online search programs was up substantially (7.8% in each case) because of daily deal promotions, suggesting that these businesses may be using these marketing programs to drive consumers to their direct deals, and maintaining contact with them afterwards. 28
- 29. FIGURE 11. Change in marketing spending due to spending on daily deal programs 10% 7.8% 7.8% 5% 0.0% 0.0% 0% -5% -6.9% -10% -15% -13.7% -13.7% -14.7% -17.6% -20% -21.6% -25% -27.5% -30% Yellow Direct Mail Val-pak Facebook Twitter Radio TV Print Email Online Other Pages (e.g., Coupons AdvertisingAdvertisingAdvertising promotions Search online Postcards) programs These results indicate that by their spending decisions over the past year, the surveyed merchants have bought into the idea that daily deals are effective replacements for traditional advertising to gain exposure to consumers within their local markets. Viewing these marketing programs as substitutes, they have shifted their spending away from advertising towards daily deal promotions. Is this the right way to see daily deals and advertising? It is true that daily deals offer the business significant exposure to new consumers. In this sense, they perform the same important function that advertising does. However, one crucially important factor that daily deals and advertising starkly differ from one another on is in how they persuade the consumer to buy from the business. By and large, advertisements communicate specific benefits regarding the merchant’s products and services. For instance, a restaurant may emphasize its particular expertise in preparing tasty seafood dishes in advertisements, and a cleaning service may advertise that it uses eco-friendly products through advertising. Such messages not only differentiate the business from its competitors and attract consumers who value these particular attributes, but they also give consumers persuasive benefit-driven reasons to buy from the business (instead of from other sources). In contrast, most consumers buy a 29
- 30. daily deal primarily because they are getting a “steal of a deal,”; benefits offered by the merchant’s offerings take a back-seat. In fact, in many cases, consumers may not even particularly care which restaurant or cleaning service they are buying the deal voucher for, just the fact that it’s significantly cheaper than market prices. To summarize, a daily deal does accomplish exposure, but it draws in consumers to the business for the wrong reason: not because the business sells something the consumer truly wants or is interested in, but because the business is selling it at a very low price. Coupled with the escalating number of deals available to consumers within a given product category at any one time, the chances of any future loyalty or relational behavior become even smaller, as our results indicated. Thus, it is our view that advertising and daily deals are not substitutes; although both provide exposure to a local customer base, each program does so in a starkly different way, attracting largely different types of consumers to the business for different reasons. Limitations of this study As with any such study, the present study has a number of limitations. First, although we cast a wide net covering 23 different US markets, ten different industries and 1,200 businesses that had run daily deal sites with Groupon, LivingSocial, Travelzoo, OpenTable, and BuyWithMe, the fact remains that the study sample is still a convenience sample. Because of our inability to access the entire population of daily deal promotions from any of the sites, we could not use a sampling methodology to obtain a representative sample of businesses running daily deals. As such, we make no claims that these results can be extrapolated to the population of US businesses running daily deal promotions as a whole. Nevertheless, the consistency of the results across the daily deal sites, and with the September 2010 sample of businesses running Groupon promotions lends confidence in their validity. Second, because this is a survey-based study, our results are susceptible to a non-response bias, which is the possibility that non-respondents to our survey were systematically different from those that participated in it. Note however that the 30
- 31. response rate we obtained was 27%, which is in line with published results24. Third, the survey- based methodology also means that all performance metrics are assessed based on self-reports provided by business decision makers. Such information is based on subjective assessments of respondents and may be inaccurate in reflecting actual customer behaviors. Nevertheless, since these individuals will make future decisions regarding daily deal promotions, it can be argued that their assessments, even though subjective, are what matters. Finally, we note that our samples for BuyWithMe, Travelzoo and OpenTable are quite small; so the results for these sites should be seen as exploratory. Conclusion Taken together, the findings of this study lead us to conclude that there are relatively few points of differentiation between the daily deal sites covered in the study, making it harder for any one site to stand out from the others. Our findings also uncovered a number of red flags regarding the industry as a whole: (1) the relatively low percentages of deal users spending beyond the deal value (35.9%) and returning for a full-price purchase (19.9%) are symptomatic of a structural weakness in the daily deal business model, (2) less than half of the businesses indicated enthusiasm about running another daily deal in the future, (3) fully 72.8% indicated openness to considering a different daily deal site for another promotion, and (4) only 35.9% of restaurants/ bars and 41.5% of salons and spas that had run a daily deal asserted they would run another such promotion in the future. All of these findings point to the same conclusion: Over the next few years, it is likely that daily deal sites will have to settle for lower shares of revenues from businesses compared to their current levels, and it will be harder and more expensive for them to keep finding viable candidates to fill their pipelines of daily deals. 24 Deutskens, Elisabeth, Ko de Ruyter, Martin Wetzels, and Paul Oosterveld (2004), “Response rate and response quality of internet-based surveys: An experimental study,” Marketing Letters, 15(1), 21-36. For examples of published research with lower response rates, see O’Sullivan, Don and Andrew V. Abela (2007), “Marketing performance measurement ability and firm performance,” Journal of Marketing, 71(April), 79-93; or Palmatier, Robert W. (2008), “Interfirm relational drivers of customer value,” Journal of Marketing, 72(4), 76-89. 31