VaLUENTiS Talent Mgt & Leadership Development Conference pres221013 final - dist
•
2 gefällt mir•1,061 views

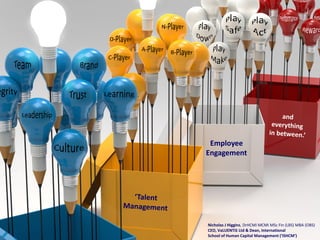
Recent workshop presentation including exercises on talent management and employee engagement introducing the Management Pathfinder case studies

Empfohlen
Weitere ähnliche Inhalte
Was ist angesagt?
Was ist angesagt? (20)
Andere mochten auch
Andere mochten auch (8)
Ähnlich wie VaLUENTiS Talent Mgt & Leadership Development Conference pres221013 final - dist
Ähnlich wie VaLUENTiS Talent Mgt & Leadership Development Conference pres221013 final - dist (20)
Mehr von njhceo01
Mehr von njhceo01 (9)
Kürzlich hochgeladen
Kürzlich hochgeladen (20)
VaLUENTiS Talent Mgt & Leadership Development Conference pres221013 final - dist
- 1. Employee Engagement Nicholas J Higgins, DrHCMI MCMI MSc Fin (LBS) MBA (OBS) CEO, VaLUENTiS Ltd & Dean, International School of Human Capital Management (‘ISHCM’)
- 2. This version is for print distribution and certain slides from the workshop presentation have been omitted or amended. All rights reserved. No part of this presentation may be reproduced, translated, stored in a retrieval system or transmitted in any form or by any means, electronic, mechanical, photocopying, microfilming recording or otherwise without the express permission of the author. Please e-mail nicholas.higgins@valuentis.com regarding any matters of reproduction/ organisational distribution. © 2013
- 4. Our mission “As evidence-based management practitioners, our purpose is to enhance effective people management (and its impact on productivity/performance) in organisations, whilst enabling greater individual managerial professionalism.”
- 10. The traditional view of employee engagement contributing to improved organisational performance... Higher employee engagement Higher productivity Higher organisation performance
- 11. “Employee engagement is an ‘outcome-based’ concept. It is the term used to describe the degree to which employees can be ascribed as ‘aligned’ and ‘committed’ to an organisation such that they are at their most productive.” VaLUENTiS International School of HCM 2005
- 12. Human capital management practice and employee engagement contributing to improved organisational performance (‘POP’ system) More effective human capital management Higher productivity Higher employee engagement Higher organisation performance
- 13. “Human Capital Management is the term which is used to describe an organisation’s multidisciplined and integrated approach to optimising the capabilities and performance of its management and employees.” VaLUENTiS International School of HCM 2005
- 14. Impaired Employee Engagement: Impact on individual and team productivity/performance Sub-optimal performance, i.e. less than achievable Or Sub-optimal costs, i.e. higher than necessary Or Both
- 15. Organisations and employee engagement: The ‘4-ball’ practice model ‘We don’t...’ ‘It’s all about PR…’ Play down Play act ‘At least we audit/ benchmark...’ Play safe ‘We do it…’ Play make The four progressive states of employee engagement embeddedness in organisations
- 16. The ‘Six Pillars’… 1. Grounded understanding of Employee Engagement 2. Working definition of Employee Engagement 3. Measurement wisdom 4. Actioning infrastructure EE PLAYBOOK DELETE 5. Dynamic EE-Performance ‘playbook’ 6. Competent leadership/management
- 17. The ‘4-ball’ Employee Engagement reality matrix ‘PLAY DOWN’ Pillar ‘PLAY ACT’ ‘PLAY SAFE’ ‘PLAY MAKE’ Little. Limited. Mostly ephemeral in nature. Exists in pockets with variation in line management. Good working knowledge embedded across organisation. Maybe borrowed with internalisation or adapted after some organisational focus. Distributed ‘ownership’, whether borrowed, adapted or created. I Grounded understanding of employee engagement II Working definition of employee engagement No definition in use. Most likely borrowed without any real ownership, or ‘false’ ownership. III Measurement wisdom Limited to absenteeism metrics, employee surveys seen as event driven if done. Probably undertaking surveys but with no valid construct; response rate/PR main focus. Will do measurement basics, even to the extent of engagement index etc. Tick box is main focus. People management evaluation/measurement seen as ‘core’ on a par with CRM , finance etc. IV Actioning Infrastructure Probably in the form of basic training/management courses. Probably in the form of basic management courses. Most likely carry out some form of branded programme. Will have a number of actioning elements in place but not necessarily joined up. Will have necessary ‘toolkit’ to hand with ongoing programmes to suit organisation focus. Does not exist. May have something articulated on ‘strategies’. Most likely collection of irrelevant case studies. Playbook in the form of ‘manager manual’ or on-line knowledge-share. Still being developed. Easy access in different e/physical formats at different levels. Signals ‘embedded’ intent. Will have varied mix of skilled people managers. Existing good performers more through luck. Will have varied mix of skilled people managers. Existing good performers more through luck. Will have varied mix of skilled people managers but level of competency higher than Play-Act organisations. Cohort of well-trained people managers exists with talent pools. Regular evaluation/reinforcement. NEGATIVE NEGATIVE NEUTRAL POSITIVE V VI EE-Performance Playbook Competent leadership/ management Overall value to organisation performance/competitive advantage 17
- 19. VaLUENTiS 5D Employee Engagement Framework Line-of-Sight Work Environment Objectives awareness Cultural elements Behaviour alignment Role ‘fit’ Performance management Feedback Team dynamics Organisation operating culture Capability Remuneration equity Bonus/incentives Benefits Role equity Recognition Promotional aspects Reward (equity) © VaLUENTiS Ltd 2002-13 Communication Resources Local management Physical environment Organisation design Performance/talent management ‘Corporate’ Leadership Communication Decision rights Work values Trust Career progression Competencies Succession planning Job/ Role architecture Training/ Learning Coaching/ Mentoring Development
- 20. The concept of Employee Engagement: A synthesis of antecedent theories and empirical evidence with human capital management practice related to organisation performance – 100 years in the making •Leadership theory •Decision-making theory •Organisational ‘fit’ theory •Organisation performance & measurement* •High performance work systems •Conflict theory •Commitment theory •Trust theory •Goal setting and task theory •Teams theory •Group theory Human Capital Management practice/systems: •Talent management •Expectancy theory •Equity (justice) theory •Performance management •Motivation theory •Reward & recognition •Job satisfaction Immediate Team Individual •Needs theory •Trait theory •Employer brand Wider Group Organisation •Human capital retention •Resourcing & selection •Training & Development •Social cognitive/ self efficacy theory •Workforce diversity •Psychological contract •Leadership •Organisation Citizenship Behaviour •Organisation design •Taylor - Scientific management •Emotional Intelligence •Organisation communication •Munsterberg - Industrial psychology •Behaviourism •Organisation culture •Fayol - Principles of management •Cognitive dissonance •Learning theory •Follett - Management relations/integration •Wellbeing/Burnout •Other I/O psychology contributions •Mayo/Hawthorne studies •Lewin (MIT) - group dynamics/behaviour •Likert – Management system/measurement scale •Tavistock – Socio-technical systems •McGregor Theory X/Y •Hertzberg – Two factor theory •Drucker – Practice of management Source: The antecedents of Employee Engagement, Nicholas J Higgins - VaLUENTiS technical paper 2003 •Kahn – Personal engagement
- 21. The concept of Employee Engagement: A synthesis of antecedent theories and empirical evidence with human capital management practice related to organisation performance – 100 years in the making •Leadership theory •Decision-making theory •Organisational ‘fit’ theory •Organisation performance & measurement* •High performance work systems •Conflict theory •Commitment theory •Trust theory •Goal setting and task theory •Teams theory •Group theory Human Capital Management practice/systems: •Talent management •Expectancy theory •Equity (justice) theory •Performance management •Motivation theory •Reward & recognition •Job satisfaction Immediate Team Individual •Needs theory •Trait theory •Employer brand Wider Group Organisation •Human capital retention •Resourcing & selection •Training & Development •Social cognitive/ self efficacy theory •Workforce diversity •Psychological contract •Leadership •Organisation Citizenship Behaviour •Organisation design •Taylor - Scientific management •Emotional Intelligence •Organisation communication •Munsterberg - Industrial psychology •Behaviourism •Organisation culture •Fayol - Principles of management •Cognitive dissonance •Learning theory •Follett - Management relations/integration •Wellbeing/Burnout •Other I/O psychology contributions •Mayo/Hawthorne studies •Lewin (MIT) - group dynamics/behaviour •Likert – Management system/measurement scale •Tavistock – Socio-technical systems •McGregor Theory X/Y •Hertzberg – Two factor theory •Drucker – Practice of management Source: The antecedents of Employee Engagement, Nicholas J Higgins - VaLUENTiS technical paper 2003 •Kahn – Personal engagement
- 23. Management Pathfinder ‘one-line descriptors’ [Reference] Leadership [F1] The perceived effectiveness of overall management within the organisation collectively at each level Employer Brand [E1] The degree to which the organisation has an identifiable brand and its contribution/effectiveness in related organisational areas Talent Management [F2] The effectiveness of current organisational approaches to talent, its scope and its management Diversity [E2] The focus and effectiveness of diversity of the workforce and diversity policies within the organisation Performance Orientation [F3] The degree to which the organisation is viewed as effective in terms of focus and actions re performance related areas Learning & Development [E3] The degree to which current approaches and application of training, learning and development are effective Resourcing [V1] The effectiveness of current resourcing policies and processes/activities in terms of organisation requirements Organisation Climate [S1] The degree to which the current operating environment with in the organisation is seen to be a positive/negative factor Retention [V2] The effectiveness of current organisational retention approaches and efforts Organisation Communications [S2] The current effectiveness of communications in the organisation as perceived by managers and employees across all levels Reward [V3] The effectiveness of current reward policy/strategy across all levels of the organisation Organisation Design [S3] The degree to which the overall organisation architecture, e.g. management structure, job/role design is effective HR Governance [H1] [expanded version only] The overarching management of HR as a function governance of Human Capital Management within the organisation. Employee Centricity [legacy indicator] optional reporting indicator The degree to which the organisation has ‘employee-centric’ policies in place and delivers on them in terms of effectiveness including historical perspective HR Operational Excellence [H2] [expanded version only] The degree to which the HR function possesses the requisite competence and executes its delivery objectives in terms of quality and effectiveness
- 24. VaLUENTiS Management Pathfinder®: Client example (extended version) LEARNING & DEVELOPMENT TALENT MANAGEMENT DIVERSITY EMPLOYEE CENTRICITY 813 REWARD EMPLOYER BRAND 674 599 416 657 RETENTION 615 742 HR GOVERNANCE 431 684 487 HR OPERATIONAL EXCELLENCE 642 RESOURCING 603 594 628 ‘Out-performing’ (world class) ‘Out-performing’ (peer) ‘Comparable’ (peer) ‘Under-performing’ (peer) PERFORMANCE ORIENTATION LEADERSHIP 796 ORGANISATION DESIGN ORGANISATION COMMUNICATIONS ORGANISATION CLIMATE
- 26. Part II Welcome to the future…
- 29. Survey of people management practice • Line completions • HR completions • Aggregate perception and contrasted perception • Eight line-item answer categories HR/People metrics and activity volumes Spend data TRAINING & DIVERSITY DEVELOPMENT TALENT MANAGEMENT EMPLOYEE CENTRICITY 81.3 + EMPLOYER BRAND 67.4 + REWARD £ 59.9 41.6 65.7 RETENTION 61.5 74.2 68.4 48.7 HR OPERATIONAL EXCELLENCE 64.2 RESOURCING 60.3 + PERFORMANCE ORIENTATION HR GOVERNANCE 43.1 + 59.4 62.8 LEADERSHIP 79.6 + ORGANISATION DESIGN ORGANISATION COMMUNICATIONS ORGANISATION CLIMATE • HR spend • People management spend (e.g. recruiting, training) • Organisation spend/income • HR transaction levels • ‘People’ metrics • HR metrics • Existing survey re-cut for comparability to provide employee ‘checker’ against Line/ HR people management completions Existing employee survey data
- 30. Management Pathfinder projects include: • Derive HR strategy • Various analytics/modelling/benchmarking projects • Business case/mandate for HCM/OD intervention • Baseline evaluation for change initiative • Merger and acquisition • Workforce planning • HR function realignment • Baseline and evaluation of MD programme • Improve HR function’s professional standing • HR spend/activity review • Management development itself • Accelerated initiation for new HR Director/new team
- 31. Sector benchmarks (for what it’s worth)… Private • Biotechnology • Business services • Chemicals • Construction • Distribution • Energy • Engineering • Facilities Management • Food Production • Financial services: o Insurance o Investment banking o Retail banking o Other • FMCG • Healthcare • Leisure • Manufacturing/Mining • Pharmaceutical • Professional service firms • Retail • Telecommunications • Transport • Utilities Public • Government: o Agency o Central o Local • NHS-Health • Higher Education • Police
- 33. TRAINING & DIVERSITY DEVELOPMENT TALENT MANAGEMENT REWARD 686 683 650 558 392 HR GOVERNANCE 393 621 481 582 401 633 PERFORMANCE ORIENTATION 660 479 398 405 RESOURCING736 EMPLOYER 724 BRAND 492 594 597 627 584 544 795 RETENTION EMPLOYEE CENTRICITY HR OPERATIONAL EXCELLENCE 686 640 561 613 LEADERSHIP 751 703 ORGANISATION ORGANISATION CLIMATE DESIGN ORGANISATION COMMUNICATIONS
- 34. Operational indicator review: Performance Orientation [example] Detail not available for distribution due to IP restrictions
- 35. Performance Orientation: Areas for enhancement [example] Detail not available for distribution due to IP restrictions
- 36. TM Action Priority Matrix Detail not available for distribution due to IP restrictions
- 37. Embedding good employee engagement practice: ‘Mapping the management reality’ Against embedding (Status quo OK) Let it happen (Ambivalent/ non-committal) Help it happen (qualified supportive) Individual Board members Senior managers Middle managers Line managers Supervisors/Team leaders Remember ‘actions speak louder than words…’ Make it happen (Actively championing)
- 38. Example of Employee Engagement structured module… LM Module: Employee Engagement Problem Solving Pre-module preparation Case study 2-hr ‘work’ sessions ½ day workshop Structured coaching/ work group CI CI CI Critical Incident CI CI CI Critical Minicase study Problem solving Incident Level 2 & 3 evaluation diagnostic Behavioural event journal Pre-course assessment questionnaire Post-course assessment questionnaire Level 2 Pre-course Post-course evaluation assessment assessment diagnostic questionnaire questionnaire 3-6 Months (typical timeframe) Employee benchmark data (time series set) Employee benchmark data (nominal set) 1 day workshop
- 39. Mapping employee engagement and organisation performance (example): Leadership Leadership & & governance governance Human Human Capital Capital Practices Practices Trust Shareholder performance value Employer Employer brand brand Work values Work values Safety Portfolio mix Line - of -sight Line - of -sight Development Development Reward Reward Clinicalselling X - treatment Staff Employee Engagement Engagement Work environment Work environment Individual/ Individual/ team team Productivity Productivity Patient focus Service Prompt service Portfolio mix Environment X - selling Community Service External External Value Value Proposition Proposition Patient Customer Satisfaction Satisfaction Quality of Revenue services Growth Patient Customer experience Loyalty Use of Resources Profitability Staff Employee Retention Retention ‘Local’ ‘Local’ Management Management Compliance Compliance Cost control Cost control Example ‘Macro’ model NHS version 1.20 © VaLUENTiS VBM Analytics methodology 2008-13
- 40. Human Capital Operating Statement Human Capital Productivity Statement PeopleFlow® Statement CONTRACTED RESOURCE OPERATING INCOME st ye 31 st ye ye 31st Dec 2012 Dec 2012 31st Dec 2011 31 Dec 2011 ye % Revenue (£000s) Total number of FTE days contracted in year 1,057,0 16 3,530,340 3,401,289 1,015,0 2 0 333,144 336,987 16,047 Total number of FTE vacation days taken in FTEs 16,352 year ye 31st Dec 2012 ye 31st Dec 2011 Revenue per FTE 64,641 3,193,353 3,068,145 TOTAL NUMBER OF CONTRACTED FTE % DAYS AVAILABLE No of full-time staff at start of year 14,011 13,865 OPERATING COSTS STAFFING Number of part time staff at start of year (FTE Total operating costs (£000s) WORK RESOURCE ADJUSTMENT eqv) 1,932 FTE days gained through recorded overtime People costs (£0 00s) Number of other at start of year (FTE eqv) 104 work (+) Human Capital Intensity (HCI) Full time equivalents (FTEs) at tart of s 16,047 FTE days lost to illness (-) year FTE days lost to work related illness/injury (-) OPERATING INCOME ATTRIBUTABLE FTE days lost to industrial action (-) TO HC (HCIR per FTE) STAFFING MOVEMENTdays recorded as lost under miscellaneous FTE (-) Number of FTEs recruited in period (+) 1,427 ACTUAL NUMBER OF CONTRACTED FTE Number of acquisitioned DAYSduring ED FTEs WORK period (+) - 1,491 904,371 61,932 532,181 175 18,431 2,773 249 % 3,233,069 Full time equivalents (FTEs) at end of year £192.96 £190.59 £2.37 HC Performance £ - % 3,110,442 8,1 76 217 2,314 740 £185.42 £182.90 76 6,254 £2.52 256 16,352 5.2 Mean age of workforce 34 Retirement population 5,391 £ 71.3 Sustaining + 2,954 691 6,879 68.5 17,740 16,047 71.0 35.06 BB-BB-R 7,342 53 69.2 HUMAN CAPITAL MANAGEMENT INDEX FTE ) HC LEVERAGE (HCIR /A PC per Mean tenure (years) 1,874 36,029 % 1,075 1,065 - STAFFING MISCELLANEOUS VB-HR Rating 167 £ 56 .96 1,874 Outplacement RELATED INDICES EMPLOYER-EMPLOYEE costs (£000s) Employee engagement index Employer Total index brand 38,041 763 996 Number of FTEs outsourced in period 464,317 2,816 1,427 Training & Development costs (£000s) HCI*Revenue or FTE day (optimal) Number of FTEs made redundant per outplaced 35 Recruitment costs (£000s) in period (-) HCI*Revenue per FTE day (actual) Number of FTE retirements inHealth &FTE day costs (£000s) period Safety differential 91 HCI*Revenue per (-) HR functional and related costs (£000s) (-) 815,094 65,371 5 8 .85 15,531 19,016 ANCILLARY PEOPLE COSTS (APC) Number of voluntaryPRODUCTIVITY period- ( -) leavers (FTE) in 63,253 17,919 32.26 5.3 34 5,304 BB-B-R Sustaining + %
- 41. Employee Engagement triangulation “Squaring the circle…” New (re)hire data Customer/client/ patient/citizen/ passenger data Performance appraisal data Social media data Employee/management survey data Critical incident data Case data Organisation event log data Other internal survey/assessment data Exit data
- 42. “To this - The Engagement-Performance Matrix” Performance area New (re)hire data Performance appraisal data Employee/manage ment survey data Case data Other internal survey/ assessment data “There is much that organisations can do for themselves” Exit data Organisation event log data Critical incident data Social media data Customer/client/ patient/citizen data ‘Hawthorne’ for the 21st Century organisation”
- 44. Organisation X Organisation Y Organisation Z Organisation R Summary slide only Refer to exercise pack Key: ‘Out-performing’ (world class) ‘Out-performing’ (peer) ‘Comparable’ (peer) ‘Under-performing’ (peer)
- 45. x-group observations Organisation X - observations Organisation Z - observations Organisation Y - observations Organisation R - observations
- 46. Executive summary (currently based on ‘headline’ preliminary findings):
- 48. HR as a portfolio of service & compliance activities Simplified Illustration High Value Add Corporate Governance Services Professional & Advisory Services Nature of Activity Employment Services Transaction Services Marginal Value Added Complexity of Interaction Low High
- 49. HR ORGANISATION RESOURCING GOVERNANCE DESIGN REWARD EMPLOYEE RELATIONS & COMMS EMPLOYEE HEALTH & SAFETY HRIS & MEASUREMENT 9.1 HRIS Strategy Human Capital Management Activity-Delivery map 1.3 HR Delivery Structure 1.4 HC Reporting 1.5 HR Capability 1.6 HR Policy 1.7 HR Performance/ Strategy Review/ Audit 1.8 Managing External Consultants/ Outsource Providers An HR roles Cr Dv Ds I L Pl Pr 4.1 Needs Assessment 5.1 Performance (Talent) Management Assessment 6.1 Total Reward Programme 7.1 Employee Communications 8.1 Risk Management/ Regulatory Compliance/ Security 3.2 Candidate Identification Services 4.2 General Training Design, Development and Delivery 5.2 Performance (Talent) Management Development 6.2 Wage And Salary Management 7.2 Benefits 8.2 Risk Assessment 2.3 Organisational Design/ Capability Planning – Global Level 3.3 Job Profile Services/ Requisition Processing 4.3 Training & Development Management 5.3 Performance Reviews 6.3 Bonus/Incentive/ Stock Options Compensation 2.4 Job Classification/ Evaluation 3.4 Candidate Selection 4.4 Technical/ Functional/ Policy & Procedure Training 5.4 Succession (Talent) Management 6.4 Senior/ Executive Compensation 2.5 Organisation Restructure/ Change/ Development 3.5 Temporary and Contractor Staffing 4.5 Employee Induction/ Orientation 2.6 Acquisition/ Divestiture/ Start-up Due Diligence/ Support 3.6 General Employment Services 4.6 Competencies/ Skills Model Development And Assessment 2.7 Managing External Consultants/ Outsource Providers 3.7 Relocation 4.7 Leadership/ Management Development 3.8 Outplacement Services 4.8 Executive Development 4.9 Career Development 5.9 Consulting To Line Managers On Performance Issues 3.10 Consulting Line Managers On Staffing Issues 1.2 HR Value Proposition 3.1 Workforce Planning 3.9 Employment Law Services 1.1 Employer brand Ad Cp 2.1 Organisational Design/ Capability Planning – BU Level PERFORMANCE TRAINING & (TALENT) DEVELOPMENT MANAGEMENT 4.10 Consulting On Managerial Issues 5.10 Managing ASP/ERP/ Software Providers 3.11 Managing ASP/software/ Outsource Providers 4.11 Managing ASP/ERP/ software/ Outsource Providers 2.2 Organisational Design/ Capability Planning – Multi-country Level 5.5 Attendance Management 6.5 Expatriate Compensation 7.3 Attendance/ Leave Of Absence/ Exit Interviews 7.4 Return-To-Work and Job Accommodation 7.5 Company Policies And Procedures 9.2 HRIS Planning PAYROLL 10.1 Payroll 10.2 Employee/ Manager Interaction/ Problem Resolution 8.3 Accident Prevention and Training Programmes 9.3 HRIS Support 8.4 Health/Medical Programmes 9.4 Employee Research & Modelling 10.4 Special Pay, Adjustments And Deductions 8.5 Incident Tracking and Reporting 9.5 Benchmarking 10.5 Payroll Accounting/ Recon/ Manual Calculations & Disbursement 8.6 Managing External Consultants/ Outsource Providers 9.6 Measurement and Reporting Corp Centre Centres of Excellence 10.6 Tax Reporting/ Audit 9.7 Employee Records/Case management/Data Maintenance DELIVERY CHANNELS 10.7 Employee Reimbursement 10.3 Time Reporting 6.6 Compensation Analysis/Pay review 7.6 Collective Bargaining/ Negotiating/ Consultative Processes 5.7 Employee Counselling/ Case management 6.7 Healthcare/ Welfare/ Statutory/ Other Benefit Programmes 7.7 Work Practices For Represented Employees 5.8 PM Compliance Support 6.8 Pension Management 7.8 Conflict and Issue Resolution 9.8 Reporting/ Interfaces 9.9 Managing ASP/software/ Outsource Providers Service Centre (Shared) HR Field Manager 10.8 Statutory Benefits/ Miscellaneous Admin 7.9 Corporate/ Community Social Responsibility Business Partner 10.9 Reporting/ Interfaces 5.6 Employee Coaching 6.9 Retirement Planning/ Counselling And Administration 6.10 Managing External Consultants/ Outsource Providers 7.10 Government/ Legislative Issues 7.11 Managing External Consultants Line Manager 10.10 Managing Outsource Providers Global HR Profiler™ © VaLUENTiS 2003-13
- 52. Index score (HR only): 639 Index score (Line only): 606 TRAINING & DEVELOPMENT TALENT MANAGEMENT +57 DIVERSITY +25 +30 +33 REWARD RETENTION RESOURCING EMPLOYEE CENTRICITY EMPLOYER BRAND +21 +14 +32 +51 +49 +42 HR OPERATIONAL EXCELLENCE +12 +29 PERFORMANCE ORIENTATION HR GOVERNANCE +26 ORGANISATION DESIGN +62 ORGANISATION COMMUNICATIONS +18 LEADERSHIP ORGANISATION CLIMATE Client Index score: 620 (Max of 1,000)
- 53. HR and Line congruency (or not!) Disagreement 1 2 1. Key stakeholders have been involved in helping to shape objectives and targets for people management work 2. Does HR utilise aspects of marketing in promoting the function/its services? 3. HR systems are consistent across global/regional/country areas; such as compensation, benefits, performance management, career progression, talent management etc 4. There is a recognised process for reviewing performance against the objectives and targets contained in the HR strategy 5. The recruiting process is consistent across the organisation 6. [HR capability in] new employee and employee exit administration 7. The organisation does a good job of providing opportunities for personal development (for example, project assignments, lateral transfers) 8. Recruiting efforts are specifically designed to support the organisation's business plan 9. The organisation evaluates the effectiveness of training people receive 10. Managers use available workforce data effectively when making decisions Mean HR responses Mean Line responses 3 Agreement 4 5 6 7 8
- 56. Now a REALITY to measure/map this in (quasi) real-time More effective human capital management Higher productivity Higher employee engagement Higher organisation performance
- 57. When leading edge means leading edge… HCM Intelligence – ‘The Full Monty’ HC Measurement & evaluation Human capital reporting HC Productivity Statement CONTRACTED RESOURCE Total number of FTE days contracted in year Total number of FTE vacation days taken in year TOTAL NUMBER OF CONTRACTED FTE DAYS AVAILABLE VB-HR™ Rating FTE days gained through recorded overtime work (+) FTE days lost to illness (-) R B B RR R FTE days lost to work-related illness/injury (-) Overall ranking r 3,401,289 336,987 •Absenteeism •Turnover (voluntary) •Turnover (involuntary) •Recruitment cost per FTE •Time to fill •Training days per FTE •Training spend per FTE •Revenue per FTE •Profit per FTE •HR FTE: FTE •Employee costs per FTE •HR costs per FTE •% females in senior management roles 333,144 3,068,145 WORK RESOURCE ADJUSTMENT rmin FTE days lost to industrial action (-) 61,932 (-) Revenue (£000s) RRR FTEs HR Strategy ACTUAL NUMBER OF CONTRACTED FTE DAYS WORKED PeopleFlow® Statement Revenue per FTE 65,371 18,431 19,016 2,773 2,816 ye 31st Dec 249 2005 OPERATING INCOME as lost under miscellaneous FTE days recorded ye 31st 167 2004 Dec % 763 1,075 1,057,016 1,015,020 16,352 16,047 3,233,069 3,110,442 64,641 63,253 PRODUCTIVITY B B HR Functional Capital R BB OrganisationalHCM Capital Human Capital CCC CCC R HR Procurement HCI*Revenue per OPERATING COSTS FTE day (optimal) £192.96 £185.42 HCI*Revenue per FTE day Total operating costs (£000s) (actual) £190.59 904,371 £182.90 815,094 People HCI*Revenue per FTE day differential costs (£000s) STAFFING Human Capital Intensity (HCI) 532,181£2.37 ye 31 st Dec 2005 58.85 % £2.52 464,317 ye 31 st Dec 2004 56.96 Employee engagement index No of full-time staff at start of year OPERATING INCOME ATTRIBUTABLE Employer brand index TO Number of part-time staff at start of year (FTE HC (HCIR per FTE) eqv) 69.2 14,011 71.3 38,041 1,932 EMPLOYER-EMPLOYEE RELATED INDICES Number of other at start of year (FTEINDEX HUMAN CAPITAL MANAGEMENT eqv) BB BB BB CCC CCC R B CCC R Workforce Intelligence HCM Architecture BB B B BB R B CCC R Management B B R Employees HR Capability BB R B EFFECTIVENESS B R HR Customeragency MAINTENANCE £ 104 BB-BB-R 16,047 RISK 175 £ BB-B-R 15,531 Basic metrics % Sustaining + ANCILLARY PEOPLE COSTS (APC) Training & Development costs (£000s) STAFFING MOVEMENT 8,176 2,314 1,427 Number of acquisitioned FTEs Health & Safety costs (£000s) during period (+) HR functional and related costs (£000s) Number of costs (£000s) Outplacement voluntary leavers (FTE) in period (-) Number of FTEs made redundant or outplaced in period (-) Total Number of FTE retirements in period (-) Number of FTEs outsourced in period (-) HC LEVERAGE (HCIR/APC per FTE) Full time equivalents (FTEs) at end of year 740 % - 6,254 1,427 256 996 35 17,740 35.06 5.2% 8.6% 1.8% £12,569 38 days 3.5 £871 £365,121 £67,119 1:112 £27,469 £1356 23% •VB-HR™ Rating •HC Performance •HC leverage •HCIR per FTE •HC Investment ratio •Employee engagement •Voluntary turnover1 •Absenteeism1 •Accident/injury rate 68.5 13,865 71.0 36,029 1,491 % Sustaining + Number of FTEs recruited Recruitment costs (£000s) in period (+) BB BB FullVB-HR equivalents (FTEs) at start of time Rating year Performance HC Measurement pyramid ye 31st Dec 2004 3,530,340 Human Capital Operating Statement Human Capital Management AAA AA A BBB BB B CCC CC C ye 31st Dec 2005 3,193,353 91 - 16,352 7,342 £ % 1,874 2,954 - 691 1,874 6,879 •HR spend per FTE (adjusted using standard template) •Formal job offer success Plus portfolio of tertiary indicators which are more context/organisation specific 1,065 53 Employee engagement •HCI (used with revenue per FTE to calculate HCIR per FTE) •HR budget (adjusted using standard template) •MD spend •Internal/external management position fill ratio •No of industrial tribunals •% union membership •HR service delivery (IT mix) Plus portfolio of tertiary indicators which are more context/organisation specific 217 17,919 76 32.26 16,047 STAFFING MISCELLANEOUS Mean tenure (years) 5.2 5.3 Mean age of workforce 1.1 Employer brand 1.2 HR Value Proposition 1.3 HR Delivery Structure 1.4 HC Reporting 1.5 HR Capability 1.6 HR Policy 1.7 HR Performance/ Strategy Review/ Audit 1.8 Managing External Consultants/ Outsource Providers 2.1 Organisationa l Design/ Capability Planning – Business Unit Level 4.1 Needs Assessment 5.1 Performance (Talent) Management Assessment 3.2 Candidate Identification Services 4.2 General Training Design, Development and Delivery 5.2 Performance (Talent) Management Development 2.3 Organisationa l Design/ Capability Planning – Global Level 3.3 Job Profile Services/ Requisition Processing 4.3 Training & Development Management 2.4 Job Classification/ Evaluation 3.4 Candidate Selection 4.4 Technical/ Functional/ Policy & Procedure Training 2.2 Organisationa l Design/ Capability Planning – Multi-country Level 3.1 Workforce Planning 5.3 Performance Reviews 5.4 Succession (Talent) Management 2.5 Organisation Restructure/ Change/ Development 3.5 Temporary and Contractor Staffing 4.5 Employee Induction/ Orientation 2.6 Acquisition/ Divestiture/ Start-up Due Diligence/ Support 3.6 General Employment Services 4.6 Competencies / Skills Model Development And Assessment 2.7 Managing External Consultants/ Outsource Providers 3.7 Relocation 4.7 Leadership/ Management Development 3.8 Outplacement Services 4.8 Executive Development 3.9 Employment Law Services 4.9 Career Development 5.9 Consulting To Line Managers On Performance Issues 3.10 Consulting Line Managers On Staffing Issues 4.10 Consulting On Managerial Issues 5.10 Managing ASP/ERP/ Software Providers 3.11 Managing ASP/software/ Outsource Providers 4.11 Managing ASP/ERP/soft ware/Outsour ce Providers 5.5 Attendance Management REWARD EMPLOYEE RELATIONS & COMMS 6.1 Total Reward Programme 7.1 Employee Communications 6.2 Wage And Salary Management 7.2 Benefits 6.3 Bonus/Incenti ve/ Stock Options Compensatio n 6.4 Senior/ Executive Compensatio n 6.5 Expatriate Compensatio n 7.3 Attendance/ Leave Of Absence/ Exit Interviews 7.4 Return-ToWork and Job Accommodati on 7.5 Company Policies And Procedures EMPLOYEE HEALTH & SAFETY HRIS & MEASUREMENT 8.1 Risk Management/ Regulatory Compliance/ Security 9.1 HRIS Strategy 8.2 Risk Assessment 9.2 HRIS Planning 34 Retirement population PERFORMANCE HR ORGANISATION RESOURCING TRAINING & (TALENT) GOVERNANCE DESIGN DEVELOPMENT MANAGEMENT 34 5,391 5,304 HCM Intelligence PAYROLL 10.1 Payroll 10.2 Employee/ Manager Interaction/ Problem Resolution 8.3 Accident Prevention and Training Programmes 9.3 HRIS Support 8.4 Health/Medica l Programmes 9.4 Employee Research & Modelling 10.4 Special Pay, Adjustments And Deductions 8.5 Incident Tracking and Reporting 9.5 Benchmarkin g 10.5 Payroll Accounting/ Recon/ Manual Calculations & Disbursement 8.6 Managing External Consultants/ Outsource Providers 9.6 Measurement and Reporting 10.6 Tax Reporting/ Audit 9.7 Employee Records/Case management/ Data Maintenance HR delivery and operational risk 10.7 Employee Reimburseme nt 10.3 Time Reporting 6.6 Compensatio n Analysis/Pay review 7.6 Collective Bargaining/ Negotiating/ Consultative Processes 5.7 Employee Counselling/ Case management 6.7 Healthcare/ Welfare/ Statutory/ Other Benefit Programmes 7.7 Work Practices For Represented Employees 5.8 PM Compliance Support 6.8 Pension Management 7.8 Conflict and Issue Resolution 9.8 Reporting/ Interfaces 9.9 Managing ASP/software/ Outsource Providers TRAINING & DIVERSITY DEVELOPMENT 10.8 Statutory Benefits/ Miscellaneous Admin 7.9 Corporate/ Community Social Responsibility 10.9 Reporting/ Interfaces 5.6 Employee Coaching 6.9 Retirement Planning/ Counselling And Administratio n 6.10 Managing External Consultants/ Outsource Providers 7.10 Government/ Legislative Issues Modelling analytics linking performance to human capital (management) 10.10 Managing Outsource Providers TALENT MANAGEMENT Leadership Leadership & & governance governance 59.9 41.6 65.7 Human Human Capital Capital Practices Practices Line-of-sight Line-of-sight Reward Reward Employee Employee Engagement Engagement Work environment Work environment Individual/ Individual/ team team Productivity Productivity Portfolio mix Portfolio mix X-selling X-selling Service Service Employee Employee Retention Retention ‘Local’ ‘Local’ Management Management Compliance Compliance Cost control Cost control External External Value Value Proposition Proposition Customer Customer Satisfaction Satisfaction 68.4 48.7 Customer Customer Loyalty Loyalty Profitability Profitability PERFORMANCE ORIENTATION HR OPERATIONAL EXCELLENCE 64.2 60.3 + Revenue Revenue Growth Growth HR GOVERNANCE 43.1 + RESOURCING Work values Work values Development Development 61.5 74.2 Shareholder Shareholder value value Employer Employer brand brand EMPLOYER BRAND 67.4 + REWARD RETENTION 7.11 Managing External Consultants EMPLOYEE CENTRICITY 81.3 + 59.4 62.8 LEADERSHIP 79.6 + ORGANISATION DESIGN ORGANISATION COMMUNICATIONS ORGANISATION CLIMATE Management Pathfinder (OE indicators) ‘RADAR’ Source: The Enterprise-wide Application of Human Capital Intelligence (HCMi), N J Higgins & G Cohen ,VaLUENTiS white paper
- 58. ‘Thank you.’
- 60. Nicholas J Higgins nicholas.higgins@valuentis.com VaLUENTiS Ltd, 2nd Floor, Berkeley Square House, Berkeley Square, London W1J 6BD HO: +44 (0)207 887 6108 M: +44 (0)7811 404713 www.valuentis.com www.ISHCM.com www.NicholasJHiggins.com www.HCglobal.blogspot.com
- 61. Employee Engagement Solutions Evidenced based definition, understanding and application What we bring… Global reach Measurement wisdom and expertise Senior management feedback sessions Performance link Line of sight Reward (equity) ‘License to manage’ programmes Work environment On-line tools and analytics Development Operating culture Frontline blended learning VaLUENTiS Ltd, 2nd Floor, Berkeley Square House, Berkeley Square, London W1J 6BD HO: +44 (0)207 887 6108/21 www.valuentis.com www.ISHCM.com Survey design expertise Actioning strategies and tactics THE EE PLAYBOOK Project management expertise ‘Ten years of innovation…’
- 63. Evaluation level BRONZE (Lite) Level 1 SILVER Level 2 GOLD Level 3 Extended options and advisory Who participates Outputs Benefits TM Pathfinder •Employees •Managers •HR personnel ...plus baseline HC metrics and demographic data 1.Initial knowledge session 2.Employee engagement assessment (inc. recut of existing survey data) 3.Level 1 TM Playbook including Organisation engagement (15OE) assessment (‘RADAR’) 4.Best practice recommendations (lite) 5.Feedback/review session - Provides robust and quantitative insight of employee and organisation engagement - Briefing on summary improvement actions - Potential for further people management insight and actioning - Management learning particularly where interwoven in MD programme TM Pathfinder •Employees •Managers •HR personnel ...plus baseline HC metrics, demographic & HR spend data 1.Initial knowledge session 2.Employee engagement assessment (inc. re-cut of existing survey data) 3.Organisation engagement (15OE) assessment 4.Strategic HCM value driver analysis and assessment 5.Line/HR view congruency 6.HR spend analysis 7.Production of HC operating statements 8.Level 2 TM Playbook including recommendations & routemap (80+ page technical report) 9.Feedback/review session and presentation - Provides robust and quantitative insight of employee and organisation engagement - Detailed commentary on strengths, areas for enhancement and corresponding improvement actions (‘in loco’ HR strategy) - Detailed insight of HC related operating performance - Comparative benchmarks to assess performance and progress - Management development TM Pathfinder •Employees •Managers •Personnel ...plus baseline HC metrics, demographic, HR spend & functional activity and organisation performance data 1.Initial knowledge session 2.Employee engagement assessment (inc. re-cut of existing survey data) 3.Organisation engagement (15OE) assessment 4.Strategic HCM value driver analysis and assessment 5.Line/HR view congruency 6.HR spend analysis 7.Production of HC operating statements 8. Level 3 TM Playbook including full implementation routemap with detailed actions (extended report) 9.Feedback/review session - Provides robust and quantitative insight of employee and organisation engagement - Detailed commentary on strengths, areas for enhancement - Fully comprehensive implementation routemap with detailed actions - HR function ‘profile’ assessment - Detailed insight of HC related operating performance - Comparative benchmarks to assess performance and progress - Management development As required - Bespoke additional services, analyses and reports to fit client context and requirements Provides extensive client solution coverage Professional Services www.valuentis.com VaLUENTiS Ltd, 2nd Floor, Berkeley Square House, Berkeley Square, London W1J 6BD +44 (0) 207 887 6108
- 64. Smart. Smarter. Smartest... Professional Services www.valuentis.com ‘The leading human capital management specialists’ ‘PEOPLE SCIENCE®’ Organisation Intelligence to improve organisation performance • • • • • • • • • • SOLUTIONS Human Capital Management Evaluation Employee Engagement Talent Management Workforce Productivity & Performance Predictive Analytics HC Forensics & Risk HR Function ROI Analysis Organisation Measurement Management Education Organisation Strategy
- 65. …+ 2nd Floor, Berkeley Square House, Berkeley Square, London W1J 6BD Tel: +44 (0)207 887 6121 Fax: +44 (0)207 887 6100 enquiries@ISHCM.com www.ISHCM.com Think HR. Think Human Capital.™ Human Capital Management. Only one place to learn Being human is unique. Attaining an M Sc in HCM is even more so.