1. MICRONUTRIENTS ROBBING CORN YIELDS ON LONEWOOD SOIL
Grove, J.H1.; Schwab, G.J.2; Thompson, E. Raymond3
1 UK Soil Management Agronomist, University of Kentucky, Lexington, KY, 40546
2UK Extension Agronomist, University of Kentucky, Lexington, KY, 40546
3Russell County Extension Agent for Agriculture, University of Kentucky, Russell Springs, KY, 42642
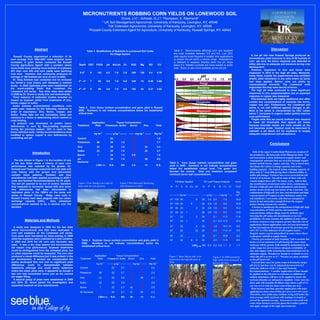
Abstract Table 4. Micronutrients affecting corn and soybean
Discussion
Table 1. Stratification of Nutrients in Lonewood Soil Under
No-tillage System are most available between 5.8 and 6.2. Low CEC
Russell County experienced a reduction of its soils require more frequent & smaller lime applications A low pH site near Russell Springs produced an
corn acreage from 1982-2007 while soybean acres to contain the pH within a narrow range. Molybdenum extraordinary yield response to zinc of 50 bushels of
increased. A grain farmer contacted the Russell is deficient in soybean rhizobia when the pH drops corn per acre. No boron response was detected at
County Agriculture Agent3 with a problem where Depth CEC P2O5 pH Buf pH Zn K2O Mg BO CU below 6.2. Metallic nutrients are more soluble in acidic either site due to adequate soil moisture during crop
some fields were yielding more bushels of soybeans soils. Boron is also more available at low soil pH. development.
(67) than corn (63) and corn yields were declining However, responses to zinc and boron were
0-2" 8 142 6.2 7.0 2.8 309 128 0.4 0.76 measured in 2010 in the high pH sites. Moreover,
over time. However, that community produced an
average of 188 bushels per acre of corn in 2002. many fields outside the experimental area exhibited
Dr. Greg Schwab was contacted and he reviewed drastic yield reductions in dry soils where no borax
2" - 4" 7 62 5.9 7.0 0.6 245 72 0.45 0.68 had been applied. Barren cobs cut yields by
the farmer’s crop history and designed a nutrient
study. In 2008 replicated plots were established on unprecedented amounts. The Lonewood soils
the worst-yielding fields that contained the responded like they were devoid of boron.
4" - 6" 6 58 5.8 7.0 0.8 182 62 0.27 0.82 The high pH sites continued to show significant
Lonewood soil series. Two other sites were added
in 2009 by Dr. Grove to study zinc soil amendments. responses to zinc supplementation, but an expected
Three seasons of replicated studies revealed no response to copper was measured.
impact on soybean yields from treatments of zinc, Fine-textured soils are highly weathered and often
boron, copper or sulfur. contain low concentrations of nutrients like boron,
Under extreme environmental conditions corn copper and zinc. Furthermore, the Lonewood soil
Table 2. Corn tissue nutrient concentration and grain yield in Russell series is not well buffered against changes in pH.
yields were reduced by the following nutrients in
2008. Numbers in red indicate concentrations below the established Most of the series is characterized by CEC values
order of importance: Zinc, Boron, Copper, and
critical level. below 7. Increases in organic matter greatly improve
Sulfur. These data are not cumulative since soil
moisture is a factor in determining which nutrient is crop performance.
most limiting. Fragile soils that are poorly buffered may respond
A protocol was developed to predict boron Application Tissue Concentration to lower pH thresholds than typical silt loams
deficiencies in corn by tissue-testing soybeans Treatment Rate Potassium Sulfur Boron Zinc Yield because essential metals are more soluble as the
during the previous season. CEC is used to flag soil becomes acidic. Caution must be exercised to
boron deficient soils. Liming recommendations were maintain a pH above 6.2 for soybeans to supply
kg ha-1 -------- g kg-1 -------- ------ mg kg-1 ------- Mg ha-1 adequate molybdenum and phosphorus.
modified to reduce copper & zinc deficiencies by
controlling soil pH. Control 24 1.4 2.3 15 7.6
Potassium 56 25 1.5 3.0 15 7.7
Conclusions
Zinc 22 25 1.6 3.5 24 8.3
Sulfur 22 25 1.5 3.5 22 8.7 Soils of the upper Cumberland Plateau are atypical of
Introduction
Boron 1 24 1.5 5.0 14 7.6 the productive, silt loam soils of the Bluegrass State. One
soil association is often deficient in organic matter and
All 25 1.5 4.0 29 8.0
The site shown in Figure 1 is the location of one consequently nutrients that are recycled through organic
Nutrients Table 5. Corn tissue nutrient concentration and grain
of the two fields where a history of poor corn matter include boron, copper, and zinc. The textural class
performance was reported by the grower. Dr. LSD(0.10) N.S. NS 2.5 13 N.S. yield in 2009. Numbers in red indicate concentrations also limits the cation exchange capacity and water-
Schwab and Thompson examined soil test data and below the established critical level. The green box holding capacity. The typical cation exchange capacity of
crop history with the grower and discovered denotes the control. Only one treatment surpassed these soils is 7 meg/100g giving them a limited ability to
nutrient trend patterns. Fertilizer and lime minimum boron leaf concentrations. buffer pH changes. Farmers have over-corrected the pH
amendments had been applied according to AGR-1 in favor of soybeans. The pH in some of these soils can
Lime and Nutrient Recommendations for 20 years. Fertilizer Applied R1 Leaf Tissue Analysis Grain remain lodged above pH 7 for many years. Add to that
The soil pH seemed to be out of control, therefore Figure 1 Over liming is an issue on Figure 2 Plot Harvester Measuring the stratification of nutrients under strict, continuous no-
they expected to encounter issues with zinc since these soils for corn growers Zinc Response in 2010 N P S B Cu Zn N P S B Cu Zn Yield till and a high pH zone rich in phosphorus and organic
zinc deficiencies had been documented in matter occurs in the top two inches of the A horizon. The
replicated plots in the 1980’s on the same soil Mg combination of high pH, low zinc concentration and high
series in Russell County. Ridge Land soils in ------------ kg ha-1 ------------- ------ g kg-1 ---- ---mg kg-1 ---- ha-1 concentrations of P equate to zinc deficiency under wet
Russell County have been plagued with low cation 67 100 56 6 29 3.4 2.0 3.8 7.5 19 16.0 soil conditions. Conversely, soils that are marginal in
exchange capacity (CEC), Also, potassium boron do not mineralize enough B from the organic
concentrations seemed to be in decline over the 67 100 56 6 26 2.9 1.6 3.5 8.8 11 15.9 matter during extreme dry weather.
decades. 67 40 20 2 30 2.6 1.8 4.3 9.0 15 14.2 A means to ameliorate the antagonisms of high pH, high
concentrations of P2O5 and low micronutrient
67 40 22 1 28 2.6 1.9 4.5 8.5 14 13.9 concentrations without tillage must be defined, since
67 22 2 30 2.1 2.1 4.5 11.3 17 11.6 lowering the pH using soil amendments is too cost
prohibitive. In some seasons, the addition of zinc sulfate
Materials and Methods 67 22 1 30 1.8 2.1 6.3 11.0 15 10.0 or borax returns a crop response greater than the cost of
application. Boron application rates are best determined
A study was designed in 2008 for the two sites 67 22 5 29 1.6 1.9 4.3 10.5 21 9.5
by the leaf analyses of soybeans grown the previous year
where micronutrients and K2O were replicated in 67 22 22 29 1.8 2.0 4.8 11.5 41 9.5 and CEC is a fair indicator of soil organic matter.
corn and soybeans on the Lonewood soil series. Organic matter can be mineralized in years where there
Corn plots were harvested by hand picking in 2008 67 22 28 1.8 2.1 4.3 10.8 15 9.2 is adequate rainfall to supply boron.
while the soybeans were collected by a plot combine. Clearly, prevention of soils reaching 7 pH is needed, but
Table 3. Soybean tissue nutrient concentration and grain yield in 67 22 6 3 30 1.6 2.0 4.3 11.8 18 8.5
In 2009 and 2010 the UK corn plot harvester was better yet is to maintain 6.2 pH during the years when
2008. Numbers in red indicate concentrations below the
used. It was a dry crop season but micronutrients LSD(0.10) NS 0.3 0.2 0.9 1.1 5 1.7 soybeans will be grown. Soils should be maintained in the
established critical level.
did impact crop performance. Soybean treatments acidic range for corn to insure adequate availability of
could be distinguished from the untreated plots, but zinc and copper while assuring the macronutrients are in
no yield response could be measured. The corn also adequate supply. Phosphorus should be available to corn
produced a visual difference but it was evident in the Application Tissue Concentration Figure 3 Many barren cobs were when the pH is as low as 5.7. Nitrates are more available
Figure 4 In 2009 extremely
ear development. A second ear compensated the Treatment Rate Potassium Sulfur Boron Zinc Yield observed in the high pH plots in as the pH nears 6.0.
high yields were measured in
poorly developed first one and no significant yield 2010. the low pH sites. Current lime rates for grain crops in Kentucky target
kg ha-1 ------- g kg-1 ------- ----- mg kg-1 ------ Mg ha-1
differences could be demonstrated between pH of 6.4, but they can be adjusted downward to 6.2
treatments although one could easily determine Control 23 2.7 9 21 2.2 using the tables in AGR-1 Lime and Nutrient
where the check plots were. It appeared as though a Recommendations. A smaller application of lime should
late rain had mineralized boron just as the second Potassium 56 23 2.7 11 21 2.0
be applied in the fall prior to soybeans or additions of
ear began filling. Zinc 22 22 2.8 9 38 2.1 sodium molybdate will have to be applied to insure the
A second group of plots were established in 2009 soybean rhizobia are adequately supplied. Lime rates for
and 2010. Dr. Grove joined the investigation and Sulfur 22 23 3.0 9 17 2.6 these soils will resemble fertilizer rates where a pH of 5.3
expanded research on zinc amendments. can rise to 6.4 with less than a ton of lime per acre.
Boron 1 22 2.7 42 20 2.5 Most farmers and lime spreader applicators will resist
All Nutrients 24 3.1 41 35 2.3 applying less than a ton of lime per acre every two years.
Therefore, corn yields may continue to lag well below the
LSD(0.10) N.S. NS 30 13 N.S. state average while soybeans will continue to match or
exceed the national average. Increases in corn yield will
come when farmers correctly guess the weather pattern
and apply enough of the right micronutrient.