SlideShare ist ein Scribd-Unternehmen logo
1 von 11
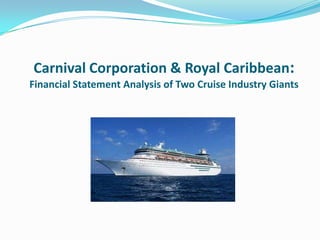
Carnival Corporation & Royal Caribbean:
Financial Statement Analysis of Two Cruise Industry Giants
The Cruise Industry
 Fastest growing travel sector in the world
 Only 20% of the US population has ever cruised
 7.2% annual passenger growth rate since 1990
 15 million passengers cruised in 2010
 Generated more than $26 billion in revenue worldwide
  in 2010
 Carnival Corporation (98 ships) controls 51.6% of
  worldwide share of revenue
 Royal Caribbean (40 ships) controls 25.6% of
  worldwide share of revenue
Carnival Business Strategies
 Largest cruise company with 98 ships
 10 more ships to be put into service by 2014
 Comprises 9 different brands
 Each brand is separately managed
 Keep costs down by selling cruises mostly through
  wholesalers
 Aim to be the most well-known cruise line serving the
  greatest number of guests at an unrivalled price
 Low cost leader
Royal Caribbean Business Strategies
 Second largest cruise company with 40 ships
 2 more ships scheduled to be delivered by 2012
 6 cruise brands including one in French market, one in
  Spanish market, and one in German market
 Upscale ships with innovative onboard activities, fine
  dining, spa services, and personalized service
 400 destinations
 Differentiation strategy
Financial Ratios - Liquidity
                   (in millions)               2010           2009        2008        2007        2006
Carnival Cruises   Liquidity Ratios
                   Current Ratio                    0.216        0.306       0.285       0.272       0.368
                   Quick Ratio                      0.118        0.181       0.185       0.190       0.266
                   Net Working Capital Ratio      (0.120)      (0.094)     (0.124)     (0.155)     (0.112)
                   Operating Cash Flow              0.663        0.673       0.587       0.560       0.671
                   Cash from Operations to
                   Total Debt                         0.264     0.226       0.237       0.286       0.294
                   Free Operating Cash Flow
                   to Total Debt                      0.017    (0.003)      0.003       0.053       0.093


                                               2010           2009         2008        2007        2006
Royal Caribbean    Liquidity Ratios
                   Current Ratio                      0.295       0.373      0.365        0.424      0.268
                   Quick Ratio                        0.199       0.227      0.252        0.233      0.155
                   Net Working Capital Ratio          0.295       0.373      0.365        0.424      0.268
                   Operating Cash Flow                0.483       0.307      0.401        0.542      0.507
                   Cash from Operations to
                   Total Debt                         0.142       0.079      0.111        0.154      0.130
                   Free Operating Cash Flow
                   to Total Debt                  (0.045)       (0.152)     (0.119)     (0.006)    (0.032)
Financial Ratios – Profitability
Carnival Cruises   Profitability Analysis Ratios   2010      2009      2008      2007      2006
                   ROA                              5.323%    5.097%    6.895%    7.440%    7.738%
                   RNOA                             6.835%    6.412%    8.599%    9.446%   18.874%
                   NOAT                            44.881%   42.133%   49.490%   47.503%   90.870%
                   NOPM                            15.229%   15.218%   17.375%   19.885%   20.770%
                   ROE                              8.777%    8.703%   11.930%   12.616%   12.988%
                   Profit Margin                   13.671%   13.605%   15.909%   18.476%   19.250%


Royal Caribbean    Profitability Analysis Ratios   2010      2009      2008      2007      2006
                   ROA                              2.887%    0.936%    3.649%    4.253%    5.144%
                   RNOA                             3.303%    0.985%    3.882%    5.023%   11.020%
                   NOAT                            40.739%   35.710%   44.207%   51.187%   90.907%
                   NOPM                             8.108%    2.758%    8.783%    9.813%   12.122%
                   ROE                              7.091%    2.271%    8.462%    9.392%   10.886%
                   Profit Margin                    8.108%    2.758%    8.783%    9.813%   12.122%
Financial Ratios – Activity & Leverage
                   Activity Analysis Ratios     2010        2009          2008           2007            2006
                   Assets Turnover             0.389        0.375         0.433          0.403           0.402

Carnival Cruises
                   Leverage Ratios            2010        2009            2008            2007           2006
                   Debt to Equity             0.628       0.672           0.749          0.712           0.678
                   Long Term Debt to Equity   0.348       0.413           0.405          0.316           0.349

                   Debt Ratio                 0.386       0.402           0.428          0.416           0.404

                   Times Interest Earned      6.209       5.668           6.592          7.425           8.375


                   Activity Analysis Ratios   2010        2009            2008           2007             2006

                   Asset Turnover               0.343     0.323              0.397          0.410            0.390

                   Leverage Ratios             2010        2009            2008            2007            2006
Royal Caribbean
                   Debt to Equity                 1.480           1.431          1.420           1.217           1.199

                   LT Debt to Equity              1.046           1.065          1.027           0.871           0.891

                   Debt Ratio                     0.597           0.589          0.587           0.549           0.545

                   Times Interest Earned          2.613           1.541          2.753           2.808           3.367
Carnival Forecasting and Equity Value
(millions)                               2010          2011         2012
Net Sales Growth                                            5.30%        4.70%
Net Sales (Unrounded)                      14,469.00    15,235.86    15,951.94
Net Sales (Rounded)                        14,469.00    15,236.00    15,952.00
NOPAT                                       2,203.48     2,082.85     2,180.74
NOA                                        32,395.00    33,947.46    35,542.78


Book Value Multiple Forecasting:
         Equity Instrinsic Value $20,829,114,240.39
         Equity Intrinsic Value per Share: $34.72

Residual Operating Income Model:
          Firm Equity Value: $17,271,800,744.12
          Equity Value per Share: $28.79

Current Share Price: $30.65
Royal Caribbean Forecasting and Equity Value
 (millions)                          2010          2011         2012
 Net Sales Growth                                      5.00%        5.00%
 Net Sales (Unrounded)               6,752.50    7,090.13     7,444.64
 Net Sales (Rounded)                 6,752.00    7,090.00     7,445.00
 NOPAT                                 547.47      574.29       603.05
 NOA                                17,197.03   17,420.15    18,292.38


 Book Value Multiple Forecasting:
          Equity Instrinsic Value $8,693,409,826.43
          Equity Intrinsic Value per Share: $38.43

 Residual Operating Income Model:
           Firm Equity Value: $3,507,062,994.13
           Equity Value per Share: $15.50

 Current Share Price: $24.03
Recommendations
 For creditors, Carnival is less risky
 For investors,
    Carnival is more likely for stable returns and continued growth
     - larger customer base
     - already dominates cruise market
     - strategically positioned as low-cost leader
    Royal Caribbean is more risky but has potential for excellent returns
     in the future if economy improves
     - aggressive global expansion
     - innovations & investment in technology to improve fuel efficiency
     - differentiation of cruise options
     - luxury market is more affected by economic instability
Interesting Facts
 Carnival: Carnival’s ships are among the biggest in the world in order
  to accommodate the greatest number of passengers per voyage. For
  example, the Liberty is taller than the Statue of Liberty and longer than
  3 football fields.

 Royal Caribbean: Royal Caribbean is incorporated in Liberia so, under
  Section 883 of IRS Code, it is not subject to US federal income tax on
  US source income derived from the international operation of ships. It
  is subject to certain miscellaneous income taxes, such as gambling
  income in Alaska, but they are immaterial and not included on
  financial statements.

Weitere ähnliche Inhalte

Was ist angesagt?

Brand Differentiation through Customer Relationship Management - HBR Case review
Brand Differentiation through Customer Relationship Management - HBR Case reviewBrand Differentiation through Customer Relationship Management - HBR Case review
Brand Differentiation through Customer Relationship Management - HBR Case reviewAngga Kusumanegara
 
Honda International Case Study
Honda International Case StudyHonda International Case Study
Honda International Case StudyJacob Hostetler
 
TiVo Presentation
TiVo PresentationTiVo Presentation
TiVo Presentationmikerpitt
 
Renault-Nissan Alliance Case Study
Renault-Nissan Alliance Case StudyRenault-Nissan Alliance Case Study
Renault-Nissan Alliance Case Studyeonemo
 
Wal Mart Case Study
Wal Mart Case StudyWal Mart Case Study
Wal Mart Case StudyRamjeManish
 
Philips versus Matsushita Case ANALYSIS
Philips versus Matsushita  Case ANALYSISPhilips versus Matsushita  Case ANALYSIS
Philips versus Matsushita Case ANALYSISSahajdeepSingh6
 
Strategic Analysis of Unilever
Strategic Analysis of UnileverStrategic Analysis of Unilever
Strategic Analysis of UnileverTouseef Ahmed
 
Chateau Margaux case study
Chateau Margaux case studyChateau Margaux case study
Chateau Margaux case studyMila Ioffe
 
Strategy Management of Ford Motor Company.
Strategy Management of Ford Motor Company.Strategy Management of Ford Motor Company.
Strategy Management of Ford Motor Company.Zahra Rezwana
 
Toyota marketing services
Toyota marketing servicesToyota marketing services
Toyota marketing serviceskbrel
 
Country presentation of Germany- CAGE framework :doing business with Germany
Country presentation of Germany- CAGE framework :doing business with GermanyCountry presentation of Germany- CAGE framework :doing business with Germany
Country presentation of Germany- CAGE framework :doing business with GermanyAnna S Lal
 
Barilla Spa: A case on Supply Chain Integration
Barilla Spa: A case on Supply Chain IntegrationBarilla Spa: A case on Supply Chain Integration
Barilla Spa: A case on Supply Chain IntegrationHimadri Singha
 

Was ist angesagt? (20)

Harley davidson
Harley davidson Harley davidson
Harley davidson
 
Brand Differentiation through Customer Relationship Management - HBR Case review
Brand Differentiation through Customer Relationship Management - HBR Case reviewBrand Differentiation through Customer Relationship Management - HBR Case review
Brand Differentiation through Customer Relationship Management - HBR Case review
 
Ncc case study
Ncc case studyNcc case study
Ncc case study
 
Honda International Case Study
Honda International Case StudyHonda International Case Study
Honda International Case Study
 
TiVo Presentation
TiVo PresentationTiVo Presentation
TiVo Presentation
 
Renault-Nissan Alliance Case Study
Renault-Nissan Alliance Case StudyRenault-Nissan Alliance Case Study
Renault-Nissan Alliance Case Study
 
Wal Mart Case Study
Wal Mart Case StudyWal Mart Case Study
Wal Mart Case Study
 
Philips versus Matsushita Case ANALYSIS
Philips versus Matsushita  Case ANALYSISPhilips versus Matsushita  Case ANALYSIS
Philips versus Matsushita Case ANALYSIS
 
Volvo trucks case study
Volvo trucks case studyVolvo trucks case study
Volvo trucks case study
 
Strategic Analysis of Unilever
Strategic Analysis of UnileverStrategic Analysis of Unilever
Strategic Analysis of Unilever
 
Unilever presentation
Unilever presentationUnilever presentation
Unilever presentation
 
Chateau Margaux case study
Chateau Margaux case studyChateau Margaux case study
Chateau Margaux case study
 
Strategy Management of Ford Motor Company.
Strategy Management of Ford Motor Company.Strategy Management of Ford Motor Company.
Strategy Management of Ford Motor Company.
 
IKEA
IKEAIKEA
IKEA
 
Toyota marketing services
Toyota marketing servicesToyota marketing services
Toyota marketing services
 
Airborne Express
Airborne ExpressAirborne Express
Airborne Express
 
Country presentation of Germany- CAGE framework :doing business with Germany
Country presentation of Germany- CAGE framework :doing business with GermanyCountry presentation of Germany- CAGE framework :doing business with Germany
Country presentation of Germany- CAGE framework :doing business with Germany
 
Home Depot Analysis
Home Depot AnalysisHome Depot Analysis
Home Depot Analysis
 
Ford motor company
Ford motor companyFord motor company
Ford motor company
 
Barilla Spa: A case on Supply Chain Integration
Barilla Spa: A case on Supply Chain IntegrationBarilla Spa: A case on Supply Chain Integration
Barilla Spa: A case on Supply Chain Integration
 

Andere mochten auch

Strategic Management Case Study
Strategic Management Case StudyStrategic Management Case Study
Strategic Management Case StudyNelly Emerson
 
Carnival Cruises Marketing plan and Business Case - Yolanda Williams
Carnival Cruises Marketing plan and Business Case - Yolanda WilliamsCarnival Cruises Marketing plan and Business Case - Yolanda Williams
Carnival Cruises Marketing plan and Business Case - Yolanda WilliamsYolanda Williams
 
Royal Caribbean International Marketing Plan 2013 (French Market)
Royal Caribbean International Marketing Plan 2013 (French Market)Royal Caribbean International Marketing Plan 2013 (French Market)
Royal Caribbean International Marketing Plan 2013 (French Market)Ben Canzano
 
Success and Failure in the Cruise Line Industry
Success and Failure in the Cruise Line IndustrySuccess and Failure in the Cruise Line Industry
Success and Failure in the Cruise Line IndustryBobby Abbett
 
Oasis of the Sea
Oasis of the SeaOasis of the Sea
Oasis of the Seajim hopkins
 
External Analysis of the Cruise Line Industry
External Analysis of the Cruise Line IndustryExternal Analysis of the Cruise Line Industry
External Analysis of the Cruise Line IndustryNicole Bick
 
RCL equity report
RCL equity reportRCL equity report
RCL equity reportYunlu Peng
 
Caribbean cruises IT strategy an analysis
Caribbean cruises IT strategy an analysisCaribbean cruises IT strategy an analysis
Caribbean cruises IT strategy an analysisAbinesh Raja M
 
Royal Caribbean Inc.
Royal Caribbean Inc.Royal Caribbean Inc.
Royal Caribbean Inc.ncharoonsri
 
Carnival cruise lines
Carnival cruise linesCarnival cruise lines
Carnival cruise linesJoseph Enrico
 
Corporate Level Strategy: Creating Value through Diversification
Corporate Level Strategy: Creating Value through DiversificationCorporate Level Strategy: Creating Value through Diversification
Corporate Level Strategy: Creating Value through DiversificationAngelica Angelo Ocon
 
Internal Analysys Of Strategic Management
Internal Analysys Of Strategic ManagementInternal Analysys Of Strategic Management
Internal Analysys Of Strategic Managementguestd507e7
 
Apple inc. Strategic Case Analysis
Apple inc. Strategic Case AnalysisApple inc. Strategic Case Analysis
Apple inc. Strategic Case AnalysisMahy Helal
 
Case study on amazon
Case study on amazonCase study on amazon
Case study on amazonAnnamalai Ram
 
Illustrating Customer Segments & Value Propositions with Ridiculous Toys. An ...
Illustrating Customer Segments & Value Propositions with Ridiculous Toys. An ...Illustrating Customer Segments & Value Propositions with Ridiculous Toys. An ...
Illustrating Customer Segments & Value Propositions with Ridiculous Toys. An ...Leslie Forman
 
Case Study Analysis Of Google
Case Study Analysis Of GoogleCase Study Analysis Of Google
Case Study Analysis Of Googleabnguyen28
 

Andere mochten auch (20)

Strategic Management Case Study
Strategic Management Case StudyStrategic Management Case Study
Strategic Management Case Study
 
cruise presentation
cruise presentationcruise presentation
cruise presentation
 
Carnival Cruises Marketing plan and Business Case - Yolanda Williams
Carnival Cruises Marketing plan and Business Case - Yolanda WilliamsCarnival Cruises Marketing plan and Business Case - Yolanda Williams
Carnival Cruises Marketing plan and Business Case - Yolanda Williams
 
Royal Caribbean International Marketing Plan 2013 (French Market)
Royal Caribbean International Marketing Plan 2013 (French Market)Royal Caribbean International Marketing Plan 2013 (French Market)
Royal Caribbean International Marketing Plan 2013 (French Market)
 
Final SAOR
Final SAORFinal SAOR
Final SAOR
 
Success and Failure in the Cruise Line Industry
Success and Failure in the Cruise Line IndustrySuccess and Failure in the Cruise Line Industry
Success and Failure in the Cruise Line Industry
 
Oasis of the Sea
Oasis of the SeaOasis of the Sea
Oasis of the Sea
 
External Analysis of the Cruise Line Industry
External Analysis of the Cruise Line IndustryExternal Analysis of the Cruise Line Industry
External Analysis of the Cruise Line Industry
 
RCL equity report
RCL equity reportRCL equity report
RCL equity report
 
Caribbean cruises IT strategy an analysis
Caribbean cruises IT strategy an analysisCaribbean cruises IT strategy an analysis
Caribbean cruises IT strategy an analysis
 
Cruise.ppt
Cruise.pptCruise.ppt
Cruise.ppt
 
Royal Caribbean Inc.
Royal Caribbean Inc.Royal Caribbean Inc.
Royal Caribbean Inc.
 
Carnival cruise lines
Carnival cruise linesCarnival cruise lines
Carnival cruise lines
 
Corporate Level Strategy: Creating Value through Diversification
Corporate Level Strategy: Creating Value through DiversificationCorporate Level Strategy: Creating Value through Diversification
Corporate Level Strategy: Creating Value through Diversification
 
Internal Analysys Of Strategic Management
Internal Analysys Of Strategic ManagementInternal Analysys Of Strategic Management
Internal Analysys Of Strategic Management
 
Apple inc. Strategic Case Analysis
Apple inc. Strategic Case AnalysisApple inc. Strategic Case Analysis
Apple inc. Strategic Case Analysis
 
All about Google
All about GoogleAll about Google
All about Google
 
Case study on amazon
Case study on amazonCase study on amazon
Case study on amazon
 
Illustrating Customer Segments & Value Propositions with Ridiculous Toys. An ...
Illustrating Customer Segments & Value Propositions with Ridiculous Toys. An ...Illustrating Customer Segments & Value Propositions with Ridiculous Toys. An ...
Illustrating Customer Segments & Value Propositions with Ridiculous Toys. An ...
 
Case Study Analysis Of Google
Case Study Analysis Of GoogleCase Study Analysis Of Google
Case Study Analysis Of Google
 

Ähnlich wie Financial Statement Analysis

Abch group results booklet 2010
Abch group results booklet 2010Abch group results booklet 2010
Abch group results booklet 2010wgjlubbe
 
Performance evaluation of Eastern Bank Ltd.
Performance evaluation of Eastern Bank Ltd.Performance evaluation of Eastern Bank Ltd.
Performance evaluation of Eastern Bank Ltd.Maruf Ahmed
 
Casushandelsgeestblanco
CasushandelsgeestblancoCasushandelsgeestblanco
CasushandelsgeestblancoFlexs bv
 
Erin Parker Atvidcf V1
Erin Parker Atvidcf V1Erin Parker Atvidcf V1
Erin Parker Atvidcf V1Caneskid05
 
Venture Capitalist competition Analysis Team Lollapalooza
Venture Capitalist competition Analysis Team LollapaloozaVenture Capitalist competition Analysis Team Lollapalooza
Venture Capitalist competition Analysis Team Lollapaloozadoshihardik
 
Fauji Fertilizer and Fatima Fertilizer Annual Reports Analysis
Fauji Fertilizer and Fatima Fertilizer Annual Reports AnalysisFauji Fertilizer and Fatima Fertilizer Annual Reports Analysis
Fauji Fertilizer and Fatima Fertilizer Annual Reports AnalysisSahir Moiz
 
Financial Model Manufacturing And Retail Businesses
Financial Model Manufacturing And Retail BusinessesFinancial Model Manufacturing And Retail Businesses
Financial Model Manufacturing And Retail BusinessesElisha A. A. (Capital) Ltd
 
Mock Startup - Deal Analytics Pvt. Ltd.
Mock Startup - Deal Analytics Pvt. Ltd.Mock Startup - Deal Analytics Pvt. Ltd.
Mock Startup - Deal Analytics Pvt. Ltd.Jayanth Kashyap
 
KENYA AIRWAYS STATEMENT ANALYSIS- CIFA LUDENYO
KENYA AIRWAYS STATEMENT ANALYSIS- CIFA LUDENYOKENYA AIRWAYS STATEMENT ANALYSIS- CIFA LUDENYO
KENYA AIRWAYS STATEMENT ANALYSIS- CIFA LUDENYOJESSELUDENYO
 
Bank of baroda_q4_fy10
Bank of baroda_q4_fy10Bank of baroda_q4_fy10
Bank of baroda_q4_fy10mittalmanisha
 
Media Dashboard -- JB
Media Dashboard -- JBMedia Dashboard -- JB
Media Dashboard -- JBmanagerial00
 
Media dashboard client tbd(1)
Media dashboard client   tbd(1)Media dashboard client   tbd(1)
Media dashboard client tbd(1)managerial00
 
ACI Pharmaceuticals Working Capital Management Group Presentation
ACI Pharmaceuticals Working Capital Management  Group PresentationACI Pharmaceuticals Working Capital Management  Group Presentation
ACI Pharmaceuticals Working Capital Management Group PresentationNazib H. Chowdhury
 

Ähnlich wie Financial Statement Analysis (20)

Abch group results booklet 2010
Abch group results booklet 2010Abch group results booklet 2010
Abch group results booklet 2010
 
Ppt ideko spx_team
Ppt ideko spx_teamPpt ideko spx_team
Ppt ideko spx_team
 
Performance evaluation of Eastern Bank Ltd.
Performance evaluation of Eastern Bank Ltd.Performance evaluation of Eastern Bank Ltd.
Performance evaluation of Eastern Bank Ltd.
 
Casushandelsgeestblanco
CasushandelsgeestblancoCasushandelsgeestblanco
Casushandelsgeestblanco
 
Erin Parker Atvidcf V1
Erin Parker Atvidcf V1Erin Parker Atvidcf V1
Erin Parker Atvidcf V1
 
Venture Capitalist competition Analysis Team Lollapalooza
Venture Capitalist competition Analysis Team LollapaloozaVenture Capitalist competition Analysis Team Lollapalooza
Venture Capitalist competition Analysis Team Lollapalooza
 
Fauji Fertilizer and Fatima Fertilizer Annual Reports Analysis
Fauji Fertilizer and Fatima Fertilizer Annual Reports AnalysisFauji Fertilizer and Fatima Fertilizer Annual Reports Analysis
Fauji Fertilizer and Fatima Fertilizer Annual Reports Analysis
 
Ocbc nisp am t4-2011
Ocbc nisp am t4-2011Ocbc nisp am t4-2011
Ocbc nisp am t4-2011
 
Financial Model Manufacturing And Retail Businesses
Financial Model Manufacturing And Retail BusinessesFinancial Model Manufacturing And Retail Businesses
Financial Model Manufacturing And Retail Businesses
 
Mock Startup - Deal Analytics Pvt. Ltd.
Mock Startup - Deal Analytics Pvt. Ltd.Mock Startup - Deal Analytics Pvt. Ltd.
Mock Startup - Deal Analytics Pvt. Ltd.
 
KENYA AIRWAYS STATEMENT ANALYSIS- CIFA LUDENYO
KENYA AIRWAYS STATEMENT ANALYSIS- CIFA LUDENYOKENYA AIRWAYS STATEMENT ANALYSIS- CIFA LUDENYO
KENYA AIRWAYS STATEMENT ANALYSIS- CIFA LUDENYO
 
Bank of baroda_q4_fy10
Bank of baroda_q4_fy10Bank of baroda_q4_fy10
Bank of baroda_q4_fy10
 
itw 072203
 itw 072203 itw 072203
itw 072203
 
Infosys
InfosysInfosys
Infosys
 
Media dashboard
Media dashboard Media dashboard
Media dashboard
 
Media Dashboard -- JB
Media Dashboard -- JBMedia Dashboard -- JB
Media Dashboard -- JB
 
Media dashboard client tbd(1)
Media dashboard client   tbd(1)Media dashboard client   tbd(1)
Media dashboard client tbd(1)
 
ACI Pharmaceuticals Working Capital Management Group Presentation
ACI Pharmaceuticals Working Capital Management  Group PresentationACI Pharmaceuticals Working Capital Management  Group Presentation
ACI Pharmaceuticals Working Capital Management Group Presentation
 
Cipla 20-09-2010
Cipla   20-09-2010Cipla   20-09-2010
Cipla 20-09-2010
 
Hansson
HanssonHansson
Hansson
 

Kürzlich hochgeladen

Traction part 2 - EOS Model JAX Bridges.
Traction part 2 - EOS Model JAX Bridges.Traction part 2 - EOS Model JAX Bridges.
Traction part 2 - EOS Model JAX Bridges.Anamaria Contreras
 
Kenya’s Coconut Value Chain by Gatsby Africa
Kenya’s Coconut Value Chain by Gatsby AfricaKenya’s Coconut Value Chain by Gatsby Africa
Kenya’s Coconut Value Chain by Gatsby Africaictsugar
 
8447779800, Low rate Call girls in Kotla Mubarakpur Delhi NCR
8447779800, Low rate Call girls in Kotla Mubarakpur Delhi NCR8447779800, Low rate Call girls in Kotla Mubarakpur Delhi NCR
8447779800, Low rate Call girls in Kotla Mubarakpur Delhi NCRashishs7044
 
Call Us 📲8800102216📞 Call Girls In DLF City Gurgaon
Call Us 📲8800102216📞 Call Girls In DLF City GurgaonCall Us 📲8800102216📞 Call Girls In DLF City Gurgaon
Call Us 📲8800102216📞 Call Girls In DLF City Gurgaoncallgirls2057
 
APRIL2024_UKRAINE_xml_0000000000000 .pdf
APRIL2024_UKRAINE_xml_0000000000000 .pdfAPRIL2024_UKRAINE_xml_0000000000000 .pdf
APRIL2024_UKRAINE_xml_0000000000000 .pdfRbc Rbcua
 
8447779800, Low rate Call girls in Uttam Nagar Delhi NCR
8447779800, Low rate Call girls in Uttam Nagar Delhi NCR8447779800, Low rate Call girls in Uttam Nagar Delhi NCR
8447779800, Low rate Call girls in Uttam Nagar Delhi NCRashishs7044
 
8447779800, Low rate Call girls in Saket Delhi NCR
8447779800, Low rate Call girls in Saket Delhi NCR8447779800, Low rate Call girls in Saket Delhi NCR
8447779800, Low rate Call girls in Saket Delhi NCRashishs7044
 
Ten Organizational Design Models to align structure and operations to busines...
Ten Organizational Design Models to align structure and operations to busines...Ten Organizational Design Models to align structure and operations to busines...
Ten Organizational Design Models to align structure and operations to busines...Seta Wicaksana
 
8447779800, Low rate Call girls in Shivaji Enclave Delhi NCR
8447779800, Low rate Call girls in Shivaji Enclave Delhi NCR8447779800, Low rate Call girls in Shivaji Enclave Delhi NCR
8447779800, Low rate Call girls in Shivaji Enclave Delhi NCRashishs7044
 
Contemporary Economic Issues Facing the Filipino Entrepreneur (1).pptx
Contemporary Economic Issues Facing the Filipino Entrepreneur (1).pptxContemporary Economic Issues Facing the Filipino Entrepreneur (1).pptx
Contemporary Economic Issues Facing the Filipino Entrepreneur (1).pptxMarkAnthonyAurellano
 
Investment in The Coconut Industry by Nancy Cheruiyot
Investment in The Coconut Industry by Nancy CheruiyotInvestment in The Coconut Industry by Nancy Cheruiyot
Investment in The Coconut Industry by Nancy Cheruiyotictsugar
 
Ms Motilal Padampat Sugar Mills vs. State of Uttar Pradesh & Ors. - A Milesto...
Ms Motilal Padampat Sugar Mills vs. State of Uttar Pradesh & Ors. - A Milesto...Ms Motilal Padampat Sugar Mills vs. State of Uttar Pradesh & Ors. - A Milesto...
Ms Motilal Padampat Sugar Mills vs. State of Uttar Pradesh & Ors. - A Milesto...ShrutiBose4
 
Buy gmail accounts.pdf Buy Old Gmail Accounts
Buy gmail accounts.pdf Buy Old Gmail AccountsBuy gmail accounts.pdf Buy Old Gmail Accounts
Buy gmail accounts.pdf Buy Old Gmail AccountsBuy Verified Accounts
 
NewBase 19 April 2024 Energy News issue - 1717 by Khaled Al Awadi.pdf
NewBase  19 April  2024  Energy News issue - 1717 by Khaled Al Awadi.pdfNewBase  19 April  2024  Energy News issue - 1717 by Khaled Al Awadi.pdf
NewBase 19 April 2024 Energy News issue - 1717 by Khaled Al Awadi.pdfKhaled Al Awadi
 
Pitch Deck Teardown: Geodesic.Life's $500k Pre-seed deck
Pitch Deck Teardown: Geodesic.Life's $500k Pre-seed deckPitch Deck Teardown: Geodesic.Life's $500k Pre-seed deck
Pitch Deck Teardown: Geodesic.Life's $500k Pre-seed deckHajeJanKamps
 
Independent Call Girls Andheri Nightlaila 9967584737
Independent Call Girls Andheri Nightlaila 9967584737Independent Call Girls Andheri Nightlaila 9967584737
Independent Call Girls Andheri Nightlaila 9967584737Riya Pathan
 
Intro to BCG's Carbon Emissions Benchmark_vF.pdf
Intro to BCG's Carbon Emissions Benchmark_vF.pdfIntro to BCG's Carbon Emissions Benchmark_vF.pdf
Intro to BCG's Carbon Emissions Benchmark_vF.pdfpollardmorgan
 
IoT Insurance Observatory: summary 2024
IoT Insurance Observatory:  summary 2024IoT Insurance Observatory:  summary 2024
IoT Insurance Observatory: summary 2024Matteo Carbone
 

Kürzlich hochgeladen (20)

Traction part 2 - EOS Model JAX Bridges.
Traction part 2 - EOS Model JAX Bridges.Traction part 2 - EOS Model JAX Bridges.
Traction part 2 - EOS Model JAX Bridges.
 
Kenya’s Coconut Value Chain by Gatsby Africa
Kenya’s Coconut Value Chain by Gatsby AfricaKenya’s Coconut Value Chain by Gatsby Africa
Kenya’s Coconut Value Chain by Gatsby Africa
 
8447779800, Low rate Call girls in Kotla Mubarakpur Delhi NCR
8447779800, Low rate Call girls in Kotla Mubarakpur Delhi NCR8447779800, Low rate Call girls in Kotla Mubarakpur Delhi NCR
8447779800, Low rate Call girls in Kotla Mubarakpur Delhi NCR
 
No-1 Call Girls In Goa 93193 VIP 73153 Escort service In North Goa Panaji, Ca...
No-1 Call Girls In Goa 93193 VIP 73153 Escort service In North Goa Panaji, Ca...No-1 Call Girls In Goa 93193 VIP 73153 Escort service In North Goa Panaji, Ca...
No-1 Call Girls In Goa 93193 VIP 73153 Escort service In North Goa Panaji, Ca...
 
Call Us 📲8800102216📞 Call Girls In DLF City Gurgaon
Call Us 📲8800102216📞 Call Girls In DLF City GurgaonCall Us 📲8800102216📞 Call Girls In DLF City Gurgaon
Call Us 📲8800102216📞 Call Girls In DLF City Gurgaon
 
APRIL2024_UKRAINE_xml_0000000000000 .pdf
APRIL2024_UKRAINE_xml_0000000000000 .pdfAPRIL2024_UKRAINE_xml_0000000000000 .pdf
APRIL2024_UKRAINE_xml_0000000000000 .pdf
 
8447779800, Low rate Call girls in Uttam Nagar Delhi NCR
8447779800, Low rate Call girls in Uttam Nagar Delhi NCR8447779800, Low rate Call girls in Uttam Nagar Delhi NCR
8447779800, Low rate Call girls in Uttam Nagar Delhi NCR
 
8447779800, Low rate Call girls in Saket Delhi NCR
8447779800, Low rate Call girls in Saket Delhi NCR8447779800, Low rate Call girls in Saket Delhi NCR
8447779800, Low rate Call girls in Saket Delhi NCR
 
Ten Organizational Design Models to align structure and operations to busines...
Ten Organizational Design Models to align structure and operations to busines...Ten Organizational Design Models to align structure and operations to busines...
Ten Organizational Design Models to align structure and operations to busines...
 
8447779800, Low rate Call girls in Shivaji Enclave Delhi NCR
8447779800, Low rate Call girls in Shivaji Enclave Delhi NCR8447779800, Low rate Call girls in Shivaji Enclave Delhi NCR
8447779800, Low rate Call girls in Shivaji Enclave Delhi NCR
 
Contemporary Economic Issues Facing the Filipino Entrepreneur (1).pptx
Contemporary Economic Issues Facing the Filipino Entrepreneur (1).pptxContemporary Economic Issues Facing the Filipino Entrepreneur (1).pptx
Contemporary Economic Issues Facing the Filipino Entrepreneur (1).pptx
 
Corporate Profile 47Billion Information Technology
Corporate Profile 47Billion Information TechnologyCorporate Profile 47Billion Information Technology
Corporate Profile 47Billion Information Technology
 
Investment in The Coconut Industry by Nancy Cheruiyot
Investment in The Coconut Industry by Nancy CheruiyotInvestment in The Coconut Industry by Nancy Cheruiyot
Investment in The Coconut Industry by Nancy Cheruiyot
 
Ms Motilal Padampat Sugar Mills vs. State of Uttar Pradesh & Ors. - A Milesto...
Ms Motilal Padampat Sugar Mills vs. State of Uttar Pradesh & Ors. - A Milesto...Ms Motilal Padampat Sugar Mills vs. State of Uttar Pradesh & Ors. - A Milesto...
Ms Motilal Padampat Sugar Mills vs. State of Uttar Pradesh & Ors. - A Milesto...
 
Buy gmail accounts.pdf Buy Old Gmail Accounts
Buy gmail accounts.pdf Buy Old Gmail AccountsBuy gmail accounts.pdf Buy Old Gmail Accounts
Buy gmail accounts.pdf Buy Old Gmail Accounts
 
NewBase 19 April 2024 Energy News issue - 1717 by Khaled Al Awadi.pdf
NewBase  19 April  2024  Energy News issue - 1717 by Khaled Al Awadi.pdfNewBase  19 April  2024  Energy News issue - 1717 by Khaled Al Awadi.pdf
NewBase 19 April 2024 Energy News issue - 1717 by Khaled Al Awadi.pdf
 
Pitch Deck Teardown: Geodesic.Life's $500k Pre-seed deck
Pitch Deck Teardown: Geodesic.Life's $500k Pre-seed deckPitch Deck Teardown: Geodesic.Life's $500k Pre-seed deck
Pitch Deck Teardown: Geodesic.Life's $500k Pre-seed deck
 
Independent Call Girls Andheri Nightlaila 9967584737
Independent Call Girls Andheri Nightlaila 9967584737Independent Call Girls Andheri Nightlaila 9967584737
Independent Call Girls Andheri Nightlaila 9967584737
 
Intro to BCG's Carbon Emissions Benchmark_vF.pdf
Intro to BCG's Carbon Emissions Benchmark_vF.pdfIntro to BCG's Carbon Emissions Benchmark_vF.pdf
Intro to BCG's Carbon Emissions Benchmark_vF.pdf
 
IoT Insurance Observatory: summary 2024
IoT Insurance Observatory:  summary 2024IoT Insurance Observatory:  summary 2024
IoT Insurance Observatory: summary 2024
 

Financial Statement Analysis

  • 1. Carnival Corporation & Royal Caribbean: Financial Statement Analysis of Two Cruise Industry Giants
  • 2. The Cruise Industry  Fastest growing travel sector in the world  Only 20% of the US population has ever cruised  7.2% annual passenger growth rate since 1990  15 million passengers cruised in 2010  Generated more than $26 billion in revenue worldwide in 2010  Carnival Corporation (98 ships) controls 51.6% of worldwide share of revenue  Royal Caribbean (40 ships) controls 25.6% of worldwide share of revenue
  • 3. Carnival Business Strategies  Largest cruise company with 98 ships  10 more ships to be put into service by 2014  Comprises 9 different brands  Each brand is separately managed  Keep costs down by selling cruises mostly through wholesalers  Aim to be the most well-known cruise line serving the greatest number of guests at an unrivalled price  Low cost leader
  • 4. Royal Caribbean Business Strategies  Second largest cruise company with 40 ships  2 more ships scheduled to be delivered by 2012  6 cruise brands including one in French market, one in Spanish market, and one in German market  Upscale ships with innovative onboard activities, fine dining, spa services, and personalized service  400 destinations  Differentiation strategy
  • 5. Financial Ratios - Liquidity (in millions) 2010 2009 2008 2007 2006 Carnival Cruises Liquidity Ratios Current Ratio 0.216 0.306 0.285 0.272 0.368 Quick Ratio 0.118 0.181 0.185 0.190 0.266 Net Working Capital Ratio (0.120) (0.094) (0.124) (0.155) (0.112) Operating Cash Flow 0.663 0.673 0.587 0.560 0.671 Cash from Operations to Total Debt 0.264 0.226 0.237 0.286 0.294 Free Operating Cash Flow to Total Debt 0.017 (0.003) 0.003 0.053 0.093 2010 2009 2008 2007 2006 Royal Caribbean Liquidity Ratios Current Ratio 0.295 0.373 0.365 0.424 0.268 Quick Ratio 0.199 0.227 0.252 0.233 0.155 Net Working Capital Ratio 0.295 0.373 0.365 0.424 0.268 Operating Cash Flow 0.483 0.307 0.401 0.542 0.507 Cash from Operations to Total Debt 0.142 0.079 0.111 0.154 0.130 Free Operating Cash Flow to Total Debt (0.045) (0.152) (0.119) (0.006) (0.032)
  • 6. Financial Ratios – Profitability Carnival Cruises Profitability Analysis Ratios 2010 2009 2008 2007 2006 ROA 5.323% 5.097% 6.895% 7.440% 7.738% RNOA 6.835% 6.412% 8.599% 9.446% 18.874% NOAT 44.881% 42.133% 49.490% 47.503% 90.870% NOPM 15.229% 15.218% 17.375% 19.885% 20.770% ROE 8.777% 8.703% 11.930% 12.616% 12.988% Profit Margin 13.671% 13.605% 15.909% 18.476% 19.250% Royal Caribbean Profitability Analysis Ratios 2010 2009 2008 2007 2006 ROA 2.887% 0.936% 3.649% 4.253% 5.144% RNOA 3.303% 0.985% 3.882% 5.023% 11.020% NOAT 40.739% 35.710% 44.207% 51.187% 90.907% NOPM 8.108% 2.758% 8.783% 9.813% 12.122% ROE 7.091% 2.271% 8.462% 9.392% 10.886% Profit Margin 8.108% 2.758% 8.783% 9.813% 12.122%
  • 7. Financial Ratios – Activity & Leverage Activity Analysis Ratios 2010 2009 2008 2007 2006 Assets Turnover 0.389 0.375 0.433 0.403 0.402 Carnival Cruises Leverage Ratios 2010 2009 2008 2007 2006 Debt to Equity 0.628 0.672 0.749 0.712 0.678 Long Term Debt to Equity 0.348 0.413 0.405 0.316 0.349 Debt Ratio 0.386 0.402 0.428 0.416 0.404 Times Interest Earned 6.209 5.668 6.592 7.425 8.375 Activity Analysis Ratios 2010 2009 2008 2007 2006 Asset Turnover 0.343 0.323 0.397 0.410 0.390 Leverage Ratios 2010 2009 2008 2007 2006 Royal Caribbean Debt to Equity 1.480 1.431 1.420 1.217 1.199 LT Debt to Equity 1.046 1.065 1.027 0.871 0.891 Debt Ratio 0.597 0.589 0.587 0.549 0.545 Times Interest Earned 2.613 1.541 2.753 2.808 3.367
  • 8. Carnival Forecasting and Equity Value (millions) 2010 2011 2012 Net Sales Growth 5.30% 4.70% Net Sales (Unrounded) 14,469.00 15,235.86 15,951.94 Net Sales (Rounded) 14,469.00 15,236.00 15,952.00 NOPAT 2,203.48 2,082.85 2,180.74 NOA 32,395.00 33,947.46 35,542.78 Book Value Multiple Forecasting: Equity Instrinsic Value $20,829,114,240.39 Equity Intrinsic Value per Share: $34.72 Residual Operating Income Model: Firm Equity Value: $17,271,800,744.12 Equity Value per Share: $28.79 Current Share Price: $30.65
  • 9. Royal Caribbean Forecasting and Equity Value (millions) 2010 2011 2012 Net Sales Growth 5.00% 5.00% Net Sales (Unrounded) 6,752.50 7,090.13 7,444.64 Net Sales (Rounded) 6,752.00 7,090.00 7,445.00 NOPAT 547.47 574.29 603.05 NOA 17,197.03 17,420.15 18,292.38 Book Value Multiple Forecasting: Equity Instrinsic Value $8,693,409,826.43 Equity Intrinsic Value per Share: $38.43 Residual Operating Income Model: Firm Equity Value: $3,507,062,994.13 Equity Value per Share: $15.50 Current Share Price: $24.03
  • 10. Recommendations  For creditors, Carnival is less risky  For investors,  Carnival is more likely for stable returns and continued growth - larger customer base - already dominates cruise market - strategically positioned as low-cost leader  Royal Caribbean is more risky but has potential for excellent returns in the future if economy improves - aggressive global expansion - innovations & investment in technology to improve fuel efficiency - differentiation of cruise options - luxury market is more affected by economic instability
  • 11. Interesting Facts  Carnival: Carnival’s ships are among the biggest in the world in order to accommodate the greatest number of passengers per voyage. For example, the Liberty is taller than the Statue of Liberty and longer than 3 football fields.  Royal Caribbean: Royal Caribbean is incorporated in Liberia so, under Section 883 of IRS Code, it is not subject to US federal income tax on US source income derived from the international operation of ships. It is subject to certain miscellaneous income taxes, such as gambling income in Alaska, but they are immaterial and not included on financial statements.