Mixin Classes in Odoo 17 How to Extend Models Using Mixin Classes
Bank of baroda_q4_fy10
1. Result Update (Q4 FY10) April 29, 2010
Bank of Baroda - BUY
CMP Rs687, Target Rs761
Sector: Banking NII was up 19%yoy, net profit excluding exceptional gains, was
Sensex: 17,380 up 9.6%yoy, albeit declined 1% sequentially.
Non-interest income declined 10%yoy, Cost-to-income ratio
CMP (Rs): 687
lowest in past several quarters.
Target price (Rs): 761
Loan book grew 22%yoy; international book reported a sturdy
Upside (%): 11.0
25%yoy growth. Deposits growth, however, outpaced loan
52 Week h/l (Rs): 689 / 298 growth. LDR remains comfortable at 72.6%.
Market cap (Rscr) : 25,016 Asset quality deteriorates sequentially; coverage ratio remains
6m Avg vol (‘000Nos): 927 adequate
No of o/s shares (mn): 364 Comfortable capital, best in class returns ratio, Maintain BUY.
FV (Rs): 10
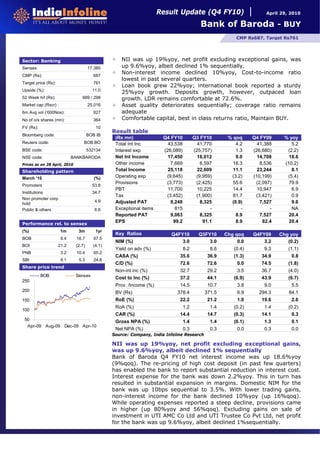
Result table
Bloomberg code: BOB IB
(Rs mn) Q4 FY10 Q3 FY10 % qoq Q4 FY09 % yoy
Reuters code: BOB.BO Total Int Inc 43,538 41,770 4.2 41,388 5.2
BSE code: 532134 Interest exp (26,089) (25,757) 1.3 (26,680) (2.2)
NSE code: BANKBARODA Net Int Income 17,450 16,012 9.0 14,708 18.6
Prices as on 28 April, 2010 Other income 7,669 6,597 16.3 8,536 (10.2)
Shareholding pattern Total Income 25,118 22,609 11.1 23,244 8.1
March '10 (%) Operating exp (9,645) (9,959) (3.2) (10,199) (5.4)
Provisions (3,773) (2,425) 55.6 (2,097) 79.9
Promoters 53.8
PBT 11,700 10,225 14.4 10,947 6.9
Institutions 34.7
Tax (3,452) (1,900) 81.7 (3,421) 0.9
Non promoter corp
4.9 Adjusted PAT 8,248 8,325 (0.9) 7,527 9.6
hold
Public & others 6.6 Exceptional items 815 - - - NA
Reported PAT 9,063 8,325 8.9 7,527 20.4
Performance rel. to sensex
EPS 99.2 91.1 8.9 82.4 20.4
(%) 1m 3m 1yr
Key Ratios Q4FY10 Q3FY10 Chg qoq Q4FY09 Chg yoy
BOB 9.4 16.7 67.5
NIM (%) 3.0 3.0 0.0 3.2 (0.2)
BOI 21.2 (2.7) (4.1)
Yield on adv (%) 8.2 8.6 (0.4) 9.3 (1.1)
PNB 3.2 10.4 65.2
CASA (%) 35.6 36.9 (1.3) 34.9 0.8
SBI 9.1 5.3 24.6
C/D (%) 72.6 72.6 0.0 74.5 (1.8)
Share price trend
Non-int inc (%) 32.7 29.2 3.5 36.7 (4.0)
BOB Sensex
Cost to Inc (%) 37.2 44.1 (6.9) 43.9 (6.7)
250
Prov. /Income (%) 14.5 10.7 3.8 9.0 5.5
200 BV (Rs) 378.4 371.5 6.9 294.3 84.1
150 RoE (%) 22.2 21.2 1.0 19.6 2.6
RoA (%) 1.2 1.4 (0.2) 1.4 (0.2)
100
CAR (%) 14.4 14.7 (0.3) 14.1 0.3
50 Gross NPA (%) 1.4 1.4 (0.1) 1.3 0.1
Apr-09 Aug-09 Dec-09 Apr-10
Net NPA (%) 0.3 0.3 0.0 0.3 0.0
Source: Company, India Infoline Research
NII was up 19%yoy, net profit excluding exceptional gains,
was up 9.6%yoy, albeit declined 1% sequentially
Bank of Baroda Q4 FY10 net interest income was up 18.6%yoy
(9%qoq). The re-pricing of high cost deposit (in past few quarters)
has enabled the bank to report substantial reduction in interest cost.
Interest expense for the bank was down 2.2%yoy. This in turn has
resulted in substantial expansion in margins. Domestic NIM for the
bank was up 10bps sequential to 3.5%. With lower trading gains,
non-interest income for the bank declined 10%yoy (up 16%qoq).
While operating expenses reported a steep decline, provisions came
in higher (up 80%yoy and 56%qoq). Excluding gains on sale of
investment in UTI AMC Co Ltd and UTI Trustee Co Pvt Ltd, net profit
for the bank was up 9.6%yoy, albeit declined 1%sequentially.
2. Bank of Baroda – (Q4 FY10)
Non-interest income declined 10%yoy, Cost-to-income ratio lowest in past several quarters
Bank of Baroda reported a steep 10%yoy decline in its non-interest income. While fee income grew at
a modest pace 8%yoy growth rate, the bank reported 58%yoy decline in trading income. The recovery
mechanism adopted in the recent times enabled the bank to report 43%yoy rise in recovery from
previous write-offs. We expect the bank to witness 16%CAGR in non-interest income over FY10-12E.
For the quarter ended Q4 FY10, the bank reported substantial decline in its operating cost. Operating
expenses were down 5%yoy and 3%qoq. This is commendable as the bank added over 178 branches
and 136 ATM’s during the year. Of this, over 50branches and 77 ATM’s were added during the quarter.
Cost-to-income ratio for the bank at 38.4% is the lowest in past several quarters.
Loan book grew 22%yoy; international book reported a sturdy 25%yoy growth.
As against the system credit growth of 16.7%yoy as at March 2010, the bank reported a healthy
22%yoy growth in its loan book. Even on a sequential basis, the loan book was up 12%. This growth in
loan book was led by sturdy 25%yoy (8%qoq) rise in international loans. The share of international
loans in total loan book has now increased to 24.8% as against 24.2% as at end FY09. We expect the
share to remain at current levels in coming period as margin on this book has remained low at 1.4%.
On the other hand, domestic book, too reported a healthy 21%yoy (13.5%qoq) growth. Amongst the
domestic book, retail loan book was up 23.5%yoy, SME (excluding retail) was up 28%yoy. While the
proportion of retail book in total book stood at 18.2%, the proportion of home loans in total domestic
book stands at 7.8%. The agriculture book was up 29%yoy, largely due to year-end phenomenon.
Gross NPA on agriculture portfolio has remained at elevated levels of 3.3% as against 1.7% as at FY09.
We expect the bank to witness 22% CAGR in loans over FY10-12E.
Deposit growth outpaces loan growth; international deposit grew 36%yoy; CASA deposits,
too reported a healthy 25%yoy rise.
The bank reported a healthy 25.3%yoy (12.1%qoq) rise in deposit growth. The C/D ratio for the bank
remained at comfortable levels of 73%. The re-pricing of high cost-of-deposits during the past few
quarters had enabled the bank to report substantial reduction in cost-of-deposits. Domestic cost-of-
deposits have declined from 6.5% as at end FY09 to 5.6% as at end FY10 (down ~80bps), albeit rose
sequentially. Given the rising interest scenario, interest cost is set to rise. International deposits grew
36%yoy (14% sequentially). CASA deposits, on the other hand reported 25%yoy (7.6%qoq) growth.
CASA ratio for the bank now stands at 35.6%.
Asset quality deteriorates sequentially; coverage ratio remains adequate
Gross NPL for the bank were up 6.2%qoq (30.3%yoy) to Rs24bn or 1.36% of total loans. Net NPL too
grew 33.5%yoy (23.5%qoq) to Rs6bn or 0.34% of total loans. Interestingly, Gross and Net NPA on
international book has remained low at 0.47% and 0.11% respectively. We however remain
comfortable with bank’s asset quality and expect minimal accretion in coming quarters. Credit cost for
the bank too rose to 6bps as at end FY10. We have factored in 9% CAGR in loan loss provision over
FY10-12E. The bank restructured Rs4.6bn of loans during the quarters, taking the total loan
restructured to Rs51bn. This, however, remains minimal when compared with peers. Provision
coverage ratio for the bank has remained comfortable at 74.9% levels.
Comfortable capital, best in class returns ratio, Maintain BUY.
The bank remains adequately capitalized with CAR at 14.4% an Tier I ratio at 9.3%. It has raised over
Rs9bn of Tier I capital (innovative perpetual bond) and Rs10bn of Tier II bond since the beginning of
the year. In a recent interview, the bank management had indicated a comfortable CAR of 13-13.5%
Returns ratio for the bank remains amongst the best with RoE at 23.7% and RoA of 1.2% as at end
FY10. We continue to like the bank and expect it to command premium valuation as against its peers
on expectations of higher loan growth, better returns ratio and minimal concerns over asset quality.
We have raised our FY11 and FY12 net profit estimates by 6% and 13% respectively. The bank has
outperformed its peers and Sensex over the past three-six months and currently trades at cheap
valuation of 1.2x FY12 PB. We expect the valuations to re-rate further and have assigned a 1.4x FY12
PB multiple to arrive at a fair value of Rs761. Maintain BUY.
Result Update 2
3. Bank of Baroda – (Q4 FY10)
Peer comparison (Q4 FY10)
Key Ratios BoB Corp Bank
NIM (%) 2.5 3.0
CASA (%) 28.6 35.6
C/D (%) 68.2 72.6
Non-interest income (%) 42.6 30.5
Cost to Income (%) 40.3 38.4
BV (Rs) 402.6 378.4
RoE (%) 20.3 22.2
RoA (%) 1.3 1.2
CAR (%) 15.4 14.4
Gross NPA (%) 1.0 1.4
Net NPA (%) 0.3 0.3
Source: Companies, India Infoline Research
Financial summary
Y/e 31 Mar (Rs m) FY09 FY10A FY11E FY12E
Total operating income 78,811 87,458 109,036 134,176
yoy growth (%) 32.2 11.0 24.7 23.1
Operating profit (pre-provisions) 43,050 49,353 61,414 75,095
Net profit 22,272 30,583 32,650 40,122
yoy growth (%) 55.1 37.3 6.8 22.9
EPS (Rs) 60.9 83.7 89.3 109.8
BVPS (Rs) 282 397 470 564
P/E (x) 11.3 8.2 7.7 6.2
P/BV (x) 2.4 1.7 1.5 1.2
ROE (%) 22.3 23.7 19.9 20.7
ROA (%) 1.1 1.2 1.1 1.1
Dividend yield (%) 1.3 2.2 2.2 2.2
CAR (%) 14.1 14.4 13.0 12.3
Tier I (%) 8.5 9.3 9.0 8.8
Source: Company, India Infoline Research
Result Update 3