Toronto Real Estate Statistics September 2010
•
0 gefällt mir•248 views

Complete report on all MLS resale home transactions for the GTA for the month of September.

Empfohlen
Weitere ähnliche Inhalte
Was ist angesagt?
Was ist angesagt? (15)
Andere mochten auch
Andere mochten auch (9)
Ähnlich wie Toronto Real Estate Statistics September 2010
Ähnlich wie Toronto Real Estate Statistics September 2010 (20)
Mehr von John Helfrich
Mehr von John Helfrich (20)
Kürzlich hochgeladen
Kürzlich hochgeladen (20)
Toronto Real Estate Statistics September 2010
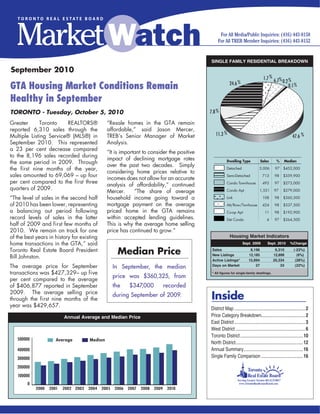
- 1. September 2001 Fifth Straight Record Breaking Month TORONTO — Wednesday, Oct. 3, 2001. districts and averaged $225,826; 708 sales were repor ted in the 14 Central The Toronto Real Estate Board’s (TREB) districts and averaged $336,598; 1,074 September sales statistics indicate that sales were repor ted in the 23 North there are no signs of an economic districts and averaged $272,782; and slowdown in the housing market, TREB 1,362 sales were repor ted in TREB's 21 President David Pearce announced East districts and averaged $203,859. today. “With a total of 5,021 sales, up 3% from the same time last year, we not Neighbourhood Corner only broke previous records for September, we continued a five month Rosedale streak of record breaking months," said The Rosedale market has remained Mr. Pearce. stable thus far in 2001. Over the June Number of MLS Sales 9000 Prices fell slightly in September, to September period, the average price 8000 S.F.D P.O.T. down 1% to $245,530 from the August of detached homes has been 7000 figure of $247,472, and also down 1% $1,424,026 on the basis of 19 sales, 6000 from the $248,604 recorded in 5000 down 2% from the $1,449,915 September 2000. 4000 recorded during the same time last 3000 "Right now we have the best of both year. Time-on-Market was 68 days, and 2000 worlds--a breakneck sales pace without the most expensive home in the area 1000 wild price increases," the President noted. 0 Breaking down the total, 1,877 sold for just over $5,000,000. Jan Feb Mar Apr May June July Aug Sept Oct Nov Dec sales were repor ted in TREB's 28 West Number of New MLS Listings 30000 25000 Single-Family Residential Breakdown 20000 Dwelling Type Sales Median 15000 3.7% 4.9% 20.6% 0.2% Single Detached 2,467 $260,000 10000 0.2% Semi Detached 511 215,000 5000 Condo T.H. 563 170,000 0 Jan Feb Mar Apr May June July Aug Sep Oct Nov Dec Condo Apt. 1,033 163,500 11.2% Link 186 220,000 Attached/Row 245 198,900 35000 Number of Active MLS Listings Co-op Apt. 8 157,500 30000 10.2% 49.1% Detached Condo 8 180,500 25000 20000 15000 10000 Housing Market Indicators 5000 September 2000 September 2001 % Change Sales* 4,857 5,021 (+3%) 0 Jan Feb Mar Apr May June July Aug Sep Oct Nov Dec Sales (P.O.T.) 976 832 (-15%) New Listings* 8,215 8,584 (+4%) Active Listings** 19,647 19,037 (-3%) * Single-Family Dwellings Only ** Properties All Types including Single-Family Dwellings.
- 2. 2 Single-Family Dwelling Sales Comparison 8000 2000 2001 7000 6000 5000 4000 3000 2000 1000 0 Jan Feb Mar Apr May June July Aug Sept Oct Nov Dec Price Category Breakdown — September Price Range Total S.F.D. Condo Apt. Condo T.H. Up to $90,000 46 (0.9) 27 (2.6) 7 (1.2) 90,001 to 110,000 118 (2.3) 65 (6.3) 22 (3.9) 110,001 to 120,000 89 (1.8) 47 (4.6) 16 (2.8) 120,001 to 130,000 149 (3.0) 87 (8.4) 23 (4.1) 130,001 to 140,000 188 (3.7) 82 (7.9) 40 (7.1) 140,001 to 150,000 235 (4.7) 98 (9.5) 55 (9.8) 150,001 to 160,000 232 (4.6) 88 (8.5) 50 (8.9) 160,001 to 170,000 269 (5.4) 100 (9.7) 69 (12.3) 170,001 to 180,000 270 (5.4) 75 (7.3) 50 (8.9) 180,001 to 190,000 302 (6.0) 54 (5.2) 53 (9.4) 190,001 to 200,000 241 (4.8) 40 (3.9) 29 (5.2) 200,001 to 225,000 617 (12.3) 79 (7.6) 77 (13.7) 225,001 to 250,000 590 (11.8) 60 (5.8) 36 (6.4) 250,001 to 300,000 684 (13.6) 57 (5.5) 18 (3.2) 300,001 to 400,000 622 (12.3) 51 (4.9) 13 (2.3) 400,001 to 500,000 189 (3.8) 12 (1.2) 4 (0.7) 500,001 to 750,000 120 (2.4) 3 (0.3) 1 (0.1) 750,000 to 1,000,000 37 (0.7) 2 (0.2) — (—) 1,000,001 to 1,500,000 15 (0.3) 6 (0.6) — (—) Over 1,500,000 8 (0.2) — (—) — (—) Total 5,021 100.0 1,033* 100.0 563** 100.0 * 1,033 condominium apartments sold for $191,572,782, averaging $185,452 ** 563 condominium townhouses sold for $101,226,996 averaging $179,799.
- 3. 3a Single-Family Residential September 2001 Area Listed Re-runs Sales Dollar Volume Av. Price Med. Price East E-1 214 107 49 11,662,148 238,003 228,000 E-2 183 93 44 14,403,400 327,350 287,500 E-3 244 117 87 18,539,015 213,092 212,000 E-4 195 97 62 11,727,182 189,148 197,550 E-5 294 149 94 21,350,950 227,138 221,500 E-6 133 64 38 9,057,106 238,345 221,453 E-7 245 116 90 18,653,628 207,263 196,750 E-8 230 109 78 15,712,350 201,440 178,500 E-9 174 81 70 13,473,649 192,481 190,000 E-10 189 109 36 9,512,400 264,233 259,450 E-11 190 98 75 13,484,300 179,791 175,100 E-12 80 49 19 3,856,500 202,974 199,000 E-13 291 164 69 14,506,850 210,244 209,500 E-14 323 179 108 21,792,805 201,785 191,500 E-15 330 198 108 23,249,450 215,273 214,300 E-16 509 241 168 24,683,890 146,928 137,750 E-17 260 139 96 17,157,800 178,727 170,000 E-18 22 15 6 1,561,500 260,250 235,000 E-19 54 36 11 3,318,400 301,673 261,000 E-20 48 20 20 3,778,900 188,945 180,000 E-21 101 50 34 6,173,400 181,571 183,000 Total 4,309 2,231 1,362 $277,655,623 $203,859 $190,750 West W-1 114 54 23 $5,670,000 246,522 235,000 W-2 203 106 34 9,369,600 275,576 242,500 W-3 201 90 49 9,120,500 186,133 182,500 W-4 189 109 57 11,039,032 193,667 181,000 W-5 190 93 83 13,764,200 165,834 145,000 W-6 267 142 40 9,262,000 231,550 229,500 W-7 105 58 23 7,035,435 305,888 290,100 W-8 351 181 82 27,154,600 331,154 277,000 W-9 195 96 47 11,050,088 235,108 228,000 W-10 362 228 94 17,059,213 181,481 149,250 W-12 216 124 58 13,949,550 240,509 214,000 W-13 240 126 71 21,044,811 296,406 220,000 W-14 143 69 42 8,828,705 210,207 213,250 W-15 238 97 102 16,913,900 165,823 155,000 W-16 270 130 71 18,980,238 267,327 225,000 W-17 1 - - - - - W-18 86 33 30 5,316,400 177,213 189,950 W-19 611 310 171 40,802,000 238,608 224,000 W-20 679 381 201 47,915,939 238,388 222,000 W-21 180 95 53 15,128,240 285,438 241,890 W-22 11 7 6 1,228,000 204,667 182,500 W-23 743 373 201 43,407,813 215,959 205,000 W-24 559 265 181 35,710,416 197,295 195,000 W-25 36 14 16 3,361,000 210,063 192,250 W-26 4 3 - - - - W-27 203 85 54 11,882,250 220,042 205,000 W-28 225 132 37 9,975,800 269,616 237,500 W-29 124 50 51 8,905,800 174,624 165,000 Total 6,746 3,451 1,877 $423,875,530 $225,826 $206,000 See 3b…
- 4. 3b Single-Family Residential continued September 2001 Area Listed Re-runs Sales Dollar Volume Av. Price Med. Price Central C-1 482 268 97 26,519,500 273,397 235,000 C-2 215 119 40 16,203,700 405,093 302,950 C-3 219 120 32 12,734,400 397,950 246,000 C-4 331 175 53 22,311,423 420,970 406,000 C-6 63 38 11 2,913,900 264,900 270,000 C-7 169 89 58 16,549,550 285,337 260,500 C-8 347 200 91 20,161,100 221,551 190,000 C-9 113 63 15 10,119,750 674,650 365,000 C-10 217 102 43 19,017,314 442,263 318,503 C-11 107 59 34 7,700,950 226,499 156,500 C-12 189 119 28 26,942,900 962,246 625,500 C-13 144 75 37 10,095,550 272,853 268,000 C-14 291 147 84 23,789,909 283,213 248,250 C-15 274 142 85 23,251,499 273,547 256,500 Total 3,161 1,716 708 $238,311,445 $336,598 $258,950 North N-1 203 115 55 15,645,730 284,468 267,900 N-2 291 184 66 20,001,468 303,053 271,500 N-3 430 252 111 35,972,494 324,077 262,000 N-4 240 124 74 23,471,630 317,184 311,000 N-5 56 31 15 5,040,100 336,007 330,000 N-6 200 115 66 18,735,600 283,873 232,500 N-7 222 110 94 22,964,500 244,303 233,000 N-8 429 215 106 32,740,668 308,874 287,000 N-10 250 129 73 21,591,600 295,775 268,500 N-11 452 254 113 36,232,988 320,646 315,000 N-12 73 43 13 3,546,950 272,842 249,000 N-13 51 37 9 3,773,500 419,278 425,000 N-14 117 80 11 3,538,018 321,638 270,000 N-15 75 43 23 5,291,800 230,078 220,000 N-16 85 45 17 4,685,900 275,641 267,000 N-17 230 119 81 13,854,550 171,044 159,000 N-18 139 77 23 4,015,530 174,588 172,500 N-19 118 61 27 5,068,000 187,704 178,000 N-20 19 10 4 1,180,900 295,225 252,950 N-21 19 10 7 1,277,800 182,543 186,500 N-22 40 20 16 2,699,100 168,694 151,250 N-23 111 45 51 8,674,782 170,094 170,000 N-24 70 35 19 2,964,000 156,000 150,000 Total 3,920 2,154 1,074 $292,967,608 $272,782 $249,650 Grand Total 18,136 9,552 5,021 $1,232,810,206 $245,530 $216,000 Listed includes Reruns: East (2,231-52%) West (3,451-51%) Central (1,716-54%) North (2,154-55%) * Sales to Listings Ratio (SFD only): 28% AVERAGE DAYS ON MARKET AVERAGE LIST TO SALE PRICE RATIO EAST 38 97% WEST 42 97% CENTRAL 38 98% NORTH 48 97% TOTAL 42 97% * Please note that the market information represents only those sales reported through the Toronto Real Estate Board.
- 5. 4a Nine Month Single-Family January to September 2001 Area Listed Sales Dollar Volume Av. Price Med. Price East E-1 1,770 567 $134,379,228 $237,000 $220,000 E-2 1,857 583 168,891,999 289,695 260,000 E-3 2,686 988 207,598,193 210,120 204,000 E-4 1,570 608 111,037,807 182,628 186,000 E-5 2,664 1,012 222,216,314 219,581 206,000 E-6 1,263 362 86,520,144 239,006 210,000 E-7 2,297 927 201,006,072 216,835 212,500 E-8 2,115 721 144,577,485 200,524 185,000 E-9 1,933 739 138,718,700 187,711 191,925 E-10 1,598 478 116,592,994 243,918 237,700 E-11 2,234 790 141,265,499 178,817 175,000 E-12 663 207 40,493,653 195,622 186,000 E-13 2,987 896 195,820,243 218,549 211,750 E-14 3,316 1,042 210,537,927 202,052 192,000 E-15 3,086 980 205,687,072 209,885 203,000 E-16 4,618 1,677 243,323,115 145,094 138,000 E-17 2,552 863 143,646,871 166,451 160,000 E-18 195 30 9,838,000 327,933 298,500 E-19 445 109 26,041,624 238,914 223,000 E-20 546 158 30,173,670 190,973 185,000 E-21 956 277 55,845,934 201,610 184,500 Total 41,351 14,014 $2,834,212,544 $202,242 N/A West W-1 1,273 333 $96,668,639 $290,296 $263,000 W-2 1,615 437 118,032,339 270,097 246,500 W-3 2,049 503 94,266,138 187,408 182,000 W-4 1,883 522 102,458,391 196,280 191,000 W-5 2,551 739 132,054,237 178,693 173,000 W-6 2,467 570 145,460,806 255,194 227,900 W-7 1,000 276 85,760,338 310,726 293,250 W-8 3,169 887 313,788,300 353,764 287,500 W-9 1,429 420 94,499,279 224,998 213,500 W-10 3,601 878 155,872,414 177,531 150,000 W-12 2,125 596 145,516,743 244,156 220,000 W-13 2,619 737 230,000,729 312,077 250,000 W-14 1,503 495 100,248,130 202,521 198,500 W-15 2,538 1,087 182,830,745 168,198 153,000 W-16 2,574 843 204,611,042 242,718 225,000 W-17 11 - - - - W-18 1,095 286 51,505,900 180,091 185,500 W-19 5,718 1,710 416,940,917 243,825 230,500 W-20 6,704 1,846 443,880,200 240,455 225,000 W-21 1,692 487 155,473,841 319,248 263,000 W-22 77 17 4,334,900 254,994 197,000 W-23 7,404 2,236 473,352,363 211,696 198,000 W-24 5,487 1,776 356,210,548 200,569 193,500 W-25 296 90 20,584,500 228,717 185,500 W-26 23 5 2,138,000 427,600 400,000 W-27 1,880 607 138,440,237 228,073 215,000 W-28 2,098 509 145,642,957 286,135 260,000 W-29 1,325 402 72,316,021 179,891 168,750 Total 66,206 19,294 $4,482,888,654 $232,346 N/A See 4b…
- 6. 4b Nine Month Single-Family continued January to September 2001 Area Listed Sales Dollar Volume Av. Price Med. Price Central C-1 4,103 1,257 $316,343,509 $251,665 $220,000 C-2 2,040 523 206,529,128 394,893 302,000 C-3 1,774 414 208,119,343 502,704 316,200 C-4 3,146 771 357,522,579 463,713 410,250 C-6 652 152 47,723,734 313,972 281,000 C-7 2,033 590 159,922,986 271,056 257,000 C-8 2,787 823 195,032,059 236,977 214,000 C-9 1,098 254 175,529,867 691,062 549,000 C-10 1,915 521 242,904,992 466,228 336,814 C-11 833 336 89,010,490 264,912 210,750 C-12 1,965 309 234,019,171 757,344 587,500 C-13 1,174 437 117,874,110 269,735 252,000 C-14 2,623 811 234,535,369 289,193 249,500 C-15 2,666 915 248,818,041 271,932 250,000 Total 28,809 8,113 $2,833,885,378 $349,302 N/A North N-1 2,142 607 $176,948,963 $291,514 $268,750 N-2 3,004 739 224,689,684 304,046 273,000 N-3 3,888 1,007 306,027,993 303,901 258,950 N-4 2,538 709 222,710,100 314,119 295,000 N-5 679 142 44,861,367 315,925 277,000 N-6 2,066 620 175,545,449 283,138 240,000 N-7 2,481 873 209,237,750 239,677 225,000 N-8 4,216 1,020 305,747,017 299,752 280,000 N-10 2,212 670 189,920,851 283,464 269,000 N-11 4,278 1,162 361,552,076 311,146 293,694 N-12 577 138 42,251,140 306,168 267,500 N-13 395 70 27,252,973 389,328 338,000 N-14 921 152 63,859,251 420,127 342,500 N-15 703 206 49,943,650 242,445 222,250 N-16 722 195 49,601,763 254,368 235,000 N-17 2,234 674 112,297,389 166,613 157,000 N-18 823 238 45,290,530 190,296 180,000 N-19 1,130 349 64,885,598 185,919 173,000 N-20 181 46 12,999,300 282,593 269,900 N-21 188 54 10,083,200 186,726 188,500 N-22 402 151 22,908,250 151,710 138,000 N-23 1,058 310 53,138,726 171,415 165,900 N-24 659 136 21,090,200 155,075 140,000 Total 37,497 10,268 $2,792,843,220 $271,995 N/A Grand Total 173,863 51,689 $12,943,829,796 $250,417 N/A Includes Re-runs: East 19,802 West 37,526 Central 15,561 North 19,883 * Please note that the market information represents only those sales reported through the Toronto Real Estate Board.
- 7. 5 Single-Family East Breakdown September 2001 Detached Houses Semi-Detached Houses Sales Av. Price Med. Price Sales Av. Price Med. Price E-1 10 231,900 236,000 29 239,888 228,000 E-2 19 433,026 410,000 19 240,626 237,100 E-3 40 246,108 237,000 17 246,335 232,000 E-4 31 233,153 231,500 4 188,275 190,500 E-5 26 293,146 294,900 10 256,200 240,900 E-6 32 247,288 230,950 2 189,000 189,000 E-7 21 280,801 271,000 6 235,467 229,000 E-8 37 262,092 223,500 1 172,000 172,000 E-9 30 246,438 236,000 2 204,500 204,500 E-10 29 283,755 278,000 2 249,250 249,250 E-11 16 236,838 222,500 8 189,500 187,500 E-12 11 232,173 209,000 1 178,100 178,100 E-13 28 261,202 249,950 5 207,080 210,000 E-14 67 226,068 227,855 6 178,167 181,000 E-15 73 236,673 232,500 4 164,350 158,750 E-16 98 163,768 157,250 31 131,474 132,000 E-17 44 200,583 187,125 6 132,583 140,500 E-18 6 260,250 235,000 - - - E-19 10 314,040 268,250 - - - E-20 20 188,945 180,000 - - - E-21 34 181,571 183,000 - - - Townhouse Condominiums Condominium Apartments Link Houses Sales Av. Price Med. Price Sales Av. Price Med. Price Sales Av. Price Med. Price E-1 1 165,000 165,000 2 273,000 273,000 - - - E-2 - - - 3 248,000 285,000 - - - E-3 1 217,500 217,500 27 141,541 133,500 - - - E-4 2 166,250 166,250 25 136,554 143,500 - - - E-5 19 189,053 186,000 31 182,969 183,800 4 258,525 251,400 E-6 2 221,950 221,950 2 161,000 161,000 - - - E-7 13 199,350 192,000 39 162,221 161,000 5 238,780 226,400 E-8 5 164,500 165,000 33 139,158 140,000 1 236,250 236,250 E-9 10 155,630 157,500 28 146,971 141,800 - - - E-10 1 145,000 145,000 2 127,500 127,500 - - - E-11 17 176,300 165,000 22 131,218 134,500 5 214,200 213,000 E-12 3 147,000 135,500 1 128,000 128,000 2 206,250 206,250 E-13 15 164,733 165,000 8 150,975 138,900 7 200,071 194,500 E-14 11 149,264 143,000 12 146,196 138,700 1 172,000 172,000 E-15 7 142,214 145,000 - - - 12 192,950 192,500 E-16 19 95,900 102,500 4 93,725 83,000 12 148,367 152,200 E-17 6 147,417 150,000 - - - 31 172,021 172,500 E-18 - - - - - - - - - E-19 - - - - - - - - - E-20 - - - - - - - - - E-21 - - - - - - - - - Attached/Row Co-op Apartments Detached Condominiums Sales Av. Price Med. Price Sales Av. Price Med. Price Sales Av. Price Med. Price E-1 7 239,343 230,000 - - - - - - E-2 3 286,667 290,000 - - - - - - E-3 2 233,950 233,950 - - - - - - E-4 - - - - - - - - - E-5 4 217,250 216,500 - - - - - - E-6 - - - - - - - - - E-7 6 205,325 207,850 - - - - - - E-8 1 192,000 192,000 - - - - - - E-9 - - - - - - - - - E-10 2 192,500 192,500 - - - - - - E-11 6 173,500 173,750 - - - 1 183,000 183,000 E-12 1 143,000 143,000 - - - - - - E-13 6 179,750 177,000 - - - - - - E-14 9 190,389 189,000 - - - 2 147,750 147,750 E-15 12 167,000 165,750 - - - - - - E-16 4 145,373 142,000 - - - - - - E-17 9 146,611 147,000 - - - - - - E-18 - - - - - - - - - E-19 1 178,000 178,000 - - - - - - E-20 - - - - - - - - - E-21 - - - - - - - - -
- 8. 6 Single-Family Central Breakdown September 2001 Detached Houses Semi-Detached Houses Sales Av. Price Med. Price Sales Av. Price Med. Price C-1 4 374,250 369,500 5 287,200 240,000 C-2 11 425,436 300,900 11 387,855 269,000 C-3 18 484,000 295,000 9 352,878 245,000 C-4 40 469,683 439,500 5 330,425 335,000 C-6 9 284,889 278,000 - - - C-7 21 387,079 357,500 5 262,800 261,000 C-8 1 441,000 441,000 1 245,000 245,000 C-9 6 1,098,917 946,250 - - - C-10 20 624,690 540,500 10 305,761 296,000 C-11 10 407,020 338,100 2 298,500 298,500 C-12 17 1,268,882 817,500 - - - C-13 16 344,491 336,500 3 233,967 230,000 C-14 20 448,675 377,000 - - - C-15 29 392,547 380,000 15 262,653 258,000 Townhouse Condominiums Condominium Apartments Link Houses Sales Av. Price Med. Price Sales Av. Price Med. Price Sales Av. Price Med. Price C-1 12 265,125 247,500 70 262,986 221,000 - - - C-2 - - - 13 436,192 340,000 - - - C-3 - - - 2 217,750 217,750 - - - C-4 - - - 8 234,000 147,000 - - - C-6 - - - 2 174,950 174,950 - - - C-7 7 225,786 222,000 22 215,359 209,250 3 262,833 259,000 C-8 1 389,900 389,900 80 208,515 184,000 - - - C-9 1 750,000 750,000 4 442,813 190,125 - - - C-10 1 365,000 365,000 12 258,408 230,500 - - - C-11 1 128,000 128,000 20 132,988 123,950 - - - C-12 7 320,557 325,000 4 782,000 806,500 - - - C-13 3 197,467 205,400 15 219,293 187,000 - - - C-14 2 283,250 283,250 61 227,761 215,000 - - - C-15 14 203,446 205,000 25 181,384 165,000 2 272,500 272,500 Attached/Row Co-op Apartments Detached Condominiums Sales Av. Price Med. Price Sales Av. Price Med. Price Sales Av. Price Med. Price C-1 6 332,667 363,000 - - - - - - C-2 5 317,400 281,000 - - - - - - C-3 - - - 3 137,000 115,000 - - - C-4 - - - - - - - - - C-6 - - - - - - - - - C-7 - - - - - - - - - C-8 8 300,500 272,000 - - - - - - C-9 1 320,000 320,000 3 228,333 235,000 - - - C-10 - - - - - - - - - C-11 1 246,000 246,000 - - - - - - C-12 - - - - - - - - - C-13 - - - - - - - - - C-14 1 356,500 356,500 - - - - - - C-15 - - - - - - - - -
- 9. 7 Single-Family North Breakdown September 2001 Detached Houses Semi-Detached Houses Sales Av. Price Med. Price Sales Av. Price Med. Price N-1 18 388,429 380,750 - - - N-2 31 354,303 363,000 - - - N-3 53 445,906 398,000 4 271,450 267,900 N-4 54 353,273 335,000 8 198,000 196,500 N-5 12 361,517 368,750 1 236,900 236,900 N-6 40 339,033 272,450 8 199,088 191,500 N-7 62 281,229 261,500 4 209,725 211,000 N-8 67 357,141 325,000 17 236,547 236,000 N-10 28 359,821 347,500 1 220,000 220,000 N-11 73 357,207 340,000 5 234,960 237,500 N-12 11 296,132 250,000 - - - N-13 9 419,278 425,000 - - - N-14 11 321,638 270,000 - - - N-15 21 238,824 233,000 - - - N-16 16 280,869 286,000 - - - N-17 71 174,685 165,000 1 136,000 136,000 N-18 15 180,933 181,000 1 160,000 160,000 N-19 17 201,441 199,000 - - - N-20 4 295,225 252,950 - - - N-21 7 182,543 186,500 - - - N-22 16 168,694 151,250 - - - N-23 47 173,346 174,000 - - - N-24 17 157,735 150,000 - - - Townhouse Condominiums Condominium Apartments Link Houses Sales Av. Price Med. Price Sales Av. Price Med. Price Sales Av. Price Med. Price N-1 5 214,760 220,000 26 226,396 214,000 5 282,780 268,000 N-2 7 241,655 232,000 18 250,528 221,500 7 250,929 250,000 N-3 16 198,650 191,500 26 201,000 193,000 3 248,500 253,500 N-4 5 267,800 275,000 3 157,667 164,000 1 222,000 222,000 N-5 - - - - - - 2 232,500 232,500 N-6 6 183,500 187,000 2 215,500 215,500 2 225,500 225,500 N-7 12 155,042 158,250 5 150,000 144,000 3 184,667 184,000 N-8 6 212,333 207,500 - - - - - - N-10 - - - - - - 44 256,741 255,500 N-11 12 232,983 226,500 4 282,250 219,500 10 263,980 257,500 N-12 2 144,750 144,750 - - - - - - N-13 - - - - - - - - - N-14 - - - - - - - - - N-15 - - - 1 123,000 123,000 - - - N-16 1 192,000 192,000 - - - - - - N-17 1 142,000 142,000 - - - 2 170,500 170,500 N-18 1 123,800 123,800 - - - 6 169,622 170,190 N-19 3 145,333 145,000 - - - 3 172,500 170,000 N-20 - - - - - - - - - N-21 - - - - - - - - - N-22 - - - - - - - - - N-23 - - - - - - 1 145,500 145,500 N-24 1 160,000 160,000 - - - - - - Attached/Row Co-op Apartments Detached Condominiums Sales Av. Price Med. Price Sales Av. Price Med. Price Sales Av. Price Med. Price N-1 1 280,000 280,000 - - - - - - N-2 2 294,000 294,000 - - - 1 472,500 472,500 N-3 9 233,756 244,000 - - - - - - N-4 3 258,967 258,000 - - - - - - N-5 - - - - - - - - - N-6 8 199,825 198,500 - - - - - - N-7 8 190,613 194,500 - - - - - - N-8 16 219,806 221,000 - - - - - - N-10 - - - - - - - - - N-11 8 254,688 253,400 - - - 1 380,000 380,000 N-12 - - - - - - - - - N-13 - - - - - - - - - N-14 - - - - - - - - - N-15 1 153,500 153,500 - - - - - - N-16 - - - - - - - - - N-17 6 138,817 141,500 - - - - - - N-18 - - - - - - - - - N-19 1 142,000 142,000 - - - 3 182,667 178,000 N-20 - - - - - - - - - N-21 - - - - - - - - - N-22 - - - - - - - - - N-23 3 127,333 129,000 - - - - - - N-24 1 122,500 122,500 - - - - - -
- 10. 8 Single-Family West Breakdown September 2001 Detached Houses Semi-Detached Houses Sales Av. Price Med. Price Sales Av. Price Med. Price W-1 6 359,583 320,750 2 255,500 255,500 W-2 16 320,494 321,500 14 239,279 223,450 W-3 29 190,448 189,000 13 194,823 185,000 W-4 28 247,562 255,000 3 207,000 212,000 W-5 12 250,375 261,500 20 231,555 233,500 W-6 23 214,235 205,000 3 229,300 234,900 W-7 19 322,391 299,000 - - - W-8 42 448,690 400,000 4 239,775 241,100 W-9 20 341,500 290,000 1 247,500 247,500 W-10 39 250,999 241,000 - - - W-12 28 321,580 285,000 1 220,000 220,000 W-13 34 427,728 365,750 13 196,462 188,000 W-14 14 306,286 290,000 3 225,667 224,000 W-15 5 290,600 271,000 4 239,125 247,500 W-16 36 336,859 278,950 9 213,600 213,000 W-17 - - - - - - W-18 11 196,182 200,000 10 197,490 194,050 W-19 63 313,644 300,000 17 223,041 224,000 W-20 86 302,368 279,950 41 215,184 213,750 W-21 33 329,956 281,500 - - - W-22 3 258,500 233,000 1 185,000 185,000 W-23 119 242,183 235,000 29 191,747 188,000 W-24 84 231,104 234,000 37 202,953 208,000 W-25 10 258,350 207,750 - - - W-26 - - - - - - W-27 39 245,814 235,000 2 190,000 190,000 W-28 28 294,746 262,500 5 190,880 190,000 W-29 36 188,372 180,000 10 146,250 144,500 Townhouse Condominiums Condominium Apartments Link Houses Sales Av. Price Med. Price Sales Av. Price Med. Price Sales Av. Price Med. Price W-1 - - - 7 183,857 173,000 - - - W-2 - - - 2 265,000 265,000 - - - W-3 - - - 6 147,750 168,000 - - - W-4 4 179,250 169,500 21 121,348 124,000 - - - W-5 15 139,767 134,000 34 108,974 114,000 - - - W-6 - - - 11 256,518 239,000 - - - W-7 - - - 2 176,500 176,500 - - - W-8 6 212,250 211,500 30 202,567 177,000 - - - W-9 3 384,296 410,888 21 120,795 96,000 - - - W-10 8 147,813 148,000 47 129,527 128,000 - - - W-12 13 173,631 170,000 14 142,793 133,450 - - - W-13 20 169,403 159,000 3 130,000 125,000 - - - W-14 16 150,238 141,500 7 137,557 120,000 2 248,500 248,500 W-15 14 160,393 163,250 78 154,268 151,000 1 226,000 226,000 W-16 20 193,600 178,000 5 167,000 168,000 1 223,900 223,900 W-17 - - - - - - - - - W-18 5 148,900 147,000 4 109,750 110,750 - - - W-19 47 189,126 192,000 35 182,766 162,000 - - - W-20 61 176,439 163,900 6 140,817 134,000 - - - W-21 5 173,400 177,000 5 211,780 168,000 2 210,500 210,500 W-22 2 133,750 133,750 - - - - - - W-23 28 162,200 168,950 4 159,093 156,000 2 189,500 189,500 W-24 22 146,348 138,750 26 133,727 122,750 - - - W-25 5 116,300 120,000 - - - 1 196,000 196,000 W-26 - - - - - - - - - W-27 7 139,571 153,000 3 148,500 166,000 1 145,000 145,000 W-28 - - - - - - 2 209,500 209,500 W-29 3 121,633 129,900 - - - - - - Attached/Row Co-op Apartments Detached Condominiums Sales Av. Price Med. Price Sales Av. Price Med. Price Sales Av. Price Med. Price W-1 8 214,313 207,500 - - - - - - W-2 2 180,900 180,900 - - - - - - W-3 1 178,300 178,300 - - - - - - W-4 1 221,000 221,000 - - - - - - W-5 1 265,000 265,000 1 62,000 62,000 - - - W-6 3 275,000 285,000 - - - - - - W-7 2 278,500 278,500 - - - - - - W-8 - - - - - - - - - W-9 1 178,000 178,000 1 105,000 105,000 - - - W-10 - - - - - - - - - W-12 2 234,500 234,500 - - - - - - W-13 1 170,000 170,000 - - - - - - W-14 - - - - - - - - - W-15 - - - - - - - - - W-16 - - - - - - - - - W-17 - - - - - - - - - W-18 - - - - - - - - - W-19 9 218,333 216,000 - - - - - - W-20 7 211,714 209,000 - - - - - - W-21 8 236,600 216,250 - - - - - - W-22 - - - - - - - - - W-23 19 182,653 184,500 - - - - - - W-24 12 174,325 175,750 - - - - - - W-25 - - - - - - - - - W-26 - - - - - - - - - W-27 2 174,000 174,000 - - - - - - W-28 2 174,750 174,750 - - - - - - W-29 2 148,500 148,500 - - - - - -
- 11. 9 Year * Number of Sales * Dollar Volume * Average Price (Property of all types) (Property of all types) (Property of all types) 1953 2,699 $ 38,935,130 $ 14,424 1954 3,061 44,835,245 14,647 1955 3,555 53,153,433 14,952 1956 4,885 73,486,822 15,043 1957 5,916 93,072,456 15,732 1958 7,968 128,163,813 16,085 1959 9,559 158,821,137 16,615 1960 9,298 151,828,112 16,329 1961 9,264 151,314,565 16,334 1962 9,669 161,878,920 16,742 1963 11,096 * Number of Sales 183,272,930 16,517 *Average Price 1964 13,895 (Single-Family Only) 241,218,500 17,370 (Single-Family Only) 1965 14,890 281,164,558 18,883 1966 14,883 13,428 326,687,333 21,950 $ 21,360 1967 14,886 12,432 367,415,993 24,681 24,078 1968 15,570 12,245 430,301,604 27,637 26,732 1969 15,817 12,493 473,422,285 29,931 28,929 1970 13,076 10,498 394,123,765 30,141 29,492 1971 15,587 13,085 496,009,054 31,822 30,426 1972 17,037 14,613 580,579,218 34,078 32,513 1973 19,561 16,335 862,742,566 44,105 40,605 1974 20,680 17,318 1,160,586,426 56,121 52,806 1975 26,088 22,020 1,517,817,465 58,180 57,581 1976 22,575 19,025 1,417,814,546 62,805 61,389 1977 24,335 20,512 1,630,809,263 67,015 64,559 1978 24,778 21,184 1,707,519,316 68,913 67,333 1979 27,060 23,466 2,068,819,999 73,992 70,830 1980 30,977 26,017 2,478,889,915 80,023 75,694 1981 35,434 29,625 3,373,355,403 95,201 90,203 1982 28,936 25,336 2,825,353,787 97,724 95,496 1983 34,896 30,046 3,668,093,732 105,115 101,626 1984 36,206 31,905 3,845,980,469 106,225 102,318 1985 51,514 45,509 5,957,686,711 115,652 109,094 1986 54,815 52,919 8,195,016,831 149,503 138,925 1987 51,149 43,475 10,287,088,795 201,120 189,105 1988 61,441 49,381 15,234,986,682 249,632 229,635 1989 47,447 38,960 13,863,276,860 292,185 273,698 1990 31,652 26,779 8,264,140,752 261,094 255,020 1991 44,510 38,144 10,606,078,479 238,285 234,313 1992 49,113 41,703 10,705,964,103 217,986 214,971 1993 46,561 38,990 9,885,955,838 212,323 206,490 1994 52,796 44,237 11,516,814,224 218,138 208,921 1995 47,100 39,273 9,902,240,806 210,238 203,028 1996 65,760 55,779 13,497,191,369 205,249 198,150 1997 69,530 58,014 15,334,247,984 220,541 211,307 1998 66,876 55,344 15,050,497,785 225,051 216,815 1999 71,738 58,957 16,914,637,727 235,783 228,372 2000 January 3,282 2,694 786,812,743 239,736 229,758 February 5,668 4,731 1,430,128,309 252,316 245,134 March 7,455 6,133 1,873,828,920 251,352 245,553 April 7,163 5,996 1,799,071,711 251,162 247,303 May 7,118 5,892 1,788,083,289 251,206 247,014 June 6,965 5,754 1,783,989,982 256,136 247,929 July 5,771 4,729 1,418,282,236 245,760 236,526 August 6,070 4,961 1,475,392,999 243,063 230,093 September 5,833 4,857 1,492,725,419 255,910 248,604 October 5,698 4,696 1,453,498,740 255,089 245,321 November 5,885 4,880 1,496,826,649 254,346 246,154 December 3,717 3,026 975,399,972 262,416 238,956 Total 70,625 58,343 17,774,041,917 251,667 243,255 2001 January 3,760 3,103 913,966,272 243,076 235,535 February 5,624 4,761 1,447,699,784 257,414 252,072 March 7,379 6,328 1,883,344,713 254,953 248,601 April 7,267 6,163 1,844,263,622 253,786 249,692 May 8,775 7,485 2,277,149,752 259,504 255,460 June 8,334 7,176 2,235,421,622 268,229 258,797 July 6,733 5,807 1,730,865,830 257,072 250,095 August 6,792 5,845 1,734,968,171 255,442 247,472 September 5,853 5,021 1,472,023,463 251,498 245,530 Total 60,517 51,689 15,539,703,229 256,782 250,417 * Due to District revisions, caution should be exercised when undertaking historical comparisons. Please refer to appropriate maps.