Weitere ähnliche Inhalte
Ähnlich wie Mixed Signals in US Recovery: GDP Growth Slows While Employment Advances
Ähnlich wie Mixed Signals in US Recovery: GDP Growth Slows While Employment Advances (20)
Mixed Signals in US Recovery: GDP Growth Slows While Employment Advances
- 1. Mixed Signals – Reading Between the Lines of Recovery
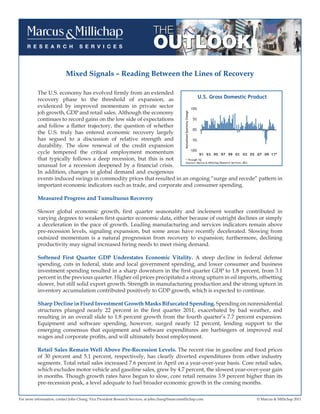
The U.S. economy has evolved firmly from an extended
recovery phase to the threshold of expansion, as U.S. Gross Domestic Product
evidenced by improved momentum in private sector 10%
job growth, GDP and retail sales. Although the economy
Annualized Quarterly Change
continues to record gains on the low side of expectations 5%
and follow a flatter trajectory, the question of whether
0%
the U.S. truly has entered economic recovery largely
has segued to a discussion of relative strength and -5%
durability. The slow renewal of the credit expansion
-10%
cycle tempered the critical employment momentum 91 93 95 97 99 01 03 05 07 09 11*
that typically follows a deep recession, but this is not * Through 1Q
Sources: Marcus & Millichap Research Services, BEA
unusual for a recession deepened by a financial crisis.
In addition, changes in global demand and exogenous
events induced swings in commodity prices that resulted in an ongoing “surge and recede” pattern in
important economic indicators such as trade, and corporate and consumer spending.
Measured Progress and Tumultuous Recovery
Slower global economic growth, first quarter seasonality and inclement weather contributed in
varying degrees to weaken first quarter economic data, either because of outright declines or simply
a deceleration in the pace of growth. Leading manufacturing and services indicators remain above
pre-recession levels, signaling expansion, but some areas have recently decelerated. Slowing from
outsized momentum is a natural progression from recovery to expansion; furthermore, declining
productivity may signal increased hiring needs to meet rising demand.
Softened First Quarter GDP Understates Economic Vitality. A steep decline in federal defense
spending, cuts in federal, state and local government spending, and lower consumer and business
investment spending resulted in a sharp downturn in the first quarter GDP to 1.8 percent, from 3.1
percent in the previous quarter. Higher oil prices precipitated a strong upturn in oil imports, offsetting
slower, but still solid export growth. Strength in manufacturing production and the strong upturn in
inventory accumulation contributed positively to GDP growth, which is expected to continue.
Sharp Decline in Fixed Investment Growth Masks Bifurcated Spending. Spending on nonresidential
structures plunged nearly 22 percent in the first quarter 2011, exacerbated by bad weather, and
resulting in an overall slide to 1.8 percent growth from the fourth quarter’s 7.7 percent expansion.
Equipment and software spending, however, surged nearly 12 percent, lending support to the
emerging consensus that equipment and software expenditures are harbingers of improved real
wages and corporate profits, and will ultimately boost employment.
Retail Sales Remain Well Above Pre-Recession Levels. The recent rise in gasoline and food prices
of 30 percent and 5.1 percent, respectively, has clearly diverted expenditures from other industry
segments. Total retail sales increased 7.6 percent in April on a year-over-year basis. Core retail sales,
which excludes motor vehicle and gasoline sales, grew by 4.7 percent, the slowest year-over-year gain
in months. Though growth rates have begun to slow, core retail remains 3.9 percent higher than its
pre-recession peak, a level adequate to fuel broader economic growth in the coming months.
For more information, contact John Chang, Vice President Research Services, at john.chang@marcusmillichap.com. © Marcus & Millichap 2011
- 2. Residential Sector Remains Beleaguered. Single-family Existing Single-Family Home Sales
home sales remain 30 percent below their 2005 peak while and Median Home Prices
prices have fallen 28 percent. Bank-owned properties and 7
Home Sales Median Home Price
$260
homes in some stage of foreclosure constituted more than
Total Sales (millions, SAAR)
Median Home Price (000s)
a quarter of the homes sold in the first quarter, placing a 6 $220
drag on the housing market and initiating a double-dip 5 $180
in home prices in many markets. These trends continue
to reverberate throughout the economy, impairing sales 4 $140
of home-related products, depressing single-family
3 $100
starts and derailing construction employment. 00 01 02 03 04 05 06 07 08 09 10 11*
* Through April
Sources: Marcus & Millichap Research Services, National Association of Realtors ®
Risks of Inflationary Pressure Rising but Still
Contained. The Fed’s Quantitative Easing policies have
held interest rates in check, but also led to a weakening of the dollar and fueled rising commodity
prices. Strong global demand further contributed to a run-up in energy and food costs, which has
stirred inflation concerns. Limited pricing power, easing oil prices, weak housing and still subdued
wage growth, however, should contain short-term inflation.
Private Sector Employment Continues to Advance but Momentum Waning. Powered by 15 months
of continuous growth, private sector employers have contributed 2.1 million positions to the economy.
However, May additions fell significantly below recent trends to 83,000 private employer jobs as supply
chain disruptions spawned in Japan combined with higher energy costs and severe weather in many
parts of the country to erode hiring momentum. Nearly 85 percent of the positions created over the
past 15 months have been concentrated in five sectors: Professional and Business Services, Education
and Health Services, Trade Transportation and Utilities, Leisure & Hospitality, and Manufacturing.
Meanwhile Construction, Financial Services and Information Services have floundered, with flat
or marginally negative employment trends. Though May’s weak showing could spark heightened
caution among employers, resulting in lackluster figures through the summer months, employment
trends should remain positive through the remainder of the year.
Local Government Job Losses Hamper Growth. The government sector continues to act as a drag
on the economy, with local and state governments retrenching due to falling income and property
tax revenue. Over the past 19 months, 368,000 local government jobs have been eliminated including
the 29,000 positions lost in May. The ongoing slump in existing home sales, and home construction
together with diminished payroll taxes will further pressure local government finances in the months
ahead, leading to additional layoffs.
Private-Sector Employment Oil Prices vs. 10-Year Treasury Rate
Crude Oil (WTI) 10-Year Treasury Rate
600 $160 16%
Crude Oil (price per barrel)
10-Year Treasury Rate
Monthly Change (000s)
300
$120 12%
0
$80 8%
-300
Recessions
-600 $40 4%
-900 04 05 06 07 08 09 10 11* $0 0%
71 75 79 83 87 91 95 99 03 07 11*
* Through May * Through June 7
Sources: Marcus & Millichap Research Services, BLS Sources: Marcus & Millichap Research Services, Federal Reserve, U.S. Department of Energy
For more information, contact John Chang, Vice President Research Services, at john.chang@marcusmillichap.com. © Marcus & Millichap 2011
- 3. Forecast:
The unknown consequences of provisional monetary
U.S. Public Debt as % of GDP
policies, the large amount of liquidity in the banking
140%
system, the withdrawal of fiscal stimulus and subsequent
reduced demand from government, and inflation risk all 110%
add complexity to the national economic outlook. Much
% of GDP
80%
of the money intended for quick distribution into the
economy has just remained in the financial system instead 50%
of moving through the economy via lending. This has
begun to change as lenders now appear poised to lend at 20%
40 56 72 79 83 87 91 95 99 03 07 11*
attractive rates, and businesses appear confident enough * Through 1Q
to take on new debt, although the hurdles remain quite Data pre-1976 represents 2Q of each year
Sources: Marcus & Millichap Research Services, U.S. Bureau of Economic Analysis,
Federal Reserve Board, U.S. Department of Treasury
high. Only the most creditworthy borrowers have access
to capital for small business and personal loans.
The economy is forecast to add 2.0 million jobs by the end of 2011, reducing the unemployment rate
to the high 8 percent range; GDP is forecast to average 3.2 percent in 2011 before trending up the
following year. Still, the U.S. economy faces numerous challenges:
The Fed’s QE2 Policy is Slated to Sunset in June 2011. Private investors must return to the
Treasury market to replace the Fed’s direct purchases. Interest rates could rise quickly without
continued government intervention and as a result of strengthening economic growth. The Fed
must carefully calibrate monetary policy to promote economic growth and manage mounting
inflationary pressures.
Public Sector Debt Undermines Economic Growth and Consumer Confidence. The
withdrawal of government stimulus and higher levels of public sector debt will necessitate
increased taxes and spending cuts, which could hamper the willingness of consumers and
businesses to spend and invest, and thereby truncate promising economic growth. These actions,
however, may be deferred until after the 2012 elections.
Higher Savings Dampen Consumption Growth. That is, until wage growth reaches a level
comfortable for consumers. Continued bank de-leveraging will remain a drag on attractive credit
availability to a broader base of consumers and business.
With expectations of strengthening economic growth, healthy corporate profits, increasing demand
and rising exports, business spending will power the recovery over the next year. The recent corporate
rush to raise debt before the Fed ends the $600-billion Treasury-bond purchase program may indicate
that companies finally are ready to invest rather than use the money to buy back stock, refinance
existing debt or hoard cash. This suggests an imminent increase in capital expenditures, a boost
in employment and commensurate improvement in commercial real estate. Fundamentals for the
industrial and office sectors have moved into recovery, while the apartment and retail sectors shifted
squarely into expansion territory, benefiting from short-term lease structures. Intense competition
for core product and the availability of low-cost debt permits capital to flow into a broader range of
asset quality and market tiers to take advantage of real estate’s long-term stability, steady income and
appreciation potential.
For more information, contact John Chang, Vice President Research Services, at john.chang@marcusmillichap.com. © Marcus & Millichap 2011
- 4. Apartments Enter Rapid Recovery; Convergence of Positive Factors
Pushes the Sector Toward Equilibrium by Year-End 2011
Apartments Have Entered a Sweeping Expansion
Cycle. The sector remains the beneficiary of important Quarterly Job Growth vs.
Apartment Units Absorbed
macro demand trends at work in both the economy and
Job Growth Net Absorption
capital markets. The housing market collapse ignited 3.0 100
a dramatic decline in the homeownership rate for 11
Units Absorbed (000s)
Job Growth (millions)
1.5 50
consecutive months, retreating to 66.5 percent between
0.0 0
mid-2008 and this year’s opening quarter, ceding an
additional 2.5 million households to rental housing. In -1.5 -50
addition, the prime renter age cohort of 20- to 34-year-
-3.0 -100
olds staged a decisive rebound in employment, 00 01 02 03 04 05 06 07 08 09 10 11*
capturing nearly 65 percent of job gains during 2010 *Through 1Q
Sources: Marcus & Millichap Research Services, Reis, BLS
and spurring a household “de-bundling” effect. The
robust long-run demand trends and ready availability of agency and other debt sources offer
apartments a competitive advantage relative to other commercial property sectors. That said, the
spread between apartment cap rates and the 10-year Treasury is narrower than other sectors and the
recent rise in long-term Treasury rates prompted concerns that cap rates may trend higher. Thus far,
pricing has held firm in the face of moderately higher risk-free rates, although intense competition
and pricing for core assets in top-tier markets has sparked investor interest in secondary markets.
Renter Demand Swamps New Construction; Stellar Market Dynamics of 2010 Extend into 2011.
The national vacancy rate plunged an unprecedented 180 basis points year over year to 6.2 percent
in the first quarter of 2011. Historically low stock additions coincided with the most substantial
demand growth on record as nearly 242,000 units were absorbed over the past 12 months and only
74,000 units came online. Concessions continue to wane, averaging 7.1 percent of asking rents in
the first quarter, compared with 7.6 percent of asking rents in the first quarter last year, driven by
strong demand for top-tier rentals. Asking and effective rents grew 1.9 percent and 2.3 percent
year over year through the first quarter to $1,036 per month and $962 per month, respectively.
Investors Undeterred by Competitive Pricing and Lower Cap Rates. Apartment sales of
more than $1 million surpassed $8.5 billion in the first quarter, a notable 18 percent increase
from the corresponding period last year. Large deals dominated, with sales of more than $20
million more than doubling from a year ago and accounting for 13.1 percent of all transactions.
Cap rate compression in primary markets has slowed as investors have started to explore
opportunities for stronger return potential in secondary and tertiary markets. The spread
between primary and secondary markets averaged 110 basis points in first quarter, and may
compel investors to increasingly seek arbitrage in once-overlooked markets in the months
ahead. Cap rates in primary markets were 6.8 percent in the first quarter; secondary markets
averaged 7.9 percent, while first-year returns in tertiary metros averaged about 8.8 percent.
For more information, contact John Chang, Vice President Research Services, at john.chang@marcusmillichap.com. © Marcus & Millichap 2011
- 5. Forecast: Homeownership Rate
vs. Number of Renter Households
Robust Demand Drivers Push Vacancy Close Homeownership Rate Renter Households
72% 40
To Equilibrium by Year-End 2011. Strengthening
Number of Household (millions)
economic conditions and demographic trends
Homeownership Rate
69% 35
concurrent with minimal new supply should yield
66% 30
yet another notable decline in the national vacancy
rate through 2011 to 5.6 percent. Asking rents are 63% 25
forecast to rise 3.5 percent to $1,068 per month; further
60% 20
reductions in concessions will support a 4.5 percent 66 71 76 81 86 91 96 01 06 11*
* As of 1Q11
increase in effective rents to $1,000 per month. Class A Sources: Marcus & Millichap Research Services, U.S. Census Bureau
and Class B+ properties will continue to outperform
weaker, Class C properties, more at risk of falling into the “distress” category, due to rent
collection challenges and cash flow issues. The multifamily sector is the first to start ramping
up construction, likely led by public REITS due to available capital and healthy lines of low cost
credit. Private sector financing for apartment development may become more accessible this year
as well. The outlook for 2011 calls for demand of approximately 150,000 units, three times the
number of new units slated for delivery. The recent uptick in multifamily permit issuance will
require another 12 to 18 months before new units come to market, creating another three- to
four-year window before supply reaches a level considered risky, at least at the national level.
Should interest rates rise, escalating all-in construction costs will require sustainable rent levels
high enough to justify construction risk, which may naturally curb financing and development.
GSEs Remain Primary Source of Apartment Mortgage Originations, Although Heightened
Competition Has Reduced Market Share. Agency lending accounted for 52 percent of
mortgage originations, reflecting a downward trend in market share over the past year
as regional and local banks, and life insurance companies expanded competitive lending
efforts in the multifamily arena. Access to low-cost agency debt has long been a competitive
advantage for the sector, but the possibility of privatizing or dissolving Fannie Mae and
Freddie Mac places this benefit at risk. The withdrawal of this government support, though
unlikely, could result in higher borrowing costs and inflate cap rates over the forecast
period. Any action may be years out but could occur within a five- to 10-year horizon.
The Current Interest Rate Environment May Be Short-Lived. The expanding economy,
growing deficit, and the end of government initiatives and subsidies will exert upward
pressure on interest rates. As cap rates fall, higher leverage will become somewhat more
challenging as loan-to-value ratios become constrained by debt service coverage ratios.
Stronger Investor Demand and Competitive Pricing Broaden the Quest for Investment
Opportunities. Cap rates for top-quality, core Class A properties stand firmly between 4.5
percent and 5.5 percent. Further significant cap rate compression in this category is unlikely to
occur as concerns about inflation and termination of government support begin to weigh on
investors’ yield expectations. In addition, stronger operational performance and low-cost debt
have broadened buyer demand, leading to more sales of Class B and B- properties. Greater sales
velocity in a broader spectrum of asset quality and markets in 2011 will create greater transparency
and lend support to market pricing in the lower tiers, and secondary and tertiary markets.
For more information, contact John Chang, Vice President Research Services, at john.chang@marcusmillichap.com. © Marcus & Millichap 2011
- 6. Apartment Market Vital Signs
Nonfarm Employment Trends Existing Single-Family and Condo Sales
Single-Family Condo
70%
Nonfarm Employment (Y-O-Y Chg.)
6%
Year-Over-Year Change
3% 35%
0% 0%
-3% -35%
-6% -70%
81 83 85 87 89 91 93 95 97 99 01 03 05 07 09 11* 03 04 05 06 07 08 09 10 11*
* Through April
* Forecast Sources: Marcus & Millichap Research Services, National Association of REALTORS®
Sources: Marcus & Millichap Research Services, BLS
Apartment Supply and Vacancy Trends Apartment Price and Cap Rate Trends
Completions Vacancy Rate Average Price/Unit Average Cap Rate
Average Price per Unit (thousands)
440 10% $120 10%
Units Completed (thousands)
$90 8%
Average Cap Rate
330 8%
Vacancy Rate
$60 6%
220 6%
$30 4%
110 4%
$0 2%
0 2% 00 01 02 03 04 05 06 07 08 09 10 11*
81 83 85 87 89 91 93 95 97 99 01 03 05 07 0911* * As of 1Q11
Includes sales $1 million and greater
* Forecast Sources: Marcus & Millichap Research Services, CoStar Group, Inc.
Sources: Marcus & Millichap Research Services, Reis
1Q 2010 to 1Q 2011 Change in Apartment Vacancy
Markets by Greatest Reduction in Vacancy Markets by Least Reduction in Vacancy
1Q Y-O-Y 1Q Y-O-Y
Metro 2011 Chg. (bps) Metro 2011 Chg. (bps)
Austin 6.3% -380 Denver 5.5% -100
Jacksonville 10.2% -360 Los Angeles 4.5% -100
Orlando 7.9% -360 Milwaukee 4.2% -100
Las Vegas 8.6% -320 Salt Lake City 6.0% -100
Phoenix 8.9% -320 San Diego 3.9% -100
Charlotte 7.5% -310 San Francisco 4.0% -100
Tampa-St. Petersburg 7.2% -290 Columbus 8.6% -90
Dallas-Ft. Worth 6.5% -280 Miami 5.6% -70
Kansas City 7.5% -280 New Jersey 4.5% -60
Houston 10.2% -270 New York 2.8% 0
U.S. Metro Average 6.2% -180 U.S. Metro Average 6.2% -180
Sources: Marcus & Millichap Research Services, Reis
The information in this report is deemed to be reliable. Every effort was made to obtain accurate and complete information; however, no representation, warranty or guarantee, expressed or implied, may
be made as to the accuracy or reliability of the information contained herein. Sources: Marcus & Millichap Research Services, CoStar Group, Inc., DataQuick, Deutsche Bank, Economy.com, Federal Reserve,
MBAA, NAR, Real Capital Analytics (RCA), Reis, U.S. Census Bureau.
For more information, contact John Chang, Vice President Research Services, at john.chang@marcusmillichap.com. © Marcus & Millichap 2011