Welcome to International Journal of Engineering Research and Development (IJERD)

journal publishing, how to publish research paper, Call For research paper, international journal, publishing a paper, IJERD, journal of science and technology, how to get a research paper published, publishing a paper, publishing of journal, publishing of research paper, reserach and review articles, IJERD Journal, How to publish your research paper, publish research paper, open access engineering journal, Engineering journal, Mathemetics journal, Physics journal, Chemistry journal, Computer Engineering, Computer Science journal, how to submit your paper, peer reviw journal, indexed journal, reserach and review articles, engineering journal, www.ijerd.com, research journals, yahoo journals, bing journals, International Journal of Engineering Research and Development, google journals, hard copy of journal

Empfohlen
Empfohlen
Weitere ähnliche Inhalte
Was ist angesagt?
Was ist angesagt? (20)
Ähnlich wie Welcome to International Journal of Engineering Research and Development (IJERD)
Ähnlich wie Welcome to International Journal of Engineering Research and Development (IJERD) (20)
Mehr von IJERD Editor
Mehr von IJERD Editor (20)
Welcome to International Journal of Engineering Research and Development (IJERD)
- 1. International Journal of Engineering Research and Development e-ISSN: 2278-067X, p-ISSN: 2278-800X, www.ijerd.com Volume 6, Issue 5 (March 2013), PP. 107-111 Speed Profile Analysis of Kerala Roads Bybin Paul1, Elson John2 1,2 Department of Civil Engineering, MACE, Kothamangalam, Ernakulam Dist, Kerala, India, Abstract:- The present day transportation is facing many problems. Delay, Congestion, Over consumption of fuel, reliability, pollution and safety are some of the major concerns. Speed of traffic is a parameter which have direct impact on almost all the above problems. Safety of pedestrians as well as motorists are direcly influenced by the speed both in number of accidents and its severity. In Kerala, the vehicle population is increasing at a rate higher than the average and hence the concern is much higher. The various classes of roads are considered in the study and the speed profile of traffic is analysed. The average speed of stream is compared with the posted speed limits and the necessity of enforcing or modifying the posted speed limits is studied. Keywords:- Speed profile, Accidents, Posted speed, cumulative speed, mixed traffic. I. INTRODUCTION Speed is one of the most important characteristics of traffic and its measurement is a frequent necessity in traffic engineering studies. Research has shown that greater the vehicle speed deviation from the average speed, greater the probability of that vehicle being involved in an accident and the accident severity is higher. II. MOTIVATIONS FOR THE STUDY Cities of the most developing countries are growing at a faster rate, resulting in high rate of increase in traffic in the roads which has a number of negative effects such as Wasting time of motorists and passengers, Delays, Inability to forecast travel time accurately, Wasted fuel, Stressed and frustrated motorists, Emergencies: blocked traffic may interfere with the passage of emergency vehicles traveling to their destinations where they are urgently needed and so on. Major factors influencing the vehicles travel speed are Geometry of the road, Posted speed limit, Interference by heavy vehicles, The volume of traffic and Surface condition. III. OBJECTIVES OF THE STUDY To study the speed characteristics of different types of vehicles on different type of road conditions. To compare the volume data to analyse the variations of volumes in peak and off peak hours for each type of vehicles, and the factors influencing it. To study the sufficiency and deficiency of posted speed limit. To develop new speed limits for different roads based on prevailing site conditions. Determination of the optimal and safest speed limit in each category of roads studied, on the basis of accident rates. IV. LITERATURE REVIEW Most motorists select a speed that will allow them to arrive at their destination in the shortest time possible but without endangering themselves and others. As drivers we select our speed by considering the roadway width and alignment, presence of intersections and driveways, roadside conditions, parked vehicles, pedestrian traffic, mix and density of vehicular traffic, weather and other conditions. However, drivers pay almost no attention to posted speed limits, and studies have repeatedly proven that raising or lowering the speed limit has little effect on most drivers. If the traffic is heavy, the road suffers from congestion with consequent loss in journey speeds. Lower speeds cause economic loss to the community due to time lost by the occupants of the vehicles and the higher operational cost of vehicles. Congestion also leads to traffic hazards. V. METHOD OF DATA COLLECTION Locations of the Study: The following locations were selected for the study National Highways 1. NH-49:Madurai 0- Kochi 2. NH-17:Mangalapuram - Edappally 107
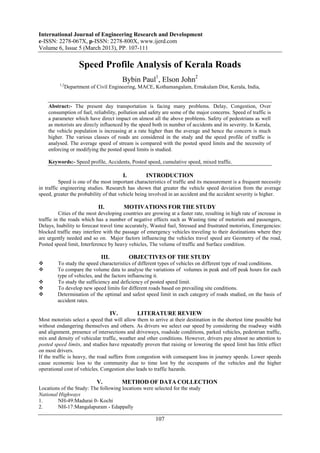
- 2. Speed Profile Analysis of Kerala Roads 3. NH-47:Karukuty - Aroor State Highways 1. SH1-M.C.Road 2. SH16-AM Road 3. SH8-P.M Road Major District Roads 1. MEK 50-Perumbavoor - Kolenchery 2. MEK 43-Perumbavoor - Alwaye 3. MEK 41-Marampally – South Vazhakkulam Types of Vehicles considered The vehicles for the purpose of the study were grouped into the following categories: 1. Cars-consisting of cars, vans and jeeps. 2. Motorized two wheelers-consisting of motor cycles, scooters. 3. Auto-rickshaws-three wheeled motorized transit vehicles to carry a maximum of three passengers. 4. Buses 5. Trucks Speed Data collection Speed data were collected using speeder. The speedar is a hand held radar speedmeter, operating in the 24 GHz band, intended for the measurement and display of the speed of vehicles approaching or receding from the operator. It will require minimal re-training effort for any operator familiar with hand held traffic radar although it does incorporate features not normal found in current radars. A speedar hand held traffic radar equipment is based on the well known and legally accepted principle known as the Doppler effect Volume data collection Traffic volume is the number of vehicles crossing a section of road per unit time at any selected period. Traffic volume is used as a quantity measure of flow; the commonly used units are vehicles per day and vehicles per hour. First the traffic volume during each 15min from 7.00am to 7.00pm was determined for 7 consecutive days. From the data so obtained the peak hour was determined for each road. VI. PRESENTATION OF COLLECTED DATA The collected data were tabulated and resented in different forms for easy understanding and interpretations. To facilitate easy computation, the first step in analysis of speed data is to group them into speed-class intervals and a frequency distribution table is constructed. The cumulative distribution table was prepared for different types of vehicles at different locations. The cumulative frequency table for the vehicle category bus for the road NH 49 is shown in Table 1. TABLE 1: CUMULATIVE FREQUENCY TABLE FOR NH 49 FOR VEHICLE CLASS - BUS Speed Range Mid speed Frequency Percent Cumulative kmph kmph f frequency frequency %f 20-25 27.5 1 4.76 4.76 35-40 37.5 1 4.76 9.52 40-45 42.5 3 14.29 23.81 45-50 47.5 6 28.57 52.38 50-55 52.5 8 38.10 90.48 55-60 57.5 2 9.52 100 Total 21 100 From the cumulative frequency table cumulative frequency curves were plotted. Figure 1 represents the cumulative frequency diagram for vehicle category Bus for NH 49. The 85th percentile speed was also determined. 108
- 3. Speed Profile Analysis of Kerala Roads FIGURE 1: CUMULATIVE FREQUENCY CURVE FOR BUS ON NH 49. Cumulative frequency diagrams were plotted for mixed traffic also and compared those results with the posted speed limits. The cumulative frequency diagram for mixed traffic on NH49 is shown in Figure 2. FIGURE 2: CUMULATIVE FREQUENCY CURVE FOR MIXED TRAFFIC ON NH 49. Classified volume count were conducted and were tabulated as in Table 2 for different roads for both peak and off peakhours. Table 2 represents the consolidated hourly volume for the NH 49 for off peak hours. From the volume data collected, the peak hour and off-peak hour for the selected stretch of roads were determined. The traffic volume during peak and off peak hour is presented in tabular form. TABLE 2: CUMULATIVE FREQUENCY TABLE FOR NH 49 FOR VEHICLE CLASS - BUS Type of Muvattupuzha - Kothamangalam - vehicle Kothamangalam Muvattupuzha Car 624 712 Bike 492 356 Bus 120 112 Auto 168 157 Truck 82 73 Accident data collected is tabulated as in Table 3. Table 3 shows the accident details taken place on NH 49 during the year 2011. Table 3 shows only details of few accidents and is only a sample representation TABLE 3: ACCIDENT DEATILS FOR NH 49 DURING 2011 fir date of date of section place vehicles no occurance reporting involved 43 8.1.2011 8.1.2011 279 po junction m/c 55 9.1.2011 9.1.2011 279 po junction m/c 61 11.1.2011 11.1.2011 279 ,338 mathirapally lorry-m/c 71 13.1.2011 13.1.2011 279 kuroor bridge auto-car 98 16.1.2011 16.1.2011 279 kuroor bridge m/c 109
- 4. Speed Profile Analysis of Kerala Roads 101 16.1.2011 16.1.2011 279 po junction m/c 116 17.1.2011 17.1.2011 279 college jn jeep-m/c 223 30.1.2011 30.1.2011 279 ,337 karukadam ambulance- ,338 m/c 231 29.1.2011 30.1.2011 279,338 mathirapally car-m/c 287 5.2.2011 5.2.2011 279,337, mathirapally m/c 338 ANALYSIS Analysis of Speed, volume and accident data National Highways NH 49 The selected road stretches are accident prone area. However it can be seen that all class of vehicles are having their 85th percentile speed less than the design speed .Therefore an enforcement of safe speed limit is very much essential on this road. The presence of an educational institution further points towards the necessity of posted speed limit in the selected stretch. The class of vehicle with the greatest 85th percentile speed is car and it can be seen from the accident data that the number of car accidents in this zone is very high. The 85 th percentile speeds of bus and truck are very close to the 85th percentile speed of the mixed traffic and this shows that they form the major percentage of the total traffic. NH -17 Posted speed limit at this location is 80kmph Analysis of cumulative speed vs percentile speed for all class of vehicles shows that the 85th percentile speeds of all class of vehicles are well below the design speed and still the accident rates are very high. This points towards the necessity of a posted speed limit in this stretch of road.The greatest 85 th percentile speed is for car.The 85th percentile speed of the mixed traffic as well as that of bikes and trucks are the same.It means that the number of cars and bikes plying through this road form a major portion of the total traffic. NH-47 Posted speed limits for different classes of vehicles are , Car 70kmph, bus and truck 60kmph, bikes 50 kmph and autos 40kmph It can be seen that among the different class of vehicles, cars ,busses, trucks and autos are having their 85th percentile speed less than the posted speed limit .However the 85th percentile speed of bikes exceeds the posted speed limit and is same as that of mixed traffic which implies that the volume of bikes plying through the selected stretch is very high. It can also be seen that number of bike accidents in this zone is considerable. SH-1 Posted speed limit at this location is 30kmph Here the posted speed limit is 30kmph.However all class of vehicles have their 85 th percentile speed greater than this value. This is the main reason for the high accident rate in this stretch. Among the different class of vehicles the number of accident cases involving cars and bikes is more and it can be seen that they are having very high 85th percentile speed. Immediate measures will have to be taken as this is a school zone. SH-8 Posted speed limit at this location is 40kmph On SH-8 the maximum number of accidents have occurred in front of Nirmala College.Here the posted speed limit is 40kmph and the 85th percentile speed of all class of vehicles is exceeding this value.Analysis of the accident data shows that cars and bikes are the main class of vehicles that are involved in accidents and they are having the greatest 85 th percentile speed in comparison to the other classes of vehicles. SH-16 Posted speed limit at this location is 40kmph The posted speed limit is only 40kmph and 85 th percentile speeds of all class of vehicles are above this limit.car has the greatest 85th percentile speed among all class of vehicle. The 85th percentile speeds of bikes and trucks is near to the 85th percentile speed of mixed traffic.Cars and bikes are the classes of vehicles that are chiefly involved in accidents. MEK-49 Posted speed limit at this location is 50kmph 110
- 5. Speed Profile Analysis of Kerala Roads It can be seen that the 85th percentile speeds of only cars, bikes and trucks is exceeding the 85th percentile speed of mixed traffic. Maximum accident cases are reported for cars. The 85th percentile speed of truck is close to the 85th percentile speed of mixed traffic. MEK-50 Posted speed limit at this location is 30kmph All class of vehicles are having their 85th percentile speed higher than the posted speed limit of 30kmph.`The main class of vehicle involved in accidents as per the accident data available is car and it is having an 85th percentile speed of 60kmph which is very much above the 85th percentile speed of all other class of vehicle. MEK-43 Posted speed limit at this location is 30kmph Here either the curve or the high speed of vehicles is the primary cause of increased accident rate. Provision of humps on the road has not reduced the accident rates. The greatest 85th percentile speed is for cars(65kmph) and the 85th percentile speed of truck is very close to the 85th percentile speed of the mixed traffic. VII. CONCLUSION The various classes of road were considered in the study and found that the accidents are common in most of the roads. Some of the roads have posted speed limits but most of the cases these speed limits are violated by major portion of the vehicles or average speed of many category of vehicles are above the speed limits. Speed being an important parameter in causing accidents needs to be restricted. The study revealed that the different classes of roads in the study area are accident prone and the major cause for this high number of accidents is speed. REFERENCES [1]. Basil David Daniel, Prof. Alan Nicholson, Dr. Glen Koorey,” Investigating speed patterns and estimating speed on traffic calmed streets”, IPENZ Transportation Group Conference Auckland March, 2011 [2]. A. Pascale, F. Deflorio, M. Pedroli, M. Nicoli, B. Dalla Chiara, “Analysis of typical speed profiles from floating heavy vehicles”, 2nd International Conference on Models and Technologies for Intelligent Transportation Systems 22-24 June, 2011, Leuven, Belgium [3]. Taylor M A P, Rutherford L. M, Speed Profiles at Slow Points on Residential Streets, 13th Australian Road Research Board Conference, Vermont South, Victoria, Australian Road Research Board, p. 65-77 [4]. Martin R. Parker, Lori J. Dereniewski, “Review and Analysis of Posted Speed Limits and Speed Limit Setting Practices in British Columbia”, Final Report Spring 2003, British Columbia Ministry of Transportation 4B - 940 Blanshard Street Victoria, B.C. V8W 9T5 111