Candlestick patterns for reading market sentiment
•
2 gefällt mir•1,776 views

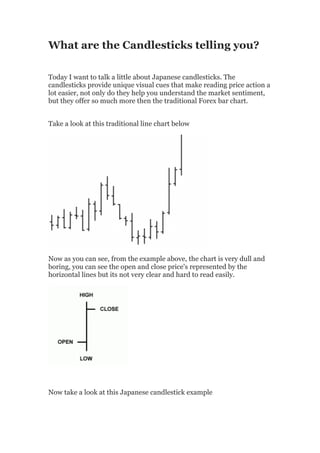
Today I want to talk a little about Japanese candlesticks. Candlesticks provide unique visual cues that make reading price action a lot easier.

Empfohlen
Weitere ähnliche Inhalte
Was ist angesagt?
Was ist angesagt? (20)
Andere mochten auch
Andere mochten auch (8)
Ähnlich wie Candlestick patterns for reading market sentiment
Ähnlich wie Candlestick patterns for reading market sentiment (20)
Kürzlich hochgeladen
Kürzlich hochgeladen (20)
Candlestick patterns for reading market sentiment
- 1. What are the Candlesticks telling you? Today I want to talk a little about Japanese candlesticks. The candlesticks provide unique visual cues that make reading price action a lot easier, not only do they help you understand the market sentiment, but they offer so much more then the traditional Forex bar chart. Take a look at this traditional line chart below Now as you can see, from the example above, the chart is very dull and boring, you can see the open and close price's represented by the horizontal lines but its not very clear and hard to read easily. Now take a look at this Japanese candlestick example
- 2. This looks a lot better, you can clearly see the open and close at a glance, also the best thing is, you can see straight away if the candle is bullish or bearish as each candle is represented by two colours Green = Bullish Red = Bearish The colour of the body of the candlestick represents the difference between the open and closing price and whether the day's (or weeks or year's) market closed up or down. The wicks (or shadows) show the extreme lows and highs of price for the currency that day.
- 3. However just looking at the candlesticks alone is not the only way to gauge price action, the candlesticks alone does not give you enough to determine the market sentiment. Traders tend to use candlesticks with other technical indicators like moving averages, I of course use the Ichimoku indicator for my complete view of the market, the mixture of Japanese Candlesticks with the Ichimoku indicator is one of the most accurate way to trade, if you haven't checked out my Blog all about Ichimoku, check it out here Popular Candlestick Patterns To further strengthen your analysis of the chart we can however look for specific patterns from the candlesticks to spot strengths or weakness in future price movement. Many of these candlesticks patterns have eccentric names like, Dark cloud cover, Morning star or Engulfing Pattern, these are based on direct translations of their original Japanese names. In future updates I will go into more detail about all the patterns you will come across, for now though I want to show you some of the important ones so you can start watching the charts and looking out for them. Bearish Reversal Patterns "Abandoned Baby" The Abandoned Baby is a bearish reversal pattern characterized by a
- 4. large move up followed by a doji or small candle, and then a third candle heading in the opposite direction. This is a very strong reversal pattern so keep an eye out for this one. "Bearish Dark Cloud Cover" Bearish Dark Cloud Pattern is a two candlestick pattern. This is also a very strong reversal pattern and is very common. The pattern consists of two candlesticks, the first one is a strong bullish candlestick. The second candlestick opens above the previous candlestick but closes below forming a bearish candlestick. "Bearish Evening Star"
- 5. Evening star is a strong reversal pattern and is a three candlestick pattern. The first candlestick is a strong bullish candlestick. The second candlestick is small bullish or bearish candlestick. The third candlestick is a strong bearish candlestick. Bullish Reversal Patterns These are the same as the Bearish patterns, just the opposite way round. In future posts I will also cover some strong continuation patterns, these are patterns that show a strong possibility that price action may continue to carry moving in the same direction. Look out for future posts where I will dig a little deeper into candlestick analysis and show you some more patterns. Until next time Chris(admin)