1. TRIBUNE COMPANY
SECOND QUARTER RESULTS OF OPERATIONS (Unaudited)
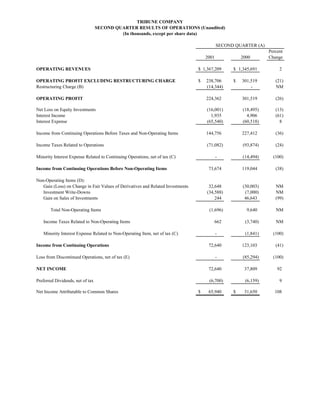
(In thousands, except per share data)
SECOND QUARTER (A)
Percent
2001 2000 Change
OPERATING REVENUES $ 1,367,209 $ 1,345,691 2
OPERATING PROFIT EXCLUDING RESTRUCTURING CHARGE $ 238,706 $ 301,519 (21)
Restructuring Charge (B) (14,344) - NM
OPERATING PROFIT 224,362 301,519 (26)
Net Loss on Equity Investments (16,001) (18,495) (13)
Interest Income 1,935 4,906 (61)
Interest Expense (65,540) (60,518) 8
Income from Continuing Operations Before Taxes and Non-Operating Items 144,756 227,412 (36)
Income Taxes Related to Operations (71,082) (93,874) (24)
Minority Interest Expense Related to Continuing Operations, net of tax (C) - (14,494) (100)
Income from Continuing Operations Before Non-Operating Items 73,674 119,044 (38)
Non-Operating Items (D):
Gain (Loss) on Change in Fair Values of Derivatives and Related Investments 32,648 (30,003) NM
Investment Write-Downs (34,588) (7,000) NM
Gain on Sales of Investments 244 46,643 (99)
Total Non-Operating Items (1,696) 9,640 NM
Income Taxes Related to Non-Operating Items 662 (3,740) NM
Minority Interest Expense Related to Non-Operating Item, net of tax (C) - (1,841) (100)
Income from Continuing Operations 72,640 123,103 (41)
Loss from Discontinued Operations, net of tax (E) - (85,294) (100)
NET INCOME 72,640 37,809 92
Preferred Dividends, net of tax (6,700) (6,159) 9
Net Income Attributable to Common Shares $ 65,940 $ 31,650 108
2. EARNINGS PER SHARE
Basic:
From continuing operations
Before restructuring charge and non-operating items $ .25 $ .47 (47)
Including restructuring charge and non-operating items $ .22 $ .49 (55)
Discontinued operations - (.36) (100)
Total $ .22 $ .13 69
Diluted:
From continuing operations
Before restructuring charge and non-operating items $ .24 $ .44 (45)
Including restructuring charge and non-operating items $ .21 $ .46 (54)
Discontinued operations - (.33) (100)
Total (F) $ .21 $ .13 62
DIVIDENDS PER COMMON SHARE $ .11 $ .10 10
Weighted Average Common Shares Outstanding (G) 298,232 239,487 25
Cash Earnings from Continuing Operations Before Restructuring Charge
and Non-Operating Items (H)
Amount $ 142,844 $ 158,208 (10)
Per diluted share $ .42 $ .59 (29)
3. (A) 2001 quarter: April 2, 2001 to July 1, 2001. (13 weeks)
2000 quarter: March 27, 2000 to June 25, 2000. (13 weeks)
Times Mirror operating results are included beginning on April 17, 2000.
(B) During the second quarter of 2001, the Company announced a voluntary retirement program (VRP) which is being
offered to approximately 1,400 employees who meet certain eligibility requirements. In addition, various other
workforce reduction initiatives are being implemented throughout the organization. In the second quarter of 2001,
the Company recorded a restructuring charge of $14.3 million, or $.03 per share, for these initiatives.
(C) Minority interest expense was recorded for the 60.6% of Times Mirror not owned by Tribune from
April 17 through June 11, 2000.
(D) The second quarter of 2001 included the following non-operating items:
Pretax Diluted
Gain (Loss) EPS
Net change in fair values of PHONES and DECS derivatives and related
AOL Time Warner (quot;AOLquot;) and Mattel shares $ 32,648 $ .07
Investment write-downs (34,588) (.07)
Sale of investments 244 -
Total non-operating items $ (1,696) $ -
The second quarter of 2000 included the following non-operating items:
Pretax Diluted
Gain (Loss) EPS
Net change in fair values of PHONES, DECS, PEPS and AOL collar
derivatives and related AOL and Mattel shares $ (30,003) $ (.07)
Investment write-downs (7,000) (.02)
Sale of Digital City investment 46,643 .11
Total non-operating items $ 9,640 $ .02
(E) Tribune Education was sold to The McGraw-Hill Companies on Sept. 5, 2000 for approximately $686 million,
including the related tax benefit of $22 million. The accompanying financial statements reflect the Education
segment as discontinued operations, which are summarized as follows:
Second Quarter
2001 2000
Income from operations, net of tax $ - $ 10,464
Loss on disposal, net of tax and income during the holding period - (95,758)
Loss from discontinued operations, net of tax $ - $ (85,294)
4. (F) Diluted EPS is computed assuming that the Series B convertible preferred shares and the LYONs debt securities
are converted into common shares. Also, weighted average common shares outstanding is adjusted for the
dilutive effect of stock options. The Company has certain other convertible securities which are not
included in the calculation of diluted EPS because their effects are antidilutive. Following is the calculation of
diluted EPS for the second quarter:
Second Quarter
2001 2000
Net income $ 72,640 $ 37,809
Additional ESOP contribution required assuming Series B
preferred shares were converted, net of tax (2,572) (2,735)
Dividends for Series C, D-1, and D-2 preferred stock (2,014) -
LYONs interest expense, net of tax 1,525 246
Minority interest adjustment, net of tax - (318)
Adjusted net income $ 69,579 $ 35,002
Weighted average common shares outstanding 298,232 239,487
Assumed conversion of Series B preferred shares into common 18,264 19,405
Assumed exercise of stock options, net of common
shares assumed repurchased 6,849 2,694
Assumed conversion of LYONs debt securities 7,272 1,121
Adjusted weighted average common
shares outstanding 330,617 262,707
Diluted earnings per share $ .21 $ .13
(G) The number of common shares outstanding, in thousands, at July 1, 2001 was 297,065.
(H) Cash earnings per diluted share is computed as income from continuing operations plus amortization of goodwill
and other intangible assets, but before restructuring charge and non-operating items, divided by diluted weighted
average shares outstanding. The calculations are summarized as follows:
Second Quarter 2001
Amount Diluted EPS
Income from continuing operations, before restructuring charge and
non-operating items $ 82,422 $ .24
Amortization of intangible assets 60,422 .18
Cash earnings $ 142,844 $ .42
Second Quarter 2000
Amount Diluted EPS
Income from continuing operations, before non-operating items $ 119,044 $ .44
Amortization of intangible assets 39,164 .15
Cash earnings $ 158,208 $ .59
5. TRIBUNE COMPANY
FIRST HALF RESULTS OF OPERATIONS (Unaudited)
(In thousands, except per share data)
FIRST HALF (A)
Percent
2001 2000 Change
OPERATING REVENUES $ 2,660,011 $ 2,069,924 29
OPERATING PROFIT EXCLUDING RESTRUCTURING CHARGE $ 441,405 $ 473,501 (7)
Restructuring Charge (B) (14,344) - NM
OPERATING PROFIT 427,061 473,501 (10)
Net Loss on Equity Investments (35,862) (36,164) (1)
Interest Income 4,001 19,143 (79)
Interest Expense (130,140) (91,037) 43
Income from Continuing Operations Before Taxes and Non-Operating Items 265,060 365,443 (27)
Income Taxes Related to Operations (126,422) (149,184) (15)
Minority Interest Expense Related to Continuing Operations, net of tax (C) - (14,494) (100)
Income from Continuing Operations Before Non-Operating Items 138,638 201,765 (31)
Non-Operating Items (D):
Gain (Loss) on Change in Fair Values of Derivatives and Related Investments 41,764 (66,302) NM
Investment Write-Downs (34,588) (7,000) NM
Gain on Sales of Investments 442 59,654 (99)
Total Non-Operating Items 7,618 (13,648) NM
Income Taxes Related to Non-Operating Items (2,972) 5,186 NM
Minority Interest Expense Related to Non-Operating Item, net of tax (C) - (1,841) (100)
Income from Continuing Operations 143,284 191,462 (25)
Loss from Discontinued Operations, net of tax (E) - (86,015) (100)
NET INCOME 143,284 105,447 36
Preferred Dividends, net of tax (13,399) (10,614) 26
Net Income Attributable to Common Shares $ 129,885 $ 94,833 37
6. EARNINGS PER SHARE
Basic:
From continuing operations
Before restructuring charge and non-operating items $ .45 $ .80 (44)
Including restructuring charge and non-operating items $ .44 $ .76 (42)
Discontinued operations - (.36) (100)
Total $ .44 $ .40 10
Diluted:
From continuing operations
Before restructuring charge and non-operating items $ .43 $ .75 (43)
Including restructuring charge and non-operating items $ .41 $ .71 (42)
Discontinued operations - (.33) (100)
Total (F) $ .41 $ .38 8
DIVIDENDS PER COMMON SHARE $ .22 $ .20 10
Weighted Average Common Shares Outstanding (G) 298,944 237,845 26
Cash Earnings from Continuing Operations Before Restructuring Charge
and Non-Operating Items (H)
Amount $ 266,730 $ 260,709 2
Per diluted share $ .79 $ .98 (19)
7. (A) 2001 first half: January 1, 2001 to July 1, 2001. (26 weeks)
2000 first half: December 27, 1999 to June 25, 2000. (26 weeks)
Times Mirror operating results are included beginning on April 17, 2000.
(B) During the second quarter of 2001, the Company announced a voluntary retirement program (VRP) which is being
offered to approximately 1,400 employees who meet certain eligibility requirements. In addition, various other
workforce reduction initiatives are being implemented throughout the organization. In the first half of 2001,
the Company recorded a restructuring charge of $14.3 million, or $.03 per share, for these initiatives.
(C) Minority interest expense was recorded for the 60.6% of Times Mirror not owned by Tribune from
April 17 through June 11, 2000.
(D) The first half of 2001 included the following non-operating items:
Pretax Diluted
Gain (Loss) EPS
Net change in fair values of PHONES, DECS, and PEPS derivatives and
related AOL Time Warner (quot;AOLquot;) and Mattel shares (1Q & 2Q) $ 41,764 $ .08
Investment write-downs (2Q) (34,588) (.07)
Sale of investments (1Q & 2Q) 442 -
Total non-operating items $ 7,618 $ .01
The first half of 2000 included the following non-operating items:
Pretax Diluted
Gain (Loss) EPS
Net change in fair values of PHONES, DECS, PEPS and AOL collar
derivatives and related AOL and Mattel shares (1Q & 2Q) $ (66,302) $ (.16)
Investment write-downs (2Q) (7,000) (.02)
Sale of AOL common stock (1Q) 13,011 .03
Sale of Digital City investment (2Q) 46,643 .11
Total non-operating items $ (13,648) $ (.04)
(E) Tribune Education was sold to The McGraw-Hill Companies on Sept. 5, 2000 for approximately $686 million,
including the related tax benefit of $22 million. The accompanying financial statements reflect the Education
segment as discontinued operations, which are summarized as follows:
First Half
2001 2000
Income from operations, net of tax $ - $ 9,743
Loss on disposal, net of tax and income during the holding period - (95,758)
Loss from discontinued operations, net of tax $ - $ (86,015)
8. (F) Diluted EPS is computed assuming that the Series B convertible preferred shares and the LYONs debt securities
are converted into common shares. Also, weighted average common shares outstanding is adjusted for the
dilutive effect of stock options. The Company has certain other convertible securities which are not
included in the calculation of diluted EPS because their effects are antidilutive. Following is the calculation of
diluted EPS for the first half:
First Half
2001 2000
Net income $ 143,284 $ 105,447
Additional ESOP contribution required assuming Series B
preferred shares were converted, net of tax (5,231) (5,550)
Dividends for Series C, D-1, and D-2 preferred stock (4,028) -
LYONs interest expense, net of tax 3,040 246
Minority interest adjustment, net of tax - (318)
Adjusted net income $ 137,065 $ 99,825
Weighted average common shares outstanding 298,944 237,845
Assumed conversion of Series B preferred shares into common 18,264 19,405
Assumed exercise of stock options, net of common
shares assumed repurchased 6,662 2,984
Assumed conversion of LYONs debt securities 7,272 560
Adjusted weighted average common
shares outstanding 331,142 260,794
Diluted earnings per share $ .41 $ .38
(G) The number of common shares outstanding, in thousands, at July 1, 2001 was 297,065.
(H) Cash earnings per diluted share is computed as income from continuing operations plus amortization of goodwill
and other intangible assets, but before restructuring charge and non-operating items, divided by diluted weighted
average shares outstanding. The calculations are summarized as follows:
First Half 2001
Amount Diluted EPS
Income from continuing operations, before restructuring charge and
non-operating items $ 147,386 $ .43
Amortization of intangible assets 119,344 .36
Cash earnings $ 266,730 $ .79
First Half 2000
Amount Diluted EPS
Income from continuing operations, before non-operating items $ 201,765 $ .75
Amortization of intangible assets 58,944 .23
Cash earnings $ 260,709 $ .98
9. TRIBUNE COMPANY (A)
BUSINESS SEGMENT DATA (Unaudited)
(In thousands)
SECOND QUARTER FIRST HALF
2001 2000 % Change 2001 2000 % Change
BROADCASTING AND ENTERTAINMENT
Operating Revenues
Television $ 313,762 $ 347,724 (10) $ 577,391 $ 633,377 (9)
Radio 16,019 16,948 (5) 28,300 29,856 (5)
Entertainment/Other 57,398 53,699 7 71,556 66,658 7
Total Revenues 387,179 418,371 (7) 677,247 729,891 (7)
EBITDA (B)
Television 128,296 159,944 (20) 230,338 273,498 (16)
Radio 6,225 7,037 (12) 10,257 10,640 (4)
Entertainment/Other 550 4,178 (87) (5,765) (472) NM
Total before Restructuring Charge 135,071 171,159 (21) 234,830 283,666 (17)
Restructuring Charge (167) - NM (167) - NM
Total EBITDA 134,904 171,159 (21) 234,663 283,666 (17)
Operating Profit
Television 99,691 132,200 (25) 173,979 218,324 (20)
Radio 5,893 6,710 (12) 9,581 9,959 (4)
Entertainment/Other (391) 3,172 NM (7,646) (2,506) (205)
Total before Restructuring Charge 105,193 142,082 (26) 175,914 225,777 (22)
Restructuring Charge (167) - NM (167) - NM
Total Operating Profit $ 105,026 $ 142,082 (26) $ 175,747 $ 225,777 (22)
PUBLISHING
Operating Revenues
Daily Newspapers $ 858,365 $ 826,912 4 $ 1,742,915 $ 1,196,299 46
Other Publications/Services 107,340 89,913 19 211,781 127,973 65
Total Revenues 965,705 916,825 5 1,954,696 1,324,272 48
EBITDA
Daily Newspapers 206,878 235,940 (12) 423,321 361,281 17
Other Publications/Services 20,264 17,528 16 38,131 22,079 73
Total before Restructuring Charge 227,142 253,468 (10) 461,452 383,360 20
Restructuring Charge (13,444) - NM (13,444) - NM
Total EBITDA 213,698 253,468 (16) 448,008 383,360 17
Operating Profit
Daily Newspapers 139,389 185,801 (25) 286,111 292,153 (2)
Other Publications/Services 11,662 9,686 20 21,001 11,628 81
Total before Restructuring Charge 151,051 195,487 (23) 307,112 303,781 1
Restructuring Charge (13,444) - NM (13,444) - NM
Total Operating Profit $ 137,607 $ 195,487 (30) $ 293,668 $ 303,781 (3)
INTERACTIVE
Operating Revenues $ 14,325 $ 10,495 36 $ 28,068 $ 15,761 78
EBITDA before Restructuring Charge (5,094) (11,983) 57 (12,133) (22,174) 45
Restructuring Charge (269) - NM (269) - NM
Total EBITDA (5,363) (11,983) 55 (12,402) (22,174) 44
Operating Profit before Restructuring Charge (8,189) (13,130) 38 (18,437) (24,451) 25
Restructuring Charge (366) - NM (366) - NM
Total Operating Profit $ (8,555) $ (13,130) 35 $ (18,803) $ (24,451) 23
CORPORATE EXPENSES
EBITDA before Restructuring Charge $ (9,123) $ (21,557) 58 $ (21,596) $ (29,627) 27
Restructuring Charge (367) - NM (367) - NM
Total EBITDA (9,490) (21,557) 56 (21,963) (29,627) 26
Operating Profit before Restructuring Charge (9,349) (22,920) 59 (23,184) (31,606) 27
Restructuring Charge (367) - NM (367) - NM
Total Operating Profit $ (9,716) $ (22,920) 58 $ (23,551) $ (31,606) 25
CONSOLIDATED
Operating Revenues $ 1,367,209 $ 1,345,691 2 $ 2,660,011 $ 2,069,924 29
EBITDA before Restructuring Charge 347,996 391,087 (11) 662,553 615,225 8
Restructuring Charge (14,247) - NM (14,247) - NM
Total EBITDA 333,749 391,087 (15) 648,306 615,225 5
Operating Profit before Restructuring Charge 238,706 301,519 (21) 441,405 473,501 (7)
Restructuring Charge (14,344) - NM (14,344) - NM
Total Operating Profit $ 224,362 $ 301,519 (26) $ 427,061 $ 473,501 (10)
(A) Times Mirror operating results are included beginning on April 17, 2000. Education operating results are excluded
from all periods presented.
(B) EBITDA is earnings before interest, taxes, depreciation, amortization of intangible assets, equity
results, non-operating items and minority interest.
10. TRIBUNE COMPANY
PRO FORMA RESULTS OF OPERATIONS (Unaudited) (A) (B)
(In thousands)
SECOND QUARTER FIRST HALF
Percent Percent
2001 2000 Change 2001 2000 Change
OPERATING REVENUES
Broadcasting and Entertainment $ 387,179 $ 418,371 (7) $ 677,247 $ 729,891 (7)
Publishing 965,705 1,071,868 (10) 1,954,696 2,083,453 (6)
Interactive 14,325 11,696 22 28,068 21,983 28
Total operating revenues $ 1,367,209 $ 1,501,935 (9) $ 2,660,011 $ 2,835,327 (6)
EBITDA (C)
Broadcasting and Entertainment $ 135,071 $ 171,159 (21) $ 234,830 $ 283,666 (17)
Publishing 227,142 300,139 (24) 461,452 586,574 (21)
Interactive (5,094) (12,972) 61 (12,133) (25,450) 52
Corporate Expenses (9,123) (22,300) 59 (21,596) (42,353) 49
Total EBITDA $ 347,996 $ 436,026 (20) $ 662,553 $ 802,437 (17)
OPERATING PROFIT (C)
Broadcasting and Entertainment $ 105,193 $ 142,082 (26) $ 175,914 $ 225,777 (22)
Publishing 151,051 218,948 (31) 307,112 424,039 (28)
Interactive (8,189) (15,238) 46 (18,437) (30,878) 40
Corporate Expenses (9,349) (23,910) 61 (23,184) (45,610) 49
Total operating profit $ 238,706 $ 321,882 (26) $ 441,405 $ 573,328 (23)
Net Loss on Equity Investments (16,001) (20,201) (21) (35,862) (32,315) 11
Operating profit, net of equity results $ 222,705 $ 301,681 (26) $ 405,543 $ 541,013 (25)
(A) Tribune began to include Times Mirror in its reported results as of April 17, 2000. Pro forma data assumes that Times Mirror was
acquired as of the beginning of fiscal 2000. This provides comparable financial information for year over year comparisons.
(B) Pro forma data does not reflect any potential cost savings, revenue enhancements or other synergies.
(C) Pro forma data excludes the restructuring charge taken in 2001.
11. TRIBUNE COMPANY
PRO FORMA SUMMARY OF REVENUES (Unaudited) (A)
For Second Quarter Ended July 1, 2001
(In thousands)
Second Quarter (13 weeks) Year-to-Date (26 weeks)
Actual Pro Forma % Actual Pro Forma %
2001 2000 Change 2001 2000 Change
Broadcasting & Entertainment
$ 313,762 $ 347,724 $ 577,391 $ 633,377
Television (B) (10) (9)
16,019 16,948 28,300 29,856
Radio (5) (5)
57,398 53,699 71,556 66,658
Entertainment/Other 7 7
Segment Total (C) 387,179 418,371 (7) 677,247 729,891 (7)
Publishing
Advertising
615,274 630,687
Retail 314,162 338,136 (7) (2)
350,040 384,221
National 167,249 194,150 (14) (9)
552,073 643,431
Classified 263,559 325,326 (19) (14)
744,970 857,612 1,517,387 1,658,339
Sub-Total (13) (8)
164,642 162,104 330,272 325,156
Circulation 2 2
107,037 99,958
Other 56,093 52,152 8 7
Segment Total (D) 965,705 1,071,868 (10) 1,954,696 2,083,453 (6)
28,068 21,983
14,325 11,696 22 28
Interactive
$ 1,367,209 $ 1,501,935 (9) $ 2,660,011 $ 2,835,327 (6)
Consolidated Revenues (E)
(A) The pro forma 2000 data assumes that Times Mirror was acquired as of the beginning of fiscal 2000. The pro forma data does not reflect any
potential revenue enhancements or other synergies.
(B) Includes WATL-Atlanta and WNOL-New Orleans, acquired in February 2000, and Tower Distribution (formerly United Video), acquired in
April 2001. On a same station basis, television revenues decreased 11% for the quarter and 10% for the year-to-date. Second quarter includes
copyright royalties of $7.9 million in 2001 and none in 2000. Year-to-date includes copyright royalties of $18.3 million in 2001 and $11.6
million in 2000. Excluding acquisitions and copyright royalties, television revenues decreased 14% for the quarter and 12% for the year-to-date.
(C) Excluding acquisitions and copyright royalties, broadcasting and entertainment revenues decreased 11% for the quarter and 10% for the
year-to-date.
(D) Times Mirror's and Tribune's 2000 fiscal years began on different days. This difference resulted in the seven newly acquired newspapers
having five extra days in Period 1, 2001 compared to Period 1, 2000. Excluding the effect of these extra days, total publishing revenues
decreased 7% for the year-to-date, while advertising revenues decreased 9% from last year. Retail, national and classified advertising were
below last year by 3%, 10% and 15%, respectively.
(E) Excluding acquisitions, copyright royalties and the extra days in 2001 for the seven newly acquired newspapers, consolidated revenues
decreased 10% for the quarter and 7% for the year-to-date.
12. TRIBUNE COMPANY
PRO FORMA SUMMARY OF NEWSPAPER ADVERTISING VOLUME (Unaudited) (A) (B) (C)
For Second Quarter Ended July 1, 2001
(In thousands)
Second Quarter (13 weeks) Year-to-Date (26 weeks)
Actual Pro Forma % Actual Pro Forma %
2001 2000 Change 2001 2000 Change
Full Run
669 772 1,348 1,517
L.A. Times (13) (11)
1,103 1,250
Chicago Tribune 547 640 (15) (12)
849 829
Newsday 465 454 2 2
7,137 7,583
Other Daily Newspapers (D) 3,601 3,913 (8) (6)
Total 5,282 5,779 (9) 10,437 11,179 (7)
Part Run
1,229 1,523 2,469 3,067
L.A. Times (19) (19)
2,804 2,688
Chicago Tribune 1,449 1,396 4 4
835 876
Newsday 458 481 (5) (5)
3,091 2,989
Other Daily Newspapers (D) 1,601 1,537 4 3
Total 4,737 4,937 (4) 9,199 9,620 (4)
Total Advertising Inches
Full Run
Retail 1,689 1,772 (5) 3,212 3,375 (5)
National 809 975 (17) 1,682 1,910 (12)
Classified 2,784 3,032 (8) 5,543 5,894 (6)
5,282 5,779 10,437 11,179
Sub-Total (9) (7)
Part Run 4,737 4,937 (4) 9,199 9,620 (4)
Total 10,019 10,716 (7) 19,636 20,799 (6)
Preprint Pieces (E)
L.A. Times (F) 366,286 286,371 28 779,334 531,121 47
Chicago Tribune 676,041 737,191 (8) 1,329,424 1,377,225 (3)
Newsday 583,722 557,486 5 1,107,827 1,049,356 6
Other Daily Newspapers (D) 807,269 849,913 (5) 1,639,307 1,649,757 (1)
Total 2,433,318 2,430,961 - 4,855,892 4,607,459 5
(A) The pro forma 2000 data assumes that Times Mirror was acquired as of the beginning of 2000. The pro forma data does not
reflect any potential revenue enhancements or other synergies.
(B) Volume is based on preliminary internal data, which may be updated in subsequent reports.
(C) Advertising volume is presented only for daily newspapers.
(D) Other daily newspapers include The Baltimore Sun, South Florida Sun-Sentinel, Orlando Sentinel, The Hartford Courant, The
Morning Call, Daily Press, The Advocate and Greenwich Time.
(E) Preprint amounts have been restated to reflect pieces, rather than inches.
(F) Preprint pieces have been restated to exclude pieces distributed by L.A. Times direct mail operations.
13. TRIBUNE COMPANY
PRO FORMA SUMMARY OF REVENUES (Unaudited) (A)
For Period 6 Ended July 1, 2001
(In thousands)
Period 6 (5 weeks) Year-to-Date (26 weeks)
Actual Pro Forma % Actual Pro Forma %
2001 2000 Change 2001 2000 Change
Broadcasting & Entertainment
$ 123,724 $ 130,508 $ 577,391 $ 633,377
Television (B) (5) (9)
6,208 6,451 28,300 29,856
Radio (4) (5)
22,744 21,213 71,556 66,658
Entertainment/Other 7 7
Segment Total (C) 152,676 158,172 (3) 677,247 729,891 (7)
Publishing
Advertising
615,274 630,687
Retail 114,542 128,140 (11) (2)
350,040 384,221
National 66,187 71,969 (8) (9)
552,073 643,431
Classified 100,461 121,182 (17) (14)
281,190 321,291 1,517,387 1,658,339
Sub-Total (12) (8)
62,887 61,672 330,272 325,156
Circulation 2 2
107,037 99,958
Other 22,503 18,947 19 7
Segment Total (D) 366,580 401,910 (9) 1,954,696 2,083,453 (6)
28,068 21,983
5,505 4,492 23 28
Interactive
$ 524,761 $ 564,574 (7) $ 2,660,011 $ 2,835,327 (6)
Consolidated Revenues (E)
(A) The pro forma 2000 data assumes that Times Mirror was acquired as of the beginning of fiscal 2000. The pro forma data does not reflect any
potential revenue enhancements or other synergies.
(B) Includes WATL-Atlanta and WNOL-New Orleans, acquired in February 2000, and Tower Distribution (formerly United Video), acquired in
April 2001. On a same station basis, television revenues decreased 7% for the period and 10% for the year-to-date. Period 6 includes
copyright royalties of $7.6 million in 2001 and none in 2000. Year-to-date includes copyright royalties of $18.3 million in 2001 and $11.6
million in 2000. Excluding acquisitions and copyright royalties, television revenues decreased 12% for both the period and the year-to-date.
(C) Excluding acquisitions and copyright royalties, broadcasting and entertainment revenues decreased 9% for the period and 10% for the
year-to-date.
(D) Times Mirror's and Tribune's 2000 fiscal years began on different days. This difference resulted in the seven newly acquired newspapers
having five extra days in Period 1, 2001 compared to Period 1, 2000. Excluding the effect of these extra days, total publishing revenues
decreased 7% for the year-to-date, while advertising revenues decreased 9% from last year. Retail, national and classified advertising were
below last year by 3%, 10% and 15%, respectively.
(E) Excluding acquisitions, copyright royalties and the extra days in 2001 for the seven newly acquired newspapers, consolidated revenues
decreased 9% for the period and 7% for the year-to-date.
14. TRIBUNE COMPANY
PRO FORMA SUMMARY OF NEWSPAPER ADVERTISING VOLUME (Unaudited) (A) (B) (C)
For Period 6 Ended July 1, 2001
(In thousands)
Period 6 (5 weeks) Year-to-Date (26 weeks)
Actual Pro Forma % Actual Pro Forma %
2001 2000 Change 2001 2000 Change
Full Run
258 293 1,348 1,517
L.A. Times (12) (11)
1,103 1,250
Chicago Tribune 214 239 (10) (12)
849 829
Newsday 179 176 2 2
7,137 7,583
Other Daily Newspapers (D) 1,364 1,482 (8) (6)
Total 2,015 2,190 (8) 10,437 11,179 (7)
Part Run
462 642 2,469 3,067
L.A. Times (28) (19)
2,804 2,688
Chicago Tribune 544 534 2 4
835 876
Newsday 179 193 (7) (5)
3,091 2,989
Other Daily Newspapers (D) 567 539 5 3
Total 1,752 1,908 (8) 9,199 9,620 (4)
Total Advertising Inches
Full Run
Retail 622 665 (6) 3,212 3,375 (5)
National 326 367 (11) 1,682 1,910 (12)
Classified 1,067 1,158 (8) 5,543 5,894 (6)
2,015 2,190 10,437 11,179
Sub-Total (8) (7)
Part Run 1,752 1,908 (8) 9,199 9,620 (4)
Total 3,767 4,098 (8) 19,636 20,799 (6)
Preprint Pieces (E)
L.A. Times (F) 142,567 115,104 24 779,334 531,121 47
Chicago Tribune 268,806 271,673 (1) 1,329,424 1,377,225 (3)
Newsday 219,128 203,717 8 1,107,827 1,049,356 6
Other Daily Newspapers (D) 290,786 304,901 (5) 1,639,307 1,649,757 (1)
Total 921,287 895,395 3 4,855,892 4,607,459 5
(A) The pro forma 2000 data assumes that Times Mirror was acquired as of the beginning of 2000. The pro forma data does not
reflect any potential revenue enhancements or other synergies.
(B) Volume is based on preliminary internal data, which may be updated in subsequent reports.
(C) Advertising volume is presented only for daily newspapers.
(D) Other daily newspapers include The Baltimore Sun, South Florida Sun-Sentinel, Orlando Sentinel, The Hartford Courant, The
Morning Call, Daily Press, The Advocate and Greenwich Time.
(E) Preprint amounts have been restated to reflect pieces, rather than inches.
(F) Preprint pieces have been restated to exclude pieces distributed by L.A. Times direct mail operations.