3. UNISYS CORPORATION
CONSOLIDATED BALANCE SHEETS
(Millions)
September 30, December 31,
2005 2004
---------- ----------
Assets
Current assets
Cash and cash equivalents $466.1 $660.5
Accounts and notes receivable, net 1,118.2 1,136.8
Inventories
Parts and finished equipment 86.9 93.7
Work in process and materials 109.1 122.4
Deferred income taxes 24.9 291.8
Prepaid expense and other
current assets 142.6 112.4
---------- ----------
Total 1,947.8 2,417.6
---------- ----------
Properties 1,326.8 1,305.5
Less accumulated depreciation
and amortization 928.9 881.4
---------- ----------
Properties, net 397.9 424.1
---------- ----------
Outsourcing assets, net 428.3 431.9
Marketable software, net 335.3 336.8
Investments at equity 197.1 197.1
Prepaid pension cost 43.3 52.5
Deferred income taxes 187.1 1,394.6
Goodwill 193.1 189.9
Other long-term assets 158.3 176.4
---------- ----------
Total $3,888.2 $5,620.9
========== ==========
Liabilities and stockholders' equity
Current liabilities
Notes payable $4.7 $1.0
Current maturities of long-term debt 60.5 151.7
Accounts payable 413.0 487.4
Other accrued liabilities 1,151.7 1,382.7
---------- ----------
Total 1,629.9 2,022.8
---------- ----------
Long-term debt 1,052.2 898.4
Accrued pension liabilities 638.9 537.9
Other long-term liabilities 708.2 655.3
Stockholders' equity
Common stock 3.4 3.4
Accumulated deficit (2,077.0) (376.2)
Other capital 3,911.7 3,883.8
Accumulated other comprehensive loss (1,979.1) (2,004.5)
---------- ----------
Stockholders' equity (deficit) (141.0) 1,506.5
---------- ----------
Total $3,888.2 $5,620.9
========== ==========
4. UNISYS CORPORATION
CONSOLIDATED STATEMENTS OF CASH FLOWS
(Millions)
Nine Months Ended
September 30
-------------------
2005 2004
------- -------
Cash flows from operating activities
Net income (loss) ($1,700.8) $73.5
Add (deduct) items to reconcile
net income (loss) to net cash
provided by operating activities:
Equity income (3.8) (7.2)
Depreciation and amortization of properties 89.7 99.9
Depreciation and amortization of
outsourcing assets 96.0 88.6
Amortization of marketable software 91.6 96.6
Gain on the sale of properties (15.8)
Loss on the tender of debt 10.7
Decrease (increase) in deferred
income taxes, net 1,474.5 (25.3)
Decrease in receivables, net 20.7 97.2
Decrease in inventories 19.6 19.1
Decrease in accounts payable and
other accrued liabilities (245.9) (260.1)
Increase in other liabilities 199.4 19.8
Increase in other assets (48.8) (9.8)
Other 35.4 50.6
------- -------
Net cash provided by operating activities 22.5 242.9
------- -------
Cash flows from investing activities
Proceeds from investments 5,758.9 4,423.4
Purchases of investments (5,746.2) (4,427.4)
Investment in marketable software (93.7) (88.8)
Capital additions of properties (84.9) (95.5)
Capital additions of outsourcing assets (115.7) (126.6)
Purchases of businesses (.5) (18.6)
Proceeds from sales of properties 23.4
------- -------
Net cash used for investing activities (258.7) (333.5)
------- -------
Cash flows from financing activities
Net proceeds from (reduction in)
short-term borrowings 3.8 (1.0)
Proceeds from employee stock plans 12.8 30.9
Payments of long-term debt (500.2) (2.3)
Proceeds from issuance of long-term debt 541.5
------- -------
Net cash provided by financing activities 57.9 27.6
------- -------
Effect of exchange rate changes on cash
and cash equivalents (16.1) .8
------- -------
Decrease in cash and cash equivalents (194.4) (62.2)
Cash and cash equivalents, beginning of
period 660.5 635.9
------- -------
Cash and cash equivalents, end of period $466.1 $573.7
======= =======
5. Reconciliation of GAAP to Non-GAAP
Financial Information
The preceding release presents information with and
without pension expense. Unisys believes that this
information will enhance an overall understanding
of its financial performance due to the significant
change in pension expense from period to period
and the non-operational nature of pension expense.
The presentation of non-GAAP information is not
meant to be considered in isolation or as a substitute
for results prepared in accordance with accounting
principles generally accepted in the United States.
6. UNISYS CORPORATION
RECONCILIATION OF GAAP TO NON-GAAP
CONSOLIDATED STATEMENTS OF INCOME
(Millions, except per share data)
Three Months Ended
September 30, 2005
----------------------------
US GAAP Less Without
as Pension Pension
Reported Expense Expense
-------- -------- --------
Revenue $1,387.1 $1,387.1
Costs and expenses
Cost of revenue 1,141.1 ($30.2) 1,110.9
Selling, general and
administrative 261.0 (9.1) 251.9
Research and development 61.2 (4.9) 56.3
-------- -------- --------
1,463.3 (44.2) 1,419.1
-------- -------- --------
Operating income (loss) (76.2) 44.2 (32.0)
Interest expense 17.1 17.1
Other income
(expense), net 13.3 13.3
-------- -------- --------
Income (loss) before
income taxes (80.0) 44.2 (35.8)
Provision (benefit) for
income taxes 1,548.2 (13.0) 1,535.2
-------- -------- --------
Net income (loss) ($1,628.2) $57.2 ($1,571.0)
======== ======== ========
Earnings (loss) per share ($ 4.78) $ .17 ($ 4.61)
======== ======== ========
Three Months Ended
September 30, 2004
----------------------------
US GAAP Less Without
as Pension Pension
Reported Expense Expense
-------- -------- --------
Revenue $1,445.7 $1,445.7
Costs and expenses
Cost of revenue 1,104.7 ($17.1) 1,087.6
Selling, general and
administrative 303.7 (4.4) 299.3
Research and development 75.3 (2.0) 73.3
-------- -------- --------
1,483.7 (23.5) 1,460.2
-------- -------- --------
Operating income (loss) (38.0) 23.5 (14.5)
Interest expense 16.2 16.2
Other income
(expense), net (3.0) (3.0)
-------- -------- --------
Income (loss) before
income taxes (57.2) 23.5 (33.7)
Provision (benefit) for
income taxes (82.4) 7.6 (74.8)
-------- -------- --------
Net income $25.2 $15.9 $41.1
======== ======== ========
Earnings per share $ .07 $ .05 $ .12
======== ======== ========
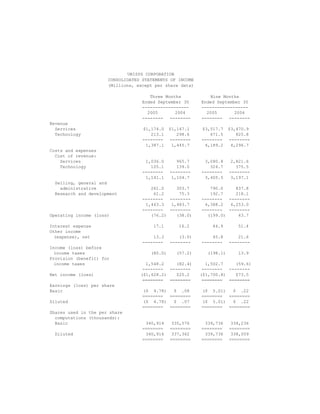
7. UNISYS CORPORATION
RECONCILIATION OF GAAP TO NON-GAAP
CONSOLIDATED STATEMENTS OF INCOME
(Millions, except per share data)
Nine Months Ended
September 30, 2005
----------------------------
US GAAP Less Without
as Pension Pension
Reported Expense Expense
-------- -------- --------
Revenue $4,189.2 $4,189.2
Costs and expenses
Cost of revenue 3,405.5 ($95.0) 3,310.5
Selling, general and
administrative 790.0 (27.1) 762.9
Research and development 192.7 (14.7) 178.0
-------- -------- --------
4,388.2 (136.8) 4,251.4
-------- -------- --------
Operating income (loss) (199.0) 136.8 (62.2)
Interest expense 44.9 44.9
Other income
(expense), net 45.8 45.8
-------- -------- --------
Income (loss) before
income taxes (198.1) 136.8 (61.3)
Provision (benefit) for
income taxes 1,502.7 16.6 1,519.3
-------- -------- --------
Net income (loss) ($1,700.8) $120.2 ($1,580.6)
======== ======== ========
Earnings (loss) per share ($ 5.01) $ .36 ($ 4.65)
======== ======== ========
Nine Months Ended
September 30, 2004
----------------------------
US GAAP Less Without
as Pension Pension
Reported Income Income
-------- -------- --------
Revenue $4,296.7 $4,296.7
Costs and expenses
Cost of revenue 3,197.1 ($50.4) 3,146.7
Selling, general and
administrative 837.8 (14.1) 823.7
Research and development 218.1 (6.0) 212.1
-------- -------- --------
4,253.0 (70.5) 4,182.5
-------- -------- --------
Operating income 43.7 70.5 114.2
Interest expense 51.4 51.4
Other income
(expense), net 21.6 21.6
-------- -------- --------
Income before income taxes 13.9 70.5 84.4
Provision (benefit) for
income taxes (59.6) 22.6 (37.0)
-------- -------- --------
Net income $73.5 $47.9 $121.4
======== ======== ========
Earnings per share $ .22 $ .14 $ .36
======== ======== ========
8. UNISYS CORPORATION
RECONCILIATION OF GAAP TO NON-GAAP
SEGMENT RESULTS OF OPERATIONS
(Millions)
Three Months Ended
September 30, 2005
----------------------------
Less Without
As Pension Pension
Reported Expense Expense
-------- -------- --------
Services Segment
Total revenue $1,178.5 $1,178.5
Gross profit 133.3 ($29.2) 162.5
% of revenue 11.3% 13.8%
Operating income (loss) (60.2) (36.7) (23.5)
% of revenue -5.1% -2.0%
Technology Segment
Total revenue 265.7 265.7
Gross profit 112.6 (1.0) 113.6
% of revenue 42.4% 42.8%
Operating income (loss) (15.6) (7.5) (8.1)
% of revenue -5.9% -3.0%
Total Company
Total revenue 1,387.1 1,387.1
Gross profit 246.0 (30.2) 276.2
% of revenue 17.7% 19.9%
Operating income (loss) (76.2) (44.2) (32.0)
% of revenue -5.5% -2.3%
Three Months Ended
September 30, 2004
----------------------------
Less Without
As Pension Pension
Reported Expense Expense
-------- -------- --------
Services Segment *
Total revenue $1,152.3 $1,152.3
Gross profit 186.2 ($16.7) 202.9
% of revenue 16.2% 17.6%
Operating income (loss) (2.2) (20.6) 18.4
% of revenue -0.2% 1.6%
Technology Segment *
Total revenue 357.0 357.0
Gross profit 182.0 (0.4) 182.4
% of revenue 51.0% 51.1%
Operating income 49.7 (2.9) 52.6
% of revenue 13.9% 14.7%
Total Company
Total revenue 1,445.7 1,445.7
Gross profit 341.0 (17.1) 358.1
% of revenue 23.6% 24.8%
Operating income (loss) (38.0) (23.5) (14.5)
% of revenue -2.6% -1.0%
* 2004 results exclude charges for cost reductions
and related actions as announced on October 6, 2004
9. UNISYS CORPORATION
RECONCILIATION OF GAAP TO NON-GAAP
SEGMENT RESULTS OF OPERATIONS
(Millions)
Nine Months Ended
September 30, 2005
----------------------------
Less Without
As Pension Pension
Reported Expense Expense
-------- -------- --------
Services Segment
Total revenue $3,531.9 $3,531.9
Gross profit 406.6 ($92.1) 498.7
% of revenue 11.5% 14.1%
Operating income (loss) (181.7) (114.6) (67.1)
% of revenue -5.1% -1.9%
Technology Segment
Total revenue 850.0 850.0
Gross profit 382.8 (2.9) 385.7
% of revenue 45.0% 45.4%
Operating income (loss) (9.2) (22.2) 13.0
% of revenue -1.1% 1.5%
Total Company
Total revenue 4,189.2 4,189.2
Gross profit 783.7 (95.0) 878.7
% of revenue 18.7% 21.0%
Operating income (loss) (199.0) (136.8) (62.2)
% of revenue -4.8% -1.5%
Nine Months Ended
September 30, 2004
----------------------------
Less Without
As Pension Pension
Reported Income Income
-------- -------- --------
Services Segment *
Total revenue $3,485.4 $3,485.4
Gross profit 624.0 ($49.3) 673.3
% of revenue 17.9% 19.3%
Operating income 35.2 (61.0) 96.2
% of revenue 1.0% 2.8%
Technology Segment *
Total revenue 977.9 977.9
Gross profit 496.2 (1.1) 497.3
% of revenue 50.7% 50.9%
Operating income 94.0 (9.5) 103.5
% of revenue 9.6% 10.6%
Total Company
Total revenue 4,296.7 4,296.7
Gross profit 1,099.6 (50.4) 1,150.0
% of revenue 25.6% 26.8%
Operating income 43.7 (70.5) 114.2
% of revenue 1.0% 2.7%
* 2004 results exclude charges for cost reductions
and related actions as announced on October 6, 2004
10. UNISYS CORPORATION
RECONCILATION OF GAAP TO NON-GAAP
FORWARD-LOOKING ESTIMATED PRETAX INCOME
(Millions)
Three
Months
Ending
12/31/2005
----------
Pretax income -
on a GAAP basis $5 - $30
Add back estimated pension expense 45
---------
Pretax income -
on a NON-GAAP basis
(excluding pension expense) $50 - $75
=========
NOTE: See section in press release entitled
quot;Forward-Looking Statementsquot;.