Call Girls in New Ashok Nagar, (delhi) call me [9953056974] escort service 24X7
progress energy 04/24/01
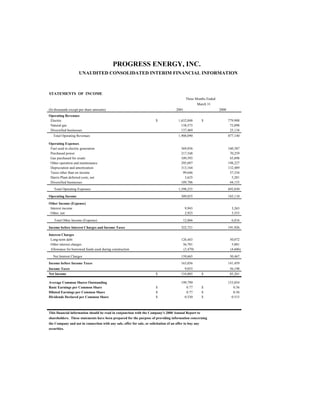
1. PROGRESS ENERGY, INC.
UNAUDITED CONSOLIDATED INTERIM FINANCIAL INFORMATION
STATEMENTS OF INCOME
Three Months Ended
March 31
(In thousands except per share amounts) 2001 2000
Operating Revenues
Electric $ 1,632,048 $ 779,908
Natural gas 138,573 72,098
Diversified businesses 137,469 25,134
Total Operating Revenues 1,908,090 877,140
Operating Expenses
Fuel used in electric generation 369,856 160,387
Purchased power 217,548 70,259
Gas purchased for resale 109,593 43,898
Other operation and maintenance 295,097 198,227
Depreciation and amortization 313,164 132,489
Taxes other than on income 99,646 37,334
Harris Plant deferred costs, net 3,625 5,281
Diversified businesses 189,706 44,155
Total Operating Expenses 1,598,235 692,030
Operating Income 309,855 185,110
Other Income (Expense)
Interest income 9,943 3,263
Other, net 2,923 3,553
Total Other Income (Expense) 12,866 6,816
Income before Interest Charges and Income Taxes 322,721 191,926
Interest Charges
Long-term debt 126,443 50,072
Other interest charges 36,701 5,001
Allowance for borrowed funds used during construction (3,479) (4,606)
Net Interest Charges 159,665 50,467
Income before Income Taxes 163,056 141,459
Income Taxes 9,053 56,198
Net Income $ 154,003 $ 85,261
Average Common Shares Outstanding 199,799 153,054
Basic Earnings per Common Share $ 0.77 $ 0.56
Diluted Earnings per Common Share $ 0.77 $ 0.56
Dividends Declared per Common Share $ 0.530 $ 0.515
This financial information should be read in conjunction with the Company's 2000 Annual Report to
shareholders. These statements have been prepared for the purpose of providing information concerning
the Company and not in connection with any sale, offer for sale, or solicitation of an offer to buy any
securities.
2. Progress Energy, Inc.
BALANCE SHEETS March 31 December 31
(In thousands) 2001 2000
ASSETS
Utility Plant
Electric utility plant in service $ 18,205,786 $ 18,124,036
Gas utility plant in service 382,936 378,464
Accumulated depreciation (9,551,807) (9,350,235)
Utility plant in service, net 9,036,915 9,152,265
Held for future use 16,302 16,302
Construction work in progress 1,186,617 1,043,439
Nuclear fuel, net of amortization 257,574 224,692
Total Utility Plant, Net 10,497,408 10,436,698
Current Assets
Cash and cash equivalents 83,293 101,296
Accounts receivable 652,057 925,911
Taxes receivable - -
Inventory 519,914 420,985
Deferred fuel cost 98,032 217,806
Prepayments 16,594 50,040
Assets Held for Sale, net 782,763 747,745
Other current assets 183,598 192,347
Total Current Assets 2,336,251 2,656,130
Deferred Debits and Other Assets
Income taxes recoverable through future rates 213,639 208,997
Harris Plant deferred costs 41,850 44,813
Unamortized debt expense 38,971 38,771
Nuclear decommissioning trust funds 813,072 811,998
Diversified business property, net 747,173 729,662
Miscellaneous other property and investments 602,163 510,935
Goodwill, net 3,605,862 3,652,429
Other assets and deferred debits 813,619 1,000,579
Total Deferred Debits and Other Assets 6,876,349 6,998,184
Total Assets $ 19,710,008 $ 20,091,012
CAPITALIZATION AND LIABILITIES
Capitalization
Common stock equity $ 5,446,342 $ 5,424,201
Preferred stock of subsidiary - redemption not required 92,831 92,831
Long-term debt, net 9,201,322 5,890,099
Total Capitalization 14,740,495 11,407,131
Current Liabilities
Current portion of long-term debt 202,000 184,037
Accounts payable 325,137 828,568
Taxes accrued 23,535 932
Interest accrued 120,276 121,433
Dividends declared 107,825 107,645
Short-term Obligations 868,315 3,972,674
Other current liabilities 482,911 447,370
Total Current Liabilities 2,129,999 5,662,659
Deferred Credits and Other Liabilities
Accumulated deferred income taxes 1,698,037 1,807,192
Accumulated deferred investment tax credits 242,301 261,255
Other liabilities and deferred credits 899,176 952,775
Total Deferred Credits and Other Liabilities 2,839,514 3,021,222
Total Capitalization and Liabilities $ 19,710,008 $ 20,091,012
SCHEDULES OF COMMON STOCK EQUITY
(In thousands)
Common stock (without par value, authorized 500,000,000, issued and outstanding $ 3,610,146 $ 3,608,902
206,082,949 and 206,089,047 shares, respectively)
Unearned ESOP common stock (119,759) (127,211)
Accumulated other comprehensive loss (34,991) -
Retained earnings 1,990,946 1,942,510
Total Common Stock Equity $ 5,446,342 $ 5,424,201
3. Progress Energy, Inc.
SUPPLEMENTAL DATA Three Months Ended
March 31
2000 (1)
2001
Operating Revenues (in thousands)
Electric
Retail $ 1,323,017 $ 634,667
Wholesale 264,433 129,691
Unbilled (61,878) -
Miscellaneous revenue 106,464 15,550
Total Electric 1,632,036 779,908
Natural gas 138,573 72,098
Diversified businesses 137,469 25,134
Total Operating Revenues $ 1,908,078 $ 877,140
Energy Sales
Electric (millions of kWh)
Retail
Residential 8,722 3,928
Commercial 5,274 2,556
Industrial 4,194 3,400
Other retail 962 341
Total Retail 19,152 10,225
Unbilled (1,168) (65)
Wholesale 4,779 3,708
Total Electric 22,763 13,868
Natural Gas (thousands of dt) 14,845 17,344
Energy Supply (millions of kWh)
Generated - steam 11,913 7,460
nuclear 7,138 5,664
hydro 53 176
combustion turbines 1,137 34
Purchased 3,674 1,032
Total Energy Supply (Company Share) 23,915 14,366
Detail of Income Taxes (in thousands)
Income tax expense (credit) - current $ 35,206 $ 89,837
deferred (19,182) (31,040)
investment tax credit (6,971) (2,599)
Total Income Tax Expense $ 9,053 $ 56,198
FINANCIAL STATISTICS
Ratio of earnings to fixed charges 2.73 3.85
Return on average common stock equity 13.20 % 11.31 %
Book value per common share $ 27.24 $ 22.38
Capitalization ratios
Common stock equity 36.95 % 47.55 %
Preferred stock of subsidiary- redemption not required 0.63 0.81
Long-term debt, net 62.42 51.64
Total 100.00 % 100.00 %
(1) Supplemental data does not include information related to Florida Progress for the three months ended
March 31, 2000.
4. Progress Energy, Inc.
Reported Earnings Variance Analysis
First Quarter 2001 vs. 2000
Florida Regulated Energy Other
(Per share) CP&L Power Natural Ventures Diversified Corporate Consolidated
(Electric) (Electric) Gas Business Unit Businesses
2000 earnings 0.56 - 0.06(E) (0.06)(E) 0.56
Weather - -
Customer growth and usage 0.04 0.04
Other margin 0.04 (0.01) 0.03
Addition of FPC operations 0.36(C) 0.14 (0.01) (0.11)(G) 0.38
O&M 0.09 (A) (0.01) 0.08
Interest charges (0.04) (0.18) (0.22)
Goodwill (0.10) (0.10)
Diversified businesses 0.07 0.06 0.13
Share dilution (0.14) (B) (0.14)(B)
Income taxes - other 0.05 0.05 (D)
Eliminations/other (0.04)(G) (0.04)
2001 earnings 0.60 (F) 0.36(F) 0.04 0.21 (0.01) (0.43) 0.77
Regulated Natural Gas includes NCNG and Eastern NCNG
Energy Ventures includes Electric Fuels, Progress Energy Ventures, and Monroe Power
Other Diversified Businesses includes SRS and Progress Telecom
Corporate includes eliminations, interest expense, goodwill and intra-period tax allocations
(A) .01 related to exclusion of NCNG, .04 related to Jan 2000 ice storm
(B) Related to issuance of 46.5 million common shares in connection with FPC acquisition in Dec 2000
(C) See Table 1
(D) Income statement line items are tax-effected at the statutory rate. Differences between the statutory and effective rates
are reflected in quot;Income taxes-otherquot;. The year-to-date variance primarily results from depreciation permanent differences.
(E) These companies were moved from a subsidiary of CP&L to Progress Energy in June 2000 with the holding company formation.
(F) Includes approximately .06 per share in CP&L and .04 per share in Florida Power related to energy marketing and trading.
(G) Includes intra-period tax allocation adjustment which will vary each quarter. These adjustments will reverse for the year 2001.
Table 1
Florida Power
Reported Earnings Variance Analysis
First Quarter 2001 vs. 2000
2000 earnings $ 0.64
Weather 0.04
Customer growth and usage 0.02
O&M 0.02
Share dilution (0.32)
Depreciation (0.01)
Other taxes (0.02)
Eliminations/other (0.01)
2001 earnings $ 0.36