Weitere ähnliche Inhalte Ähnlich wie Manager Performance October-march (20) Kürzlich hochgeladen (20) 1. Trade Leaders deliver real results
Notes:
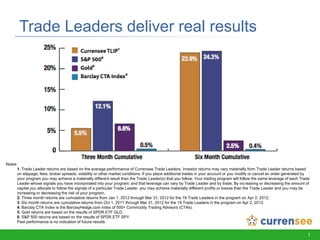
1. Trade Leader returns are based on the average performance of Currensee Trade Leaders. Investor returns may vary materially from Trade Leader returns based
on slippage, fees, broker spreads, volatility or other market conditions. If you place additional trades in your account or you modify or cancel an order generated by
your program you may achieve a materially different result than the Trade Leader(s) that you follow. Your trading program will follow the same leverage of each Trade
Leader whose signals you have incorporated into your program; and that leverage can vary by Trade Leader and by trade. By increasing or decreasing the amount of
capital you allocate to follow the signals of a particular Trade Leader, you may achieve materially different profits or losses than the Trade Leader and you may be
increasing or decreasing the risk of your program.
2. Three month returns are cumulative returns from Jan 1, 2012 through Mar 31, 2012 for the 19 Trade Leaders in the program on Apr 2, 2012.
3. Six month returns are cumulative returns from Oct 1, 2011 through Mar 31, 2012 for the 19 Trade Leaders in the program on Apr 2, 2012.
4. Barclay CTA Index is the BarclayHedge.com index of 500+ Commodity Trading Advisors (CTAs).
5. Gold returns are based on the results of SPDR ETF GLD.
6. S&P 500 returns are based on the results of SPDR ETF SPY.
Past performance is no indication of future results.
© 2011 Currensee, Inc. | Currensee is member #0403251 of the National Futures Association (NFA) 1
2. Trade Leader performance
Leader Ticker Oct Nov Dec Jan Feb Mar Six Months
Chen Investments CHCMP.S 20.6% 15.1% 1.4% -13.9% 2.1% -3.1% 19.9%
Fex-Cor DMKRW.B 4.9% 7.7% -0.8% 5.9% 6.8% 3.3% 30.9%
Gabor Trading B GAFLL.B -4.8% -4.8% 0.8% -2.5% 1.8% -0.9% -10.1%
Gabor Trading C GAFLL.C 0.4% -7.6% 4.9% -4.3% -0.1% 8.1% 0.6%
JCB FX Trading JACCG.A -2.2% 6.7% 6.2% 5.4% -7.8% -6.9% 0.3%
Janus Trading A JASMI.A 2.4% 2.2% -0.7% -1.2% -2.1% 1.9% 2.4%
JoinyFX A JOJAR.A 1.3% 3.9% 1.8% 1.6% 0.5% -4.0% 5.0%
JoinyFX C JOJAR.C -8.0% 19.9% 6.6% 4.4% -1.4% -0.5% 20.4%
JL FX Network JOLSU.G 0.7% 2.0% 0.5% 0.2% 3.2% 2.8% 9.7%
Koji Trading KOUES.A 11.7% 11.0% 5.1% -0.7% -3.6% -1.0% 23.5%
LW Trading A LIWWK.A 10.2% -6.6% 5.4% -6.1% -0.1% 11.9% 13.9%
MM Investments MOMBR.I 46.0% 18.1% 11.7% 8.4% 0.0% 7.9% 125.3%
NTForex Trading NETBK.A 3.8% -0.1% 3.3% -3.3% 8.9% 3.8% 17.1%
White Stone Asset Mgt OLIDR.A 10.8% 13.1% 11.6% 9.9% 1.4% 24.0% 93.3%
Adantia LLC ROCED.A 2.9% 3.3% 0.5% 1.3% 0.3% 6.4% 15.5%
TCM Spencer Beezley SPBJP.A 1.2% 0.6% 0.4% -1.6% -2.1% 1.6% 0.0%
Taylor Growth TAGUP.A 7.0% 1.9% 2.0% 0.7% -0.9% 2.8% 14.1%
TCM BAK TCBRF.A 7.8% 8.6% 0.7% 8.0% 5.2% 4.6% 40.1%
TK Trading TKTRK.A 8.0% 3.9% 3.3% 4.2% 3.9% 5.6% 32.5%
Average ALL 6.6% 5.2% 3.4% 0.9% 0.8% 3.6% 23.9%
Chart based on actual monthly Trade Leader results from Oct 1, 2011 through Mar 31, 2012 for the 19Trade Leader accounts in the program on Apr 2. Trade Leader past performance is not necessarily indicative of future results. Investor
returns may vary materially from Trade Leader returns based on slippage, fees, broker spreads, volatility or other market conditions. If you place additional trades in your account or you modify or cancel an order generated by your program you
may achieve a materially different result than the Trade Leader(s) that you follow. Your trading program will follow the same leverage of each Trade Leader whose signals you have incorporated into your program; and that leverage can vary by
Trade Leader and by trade. By increasing or decreasing the amount of capital you allocate to follow the signals of a particular Trade Leader, you may achieve materially different profits or losses than the Trade Leader and you may be
increasing© 2011 Currensee, Inc. | Currensee is member #0403251 of the National Futures Association (NFA)
or decreasing the risk of your program. 2