Content-based filtering with applications on tv viewing data
1. CONTENT-BASED FILTERING WITH APPLICATION ON TV
VIEWING DATA
Preparation of Camera-Ready Contributions to INSTICC Proceedings
Elaine Cecília Gatto, Sergio Donizetti Zorzo
Department of Computer Science, Federal University of São Carlos,
Rodovia Washington Luís, Km 235, PO Box 676, São Carlos, Brazil
elaine_gatto@dc.ufscar.br, zorzo@dc.ufscar.br
Keywords:
Personalization, Recommendation, Information Filtering, Brazilian Digital TV, Content-Based Filtering,
Recommendation System, Collaborative Filtering, Hybrid Filtering, One-Seg, Full-Seg, Middleware Ginga,
Cosine, Apriori.
Abstract:
Recommendation systems provide recommendation based on information about users’ preferences.
Information Filtering is used by recommendation systems so as information can be processed and suggested
to users; and Content-Based Filtering is an Information Filtering approach very used in recommendation
systems. Content-Based Filtering analyses the correlation of items content with the user’s profile,
suggesting relevant items and putting away irrelevant items. Recommendation systems, which are very
much used on the Internet, have been studied in order to be used on Digital TV context, and there already
are several works in this sense. As they are used on the Internet, recommendation systems can be used in
Digital TV in order to recommend TV programs, publicity and advertisement and also the electronic
commerce. Thus, within Digital TV context, the items can be programs, advertisements and the products to
be sold; and using Content-Based Filtering in the recommendation programs, for instance, these programs’
contents can be correlated with the user’s preferences, which in this scenario, are the type of program one
wants to watch. This paper presents the studies accomplished with Content-Based Filtering with application
on Digital TV data. The survey aims at observing and evaluating how some filtering techniques based on
content can be used in recommendation systems in Digital TV context.
1
INTRODUCTION
Digital TV implementation in Brazil provides
new markets which can be explored. Well-succeeded
technologies as those in Web environment, for
example, can be applied in Digital TV domain and
achieve the same success.
The interaction either through the remote control
or the cell phone keyboard etc by the user today, will
allow many applications to be carried to this
environment.
One of the areas which has been extensively
studied and is well-succeeded in the Web is that of
personalization. There are some surveys concerning
recommendation systems for Digital TV as for
example (Ávila, 2010), (Lucas, 2009), (Uribe,
2009), (Solla et al, 2008), (Bar et al, 2008),
(Einarsson, 2007), (Chorianopoulus, 2007), (Choi,
Koh and Lee, 2007), (Yu et al, 2006), (Silva, 2005),
(Bozios et al, 2001), (Gutta et al, 2000), (Das and
Horst, 1998), among others.
Recommendation systems can contribute to a
better use of Digital TV in residences, in groups or
individually, in a cell phone, for example. These
systems can help the user to choose the program,
avoiding waste of time and of course, suggesting to
the user programs which really interest him.
Moreover, recommendation systems can be applied
to publicity and advertisement on Digital TV, as
well as in the T-Commerce.
This paper is structured as follows: Section 1
provides a brief introduction to the survey, Section 2
deals briefly with recommendation systems and its
techniques; Section 3 quickly describes Brazilian
current conditions related to Digital TV; Section 4
presents tests performed with TV viewing data;
Section 5 presents the outcomes from the tests and
Section 6 concludes the paper.
2. 2
RECOMMENDER SYSTEMS
In a typical recommendation system, the users
provide recommendation as inputs which are then
added and directed to proper receivers. (Resnick,
1997)
With the first articles on collaborative filtering
around the 90’s, recommendation systems became
an important area of research. Recommendation
systems comprise several technologies as cognitive
science,
approximation
theory,
information
recovery, forecast theories, among others, and can
be applied to several domains.
The recommendation problem in its most
common form is reduced to a way of evaluating
items which were not seen by a user. Evaluation of
non-evaluated items can be estimated in many
different ways, frequently classified according to its
approach to classification estimate. In Sections 2.1,
2.2 and 2.3, recommendation systems classification
is presented. (Adomavicius, 2005)
2.1
Content-Based Filtering
Content-Based Filtering (CBF) uses the content
attributes to describe the content of the items and
then calculate the similarity. This approach does not
depend on other users’ evaluation about the items.
(Einarsson, 2007)
CBF is an information recovery technique
which bases its forecast on the fact that previous
preferences of the users are reliable indicators for
future behavior. (Chorianopoulos, 2007)
In order to formulate recommendations, a
variety of algorithms has been proposed to evaluate
the content of documents and find regularities. Some
of these algorithms operate with classification
knowledge and others operate with the problem of
regression. (Pazani, 1999)
Some of the problems and limitations found
in systems using CBF are super specialization, the
problem of the new user and the analyses of limited
content. The following 2.2.1 and 2.2.2 subsections
describe two techniques which can be used in CBF
and which were applied in our survey.
(Adomavicius, 2005)
2.2.1 Apriori
The algorithms of association techniques identify
associations between register of data related in some
way. The major premise finds elements which
require the presence of others in a same transaction,
aiming at determining what is related.
Association rules interconnect objects trying to
present characteristics and tendencies. Association
findings must evidence either common associations
or uncommon associations.
Apriori algoruthm is frequently used to mine
association rules. Apriori operates with a high
number of attributes, creating several combinations
among them and performing consecutive search in
the whole database, keeping a great performance in
terms of time spent in the processing.
The algorithim tries to find all the relevant
association rules between the items, which have the
X format (precedent) ==> Y (consequent). If x% of
transactions which have X also have Y, so x%
represents the confidence factor (power of
confidence of the rule). The support factor is a
measure corresponding to x% of X and Y occurance
simultaneously upon the total of registers
(frequency). (Witten, 2005)
2.2.2 Cossine
Cosine is a similarity measure, a metrics which can
be applied to discover if an item has correlation or
not with the user profile. In many recommendation
systems for the Web, the applied techniques use the
evaluation performed by the users, for the products
consumed to calculate the similarity.
In our context, this evaluation by the user is not
possible yet, therefore, we used the time a person
spent watching the program as an evaluation. In the
same way we found an alternative, virtual stores
which do not require users’ evaluation for its
products can consider “consumed product” and not
“non-consumed product” as an evaluation.
A binary vector is a set of two elements, x and y.
In an n-dimensional space, where n is the number of
items of the vector, it is possible; therefore, calculate
the cosine between the vectors, thus evaluating the
similarity between the user profile and its history.
The similarity is high when the cosine value is high.
The cosine formula is presented below:
( p.e )
cos( p, e )
| p |.| e |
(1)
Where is the profile vector and is the EPG
vector. The symbol
means the profile vector
standard and the symbol the EPG vector standard .
(Torres, 2004, 2009)
3. 2.2
Collaborative Filtering
Collaborative Filtering (CF) is a technique which
uses the similarity between users in order to generate
recommendations and it first came to light in the
90’s, with Tapestry system, different from CBF
which calculates the similarity between the items.
CF stores the users’ evaluation about each item
and based on this information, finds people with
similar profile, the so-called nearest neighbors, who
are then gathered and the products with high
evaluations by neighbors are recommended.
(Balabanovic, 1997; Torres, 2004)
Even solving some CBF problems, CF introduce
others as the problem of the new user, the problem
of the new item and the sparcity.
2.3
Hybrid Filtering
Hybrid filtering mixes CBF and CF in a sole system,
improving recommendation offered to user and thus,
seeks to solve some of the problems introduced by
both techniques.
This way, recommendation methods in this
category can be matched in many ways: a) CF
sequentially processed after CBF; CBF sequentially
processed after CF and CBF parallelly processed
with the CF. (Einarsson, 2007; Adomavicius, 2005)
3
BRAZILIAN DTV
Since December, 2007 in Brazil, the implantation
of Brazilian Digital TV has been innovating by
matching Japanese technology with technology
developed by Brazilian universities.
Besides having all the advantages of Japanese
system, Brazilian system counts on Ginga
Middleware which uses LUA, NCL and Java
languages, totally developed by national researches.
Peru, Argentina, Chile and Venezuela chose the
Nipo-Brazilian standard of Digital TV which is
already part of UIT. Nipo-Brazilian standard offers
quality of image and sound, mobility, portability,
flexible interactivity; it is free of royalties and
provides the development of commercial, playful,
informative,
governmental,
social
inclusion
applications, among others. (SBTVD Forum, 2009)
The standard (ABNT NBR 1564, 2008) defines
the set of essential functionalities required from
reception devices of 13-segment digital television –
Full-seg – as well as from one-segment – One-seg –
designated to receive signals in fix, mobile and
portable modality.
Table 1: Number of Individuals per Residence.
Residence
Individuals
TVs
1
2
1
2
3
1
3
3
2
4
2
2
5
2
1
6
3
2
Table 2: Social-economic characteristics at Residences 1,
2 and 3.
Residence
Social
Class
Residence
Age of the
hostess
Level of
education of
the owner of
the house
Individual 1
gender
Individual 1
age
Individual 2
gender
Individual 2
age
Individual 3
gender
Individual 3
age
1
2
3
DE
C
C
1
2
3
44
45
39
Incomplete
Primary
School
Incomplete
High
School
Incomplete
High
School
Female
Female
Female
8
48
40
Female
Male
Male
-
17
13
-
Female
Female
-
-
-
Table 3: Social-economic characteristics in Residences 4,
5 and 6.
Residence
Social
Class
Age of the
hostess
Level of
education of
the owner of
the house
Individual 1
gender
Individual 1
age
Individual 2
gender
Individual 2
age
Individual 3
gender
Individual 3
age
4
5
6
AB
C
AB
32
60
36
Complete
High
School
Complete
High
School
Complete
High
School
Female
Female
Female
30
77
38
Male
Male
Male
-
-
14
-
-
Male
-
-
-
4. Still according to this standard, full-seg
classification is applicable to digital converters – settop box – and to 13-segment receptors integrated to
the viewing screen, but not exclusive to these; and
one-seg classification is designated to portable-type
receptors – handheld – specially recommended for
smaller screens, commonly up to 17,80 inches.
The content can be then displayed in many
different devices, as well as diversified services can
also be formulated for each one, allowing the
creating of new business models and new
opportunities for professionals.
Ginga is the name of the middleware developed
by researches performed by Telemedia laboratories
at PUC-Rio and LAViD at UFPB. The middleware
is divided in Ginga-NCL/LUA, corresponding to the
declarative part and Ginga-J, the imperative part.
(GINGA, 2010)
4
TESTS
So as the test could be performed, data
corresponding to TV viewing and from the TV guide
were used. This data was provided by IBOPE. The
characteristics of this data and the performed tests
are detailed in the following subsections.
4.1
Characteristics of Residence
Data provided by IBOPE correspond to 15-day
monitoring at 6 Brazilian residences with Open TV
programs.
These residences were monitored minute-tominute, as well as each individual was monitored
separately. Table 1 shows the number of individuals
and TVs by residence, Table 2 presents the socialeconomic information of residences 1, 2 and 3; and
Table 3 deals with residences 4, 5 and 6.
4.2
presents the names of broadcasting stations with the
number of programs and genres transmitted.
Characteristics of Date
Data used for these tests undergone a manual
process of adaptation. For each of the algorithms
used, it was necessary a pre manual processing so as
they could be correctly analyzed and used.
Subsections 4.2.1 and 4.2.2 detail the composition of
these data.
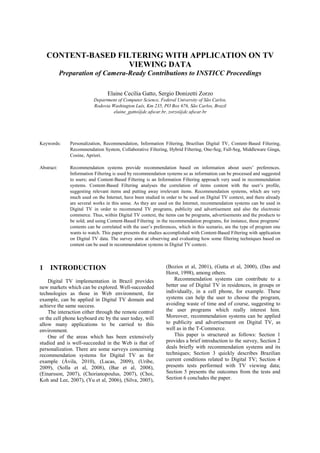
4.2.1 EPG
EPG provided by IBOPE corresponds to the 15-day
schedule of 10 broadcasting stations. Figure 1 shows
the types of data which composes EPG and Table 4
Figure 1: Types of data composing EPG.
Table 4: Number of broadcasting stations, programs and
genres in EPG.
1
2
3
4
5
6
7
8
9
10
Broadcasting
stations
Bandeirantes
Gazeta
Globo
MTV
RBI TV
Record
Record News
Rede TV
SBT
TV Cultura
Programs
Genres/Subgenres
70
40
76
149
46
42
100
67
61
167
23
10
18
12
12
15
10
20
15
22
4.2.2 User History
Users’ viewing history is necessary in order to
discover their preferences.
In the Digital TV context we are considering,
this data are collected and stored implicitly.
Figure 2 presents the composition of data and
Table 3 presents a sample of data in the viewing
history.
Table 5: Amostra do histórico de usuário.
Field
startSyntonization
endSyntonization
durationSyntonization
Date
timeStart
timeEnd
Content
2008-03-05 09:28:00
2008-03-05 12:59:00
03:31:00
2008-03-05
09:28:00
12:59:00
5. duration
periodSyntonization
day of the week
Programcode
Programname
Broadcastingstationcode
Broadcastingstationname
Genre
Genredescriber
Subgenre
Subgenredescriber
genreSubgenre
GeneroSubgenerodescriber
211
morning
Wednesday
003217
HOJE EM DIA
006
Record
0x6
Variety
0X0F
Others
0x6_0X0F
Variety_Others
marked in the matrix with the value of 1 and the
remaining is marked with the value of 0. This has
been done for all programs composing EPG.
After this, a table called “profile” was created
which stores the user profile found consulting SQL,
which is showed in a simple way, in Figure 3 below.
The “profile” table is presented in Figure 4.
Select avg(ded1), avg(dee1), …,
avg(vs1)
from (select domicilio.nomePrograma,
domicilio.descritorGeneroSubgenero,
duracao*DED as ded1,
duracao*DEE as dee1, …,
duracao*VS as vs1
from domicilio, matrizepg
where domicilio.nomePrograma =
matrizepg.nomePrograma
order by duracao desc) as result;
After that, a variable was set:
set @profilenorm=
(select sqrt(ded1*ded1+dee1*dee1+ …
+vs1*vs1)from profile);
Figure 2: Types of data composing the user history.
4.3
Methodology
In order to carry out the tests, we simulated the
generation of recommendations and profile for each
residence, using two different techniques, Apriori
and Cosine.
For the Cosine, we used MySql databank. For
each new day, we inserted in the databank
correspondent to the viewings and then, we applied
the recommendation technique, we discovered the
profile and which program to recommend.
The process occurs in an interactive systematic
way. First, data corresponding to the first day of
monitoring is inserted in the databank and the EPG
matrix is created, that is, EPG is transformed in a
matrix containing, besides the data in Figure 2, the
Genres and Subgenres of each program separately,
as presented in Figure 3. Each abbreviation indicates
one genre/subgenre.
If a program belongs to one or more
genre/subgenre, as for example, sport and
documentary journalism, these genres/subgenres are
Figure 3: Fields added to EPG generating EPG
Matrix.
Figure 4: Table Profile.
6. And finally, the final result with the following
consult:
select nomePrograma,
descritorGeneroSubgenero,
dot/(@profilenorm*norm) as cos,
DED, DEE, …, VS
from (select nomePrograma,
descritorGeneroSubgenero,
sqrt(DED*DED+DEE*DEE+…+VS*VS) as norm,
DED*ded1+DEE*dee1+…+VS*vs1) as dot,
DED, DEE, …, VS
from matrizepg, profile) as normdot
group by nomePrograma
order by cos asc;
Thus, the programs which can be recommended
to the user according to his profile were found. The
same thing can be done to fid only the
genres/subgenres.
For Apriori, Weka tool was used having as
parameters minima support o,1, reliance 0,9, class
attribute index -1, total of 20 rules and enabled car
providing the mining of the association rules instead
general rules of association.
StringToNominal
and
NumericToNominal
conversion filters were also applied in some fields,
generating the rules and saving the outputs. Below is
a small sample of these rules:
1.genero=0x62==>descritor=Variedade_Out
ros2conf:(1)
2.descGenero=Variedade2==>descritor=Var
iedade_Outros2conf:(1)
3.subGenero=0X0F2==>descritor=Variedade
_Outros2conf:(1)
4.descSubGenero=Outros2==>descritor=Var
iedade_Outros2conf:(1)
5.genSubg=0x6_0X0F2==>descritor=Varieda
de_Outros2conf:(1)
6.dia=2008-0305genero=0x62==>descritor=Variedade_Out
ros2conf:(1)
5
RESULTS
After describing the methodology used, this sections
presents the results. The techniques were applied;
the results were evaluated and verified to see if
correct recommendation was being generated.
For the case of Cosine, the existence of programs
seen by the user in the following day in the results
based in the previous day was verified. This was the
best way for the evaluation, for the evaluation
cannot be done directly with the users, however, it is
possible to know what the user has seen before and
after each step.
Thus, two additional tables were created; one in
order to store the result of the cosine and the other to
store only what was seen in the following day. These
tables
were
called
“recommend”
and
“residence_test” and the following SQL consult was
used to evaluate:
select r.*, dt.nomePrograma,
dt.descritorGeneroSubgenero
from recomenda r, domicilio_teste dt
where dt.nomePrograma = r.nomePrograma
group by r.nomePrograma
order by cos desc;
This way it is possible to discover if in the
following day, the individual watched some program
which is in the “recommend” table and to verify the
value of its cosine. If this value is near 1, then we
can say that the cosine gave a right forecast.
A behavior in which 5 recommendations were
offered was simulated. If any of these 5
recommendations were seen on the next day and if
its cosine is near 1, so it is assumed that the
recommendation was accepted.
Figures 5 to 10 present the percentage of right
cosine, during 15 days of monitoring in each
residence, according to our methodology of
simulation. Figure 11 presents the average of all
residences.
Graphics were generated with the following
formula:
Percentage=
Number of Hits (0 a 5)
Number of recommendations (5)
(2)
For the case of Apriori, it was possible to verify
if the individual had seen some of the
genres/subgenres identified in the rules in the
following day. These are a little different approach.
While in Cosine the operation was direct with the
names of the programs, in Apriori, the genres and its
respective subgenres were used.
The same methodology to simulate the cosine
was used for the Apriori. Figures from 12 to 17
present the hit percentage of Apriori, during 15 days
of monitoring in each residence, according to the
7. simulation methodology. Figure 18 presents the
average of all residences and Figure 19 presents a
comparison between the averages of each one of the
techniques for all the residences.
Figura 8: Percentage of cosine hits, during 15 days in
residence 4.
Figura 5: Percentage of cosine hits, during 15 days in
residence 1.
Figura 9: Percentage of cosine hits, during 15 days in
residence 5.
Figura 6: Percentage of cosine hits, during 15 days in
residence 2.
Figura 10: Percentage of cosine hits, during 15 days in
residence 6.
Figura 7: Percentage of cosine hits, during 15 days in
residence 3.
8. Figura 11: Average of the Cosine in all residences.
Figura 14: Percentage of Apriori hits, during 15 days,
in residence 3.
Figura 12: Percentage of Apriori hits, during 15 days,
in residence 1.
Figura 15: Percentage of Apriori hits, during 15 days,
in residence 4.
Figura 13: Percentage of Apriori hits, during 15 days,
in residence 2.
Figura 16: Percentage of Apriori hits, during 15 days,
in residence 5.
9. Table 6: Difference between Apriori and Cosine.
Residence 1
Residence 2
Residence 3
Residence 4
Residence 5
Residence 6
Figura 17: Percentage of Apriori hits, during 15 days,
in residence 6.
However, apriori provided other kinds of
information which are difficult to collect with the
cosine, concerning the user's behavior in each
residence. While cosine is focused to select the
programs to be recommended according to the
profile generated also by the cosine, it is possible to
use apriori to find out other characteristics and thus
improve the quality of recommendations.
Table 7 present some of these characteristics.
This table presents the day of the week, the period of
the day, the genre/subgenre and the broadcasting
station watched by each one in the residences. This
information is independent, for example, a residence
might have watched soap opera, but this soap opera
is not necessarily from the most watched
broadcasting station
Table 7: Characteristics found out with apriori.
Figura 18: Average of the Apriori in all residences.
Period
of the
day
Afterno
on
R
Thursday
2
Wednesda
y
Evening
3
Thursday
Evening
4
Sunday
Evening
5
Friday
Evening
6
Certainly, the difference between the techniques
is visible and presented in Table 6. It is important to
point out that although the methodology is the same
for both, the techniques were observed and analyzed
by different point of views, the cosine directed to the
name of the program and the apriori for
genres/subgenres.
Day of the
week
1
Figura 19: Comparison of the hits average between
Apriori and the Cosine in all residences.
19%
8%
5%
16%
8%
28%
Friday
Evening
Genre/
Subgenre
Variety_other
s
Soap Opera_
Soap Opera
children_child
ren
Soap Opera_
Soap Opera
Journalism_ne
wcast
Soap Opera_
Soap Opera
Broadca
sting
station
record
Globo
Globo
Record
Globo
Record
It could also be seen that the apriori used in these
data tend to be super-specialized, always finding the
same genres and subgenres to recommend. This
shows that it is necessary operate together with other
techniques to create the surprise recommendation to
the user, particularly in this case.
The data we have are simple and do not have
details as synopsis, name of the actors, directors,
sport categories etc. It is expected that, in Brazilian
Digital TV, these attributes are present, increasing
the probabilities of recommending not only the
obvious but also something new that the user would
probably watch.
10. 6
CONCLUSION
According to the studies presented herein, it is
possible to apply FBC in TV viewing data and thus,
it can also be applied for developing
recommendation systems for Digital TV,
particularly in Brazil.
Two different techniques were used in the same
data and it was possible to note that, despite the
differences among them, both can be used in order
to find out the profile and to provide
recommendations, as well as they can be used
together to provide even better recommendations.
There are also other FBC and FC techniques
which will be tested in future works, together with
hybrid techniques. More detailed data is also
expected as synopsis, indicative classification,
among others, in order to improve the quality of
recommendations in TV viewing domain.
ACKNOWLEDGEMENTS
We thank IBOPE for providing real data about the
electronic program guide and also the viewer’s
behavior data from March, 05, 2008 to March, 19,
2008.
REFERENCES
ABNT NBR 15604:2008. Televisão Digital Terreste
Receptores. 07/04/2008. 68 pages.
Ávila, P. M. Recommender TV: Suporte ao
Desenvolvimento de Aplicações de Recomendação
para o Sistema Brasileiro de TV Digital. Dissertação
de Mestrado. 90 pages, 2010.
Adomavicius, G.; Tuzhilin, A. Towards the Next
Generation of Recommenders Systems: A Survey of
the State-of-the-Art and Possible Extensions. IEEE
Transactions on Knowledge and Data Engineering,
vol. 17, Issue 6, p. 734-749, June 2005.
Balabanovic, M. ; Shohan, Y. Content-Based,
Collaborative Recommendation. Communications of
the ACM, New York, vol. 40, n.3, p. 66-72, March
1997.
Bär, A. et al. A Lightweight Mobile TV Recommender:
Towards a One-Click-to-Watch Experience. In
Proceedings 6th European Interactive TV Conference,
p.142-147, Salzburg, Áustria, 03-04/07/2008.
Bozios, T. et al. Advanced Techniques for Personalized
Advertising in a Digital TV Environment: The iMedia
System. In Proceedings of the eBusiness and eWork
Conference, p. 1025-1031, IOS press, 2001.
Choi, J. Y.; Koh, D.; Lee, J. Ex-ante simulation of mobile
TV market based on consumers’ preference data. In
Proceedings of the Technological Forecasting &
Social Change, p. 1043-1053, 2007.
Chorianopoulos, K. Personalized and mobile digital TV
applications. In Proceedings of the Multimedia Tools
and Aplications, p. 1- 10, vol.36, 27 January 2007.
Cristo, M. Sistemas de Recomendação, Métodos e
Avaliação. 81 slides. 2009.
Das, D. and ter Horst, H. Recommder Systems for TV. In
Proceedings of 15 th AAAI Conference, Madison,
Wisconsin, July 1998.
Einarsson, O. P. Content Personalization for Mobile TV
Combining Content-Based and Collavorative Filtering.
Master Thesis. Center for Information and
Communication Technologies. Technical Univesity of
Denmark. August 22, 2007.
Fórum SBTVD. TV digital nipo-brasileira agora é
oficialmente referência mundial. Available in:
<http://www.forumsbtvd.org.br/materias.asp?id=238>,
Acess in January 2010, 09h00.
Ginga. Available in: <http://www.ginga.org.br/>, Acess in
January 2010. http://www.ginga.org.br/
Gutta, S. et al. TV Content Recommender System. In
Proceedings of the 17th National Conference of AAAI,
Austin, TX, 2000.
Lucas, A. Personalização para Televisão Digital utilizando
a estratégia de Sistema de Recomendação para
ambientes multiusuário. 103 pages. 2009.
Pazzani, M. J. A framework for Collaborative, ContentBased and Demographic Filtering. Artificial
Intelligence Review, p. 393-408, December 1999.
Resnick, P.; Varian, H. R. Recommender Systems.
Communications of the ACM, New York, vol. 40, n. 3,
p. 77-87, March 1997.
Silva, F. S. Personalização de Conteúdo na TVDI Através
de um Sistema de Recomendação Personalizada de
Programas de TV (SRPTV). In III Fórum de
Oportunidades em Televisão Digital Interativa, Poços
de Caldas, Minas Gerais, Brasil, 2005.
Solla, A. G. et al. ZapTV: Personalized User-Generated
Content for Handheld Devices in DVB-H Mobile
Newtorks. In Proceedings 6th European Interactive
TV Conference, p.193-203, Salzburg, Áustria, 0304/07/2008.
Torres, R. Personalização na Internet. Editora Novatec,
157 pages, São Paulo, Brazil, 2004.
Uribe, S. et al. Mobile TV Targeted Advertisement and
Content Personalization. In 16th International
Workshop Conference on Systems, Signals and Image
Processing, Chalkida, Greece, 18-19/06/2009.
Witten, I. H.; Frank, E. Data Mining: Practical Machine
Learning Tools and Techniques, 2nd Edition, Morgan
Kaufmann, 525 pages, June 2005.
Yu, Z. et al. TV program recommendation for multiple
viewers based on user profile merging. In Proceedings
of the User Model User-Adap Inter, p. 63-82, 2006.