Study speed matters for google web search

Of course the classic "Speed Matters" study. This study is one that devknob references often along with Al Pacino's speech from any given sunday. We claw with our fingernails for these inches, even 10-20kb. If you don't think the little stuff matters, read this, and you'll understand why conversion rate optimization is not ideally performed with the current tools available. According to devknob, and this study from Google, conversion rate optimization begins with page speed, broad variations & best efforts and moves directly into finding the statistical confidence needed via multivariate and split testing campaigns to determine the best variants for revenue, transactions, interactions and favorable metrics that help with rankings, customer satisfaction and improved average lifetime value.
Empfohlen

Empfohlen
Weitere ähnliche Inhalte
Ähnlich wie Study speed matters for google web search
Ähnlich wie Study speed matters for google web search (20)
Mehr von Bitsytask
Mehr von Bitsytask (20)
Kürzlich hochgeladen
Kürzlich hochgeladen (20)
Study speed matters for google web search
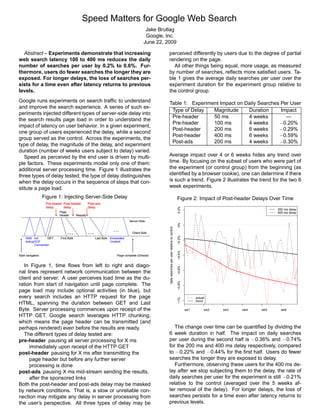
- 1. Speed Matters for Google Web Search Jake Brutlag Google, Inc. June 22, 2009 Abstract – Experiments demonstrate that increasing web search latency 100 to 400 ms reduces the daily number of searches per user by 0.2% to 0.6%. Fur- thermore, users do fewer searches the longer they are exposed. For longer delays, the loss of searches per- sists for a time even after latency returns to previous levels. Google runs experiments on search traffic to understand and improve the search experience. A series of such ex- periments injected different types of server-side delay into the search results page load in order to understand the impact of latency on user behavior. In a given experiment, one group of users experienced the delay, while a second group served as the control. Across the experiments, the type of delay, the magnitude of the delay, and experiment duration (number of weeks users subject to delay) varied. Speed as perceived by the end user is driven by multi- ple factors. These experiments model only one of them: additional server processing time. Figure 1 illustrates the three types of delay tested; the type of delay distinguishes when the delay occurs in the sequence of steps that con- stitute a page load. Figure 1: Injecting Server-Side Delay In Figure 1, time flows from left to right and diago- nal lines represent network communication between the client and server. A user perceives load time as the du- ration from start of navigation until page complete. The page load may include optional activities (in blue), but every search includes an HTTP request for the page HTML, spanning the duration between GET and Last Byte. Server processing commences upon receipt of the HTTP GET. Google search leverages HTTP chunking, which means the page header can be transmitted (and perhaps rendered) even before the results are ready. The different types of delay tested are: pre-header pausing all server processing for X ms immediately upon receipt of the HTTP GET post-header pausing for X ms after transmitting the page header but before any further server processing is done post-ads pausing X ms mid-stream sending the results, after the sponsored links Both the post-header and post-ads delay may be masked by network conditions. That is, a slow or unreliable con- nection may mitigate any delay in server processing from the user’s perspective. All three types of delay may be perceived differently by users due to the degree of partial rendering on the page. All other things being equal, more usage, as measured by number of searches, reflects more satisfied users. Ta- ble 1 gives the average daily searches per user over the experiment duration for the experiment group relative to the control group. Table 1: Experiment Impact on Daily Searches Per User Type of Delay Magnitude Duration Impact Pre-header 50 ms 4 weeks — Pre-header 100 ms 4 weeks −0.20% Post-header 200 ms 6 weeks −0.29% Post-header 400 ms 6 weeks −0.59% Post-ads 200 ms 4 weeks −0.30% Average impact over 4 or 6 weeks hides any trend over time. By focusing on the subset of users who were part of the experiment (or control group) from the beginning (as identified by a browser cookie), one can determine if there is such a trend. Figure 2 illustrates the trend for the two 6 week experiments. Figure 2: Impact of Post-header Delays Over Time dailysearchesperuserrelativetocontrol wk1 wk2 wk3 wk4 wk5 wk6 −1%−0.8%−0.6%−0.4%−0.2%0%0.2% 200 ms delay 400 ms delay actual trend The change over time can be quantified by dividing the 6 week duration in half. The impact on daily searches per user during the second half is −0.36% and −0.74% for the 200 ms and 400 ms delay respectively, compared to −0.22% and −0.44% for the first half. Users do fewer searches the longer they are exposed to delay. Furthermore, observing these users for the 400 ms de- lay after we stop subjecting them to the delay, the rate of daily searches per user for the experiment is still −0.21% relative to the control (averaged over the 5 weeks af- ter removal of the delay). For longer delays, the loss of searches persists for a time even after latency returns to previous levels.