Research Note - Proving the Link
•
1 gefällt mir•239 views

The latest update to this Research Note continues to highlight the link between culture and financial performance. Including scores from as recent as 2010, this update sustains previous findings that stronger, more effective, cultures tend to do better than the comparison group on three financial measures: return on assets, sales growth, and market-to-book ratio. Tracking financial trends over time, the patterns between the higher and lower scoring organizations persist.
![Research Method
To examine the relationship between culture balance sheet and $75 Million in liabilities. The book
and performance, we looked at a sample of value of that organization is $25 Million. (Assets –
public companies surveyed using the Denison Liabilities = Book Value) If there are 10 million shares
Organizational Culture Survey from 1995 to outstanding, each share would represent $2.50
2010. Organizations were removed if there were of book value. If each share sells on the market
fewer than 100 total respondents. Additionally, at $5 (market value), then the MtB would be 2
organizations were removed if they were a (because 5/2.50 = 2). Essentially, market value is the
subdivision of a public company. The result was investment community’s expectations of the worth
a sample of 127 companies in a wide variety of of the company.
industries incorporated primarily in the US (86%).
(Research indicates that the DOCS results are We predicted that the companies with the higher
comparable across countries [Denison Consulting, scores in the DOCS culture traits of Mission,
2012; Denison, Haaland, & Goelzer, 2003].) Consistency, Adaptability and Involvement would
also have better ROA, sales growth, and MtB
ratios than those with lower scores. To test our
Measuring Performance
hypothesis, we linked the organizations in our
Once the sample was obtained, the next step was
database to publicly-available financial performance
to measure performance over time. For this study,
data from Standard & Poor’s COMPUSTAT
three financial metrics were chosen to examine:
database.
return on assets, sales growth and market to book
ratio.
First we took a look at return-on-assets. ROA is Table 1: The Results
the percentage of profits derived from a company’s Performance Measure Bottom 25% Top 25%
total assets, in other words, ROA tells you how Return-on-Assets 1.2% 3.5%
much profit a company generated for each dollar
Sales Growth 7.5% 24.8%
in assets. The higher the percentage of ROA, the
better the organization is at using their invested Market-to-Book Ratio 2.5 4.0
capital, or assets, to turn a profit. For example, if
two companies independently invest $100,000 in
equipment for a project and one company produces
$10,000 in profit and another produces $15,000,
the second company has a greater ROA.
“Culture matters…
Second, we took a look at sales growth which If the organization begins to fail, this
is related to profitability. Sales growth is usually implies that elements of the culture
expressed as the percentage of increased sales have become dysfunctional and
from one year to the next. For example, if we
must change. Failure to understand
surveyed an organization in 2000, year 1 was
calculated by subtracting the sales from 1999 from culture and take it seriously can have
the current sales year (2000). To get the percentage, disastrous consequences for an
we divided the difference by the 1999 sales. organization.”
Finally we looked at market-to-book ratio as another
measure of an organization’s financial performance.
Edgar H. Schein
The Corporate Culture Survival Guide,1999,
The MtB seeks to show the value of a company, p.3
by comparing the book value of a share to the
market value of a share. For example, assume an
organization has $100 Million in assets on the
All content © copyright 2012 Denison Consulting, LLC All rights reserved. l www.denisonconsulting.com l Page 2](data:image/gif;base64,R0lGODlhAQABAIAAAAAAAP///yH5BAEAAAAALAAAAAABAAEAAAIBRAA7)
Empfohlen
Empfohlen
Weitere ähnliche Inhalte
Kürzlich hochgeladen
Kürzlich hochgeladen (20)
Empfohlen
Empfohlen (20)
Research Note - Proving the Link
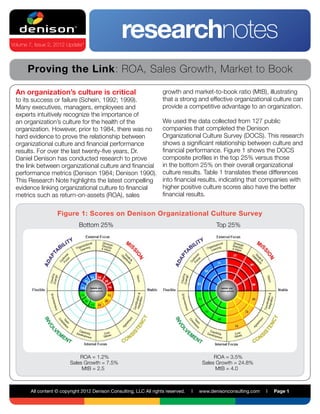
- 1. Volume 7, Issue 2, 2012 Update* researchnotes Proving the Link: ROA, Sales Growth, Market to Book An organization’s culture is critical growth and market-to-book ratio (MtB), illustrating to its success or failure (Schein, 1992; 1999). that a strong and effective organizational culture can Many executives, managers, employees and provide a competitive advantage to an organization. experts intuitively recognize the importance of an organization’s culture for the health of the We used the data collected from 127 public organization. However, prior to 1984, there was no companies that completed the Denison hard evidence to prove the relationship between Organizational Culture Survey (DOCS). This research organizational culture and financial performance shows a significant relationship between culture and results. For over the last twenty-five years, Dr. financial performance. Figure 1 shows the DOCS Daniel Denison has conducted research to prove composite profiles in the top 25% versus those the link between organizational culture and financial in the bottom 25% on their overall organizational performance metrics (Denison 1984; Denison 1990). culture results. Table 1 translates these differences This Research Note highlights the latest compelling into financial results, indicating that companies with evidence linking organizational culture to financial higher positive culture scores also have the better metrics such as return-on-assets (ROA), sales financial results. Figure 1: Scores on Denison Organizational Culture Survey Bottom 25% Top 25% ROA = 1.2% ROA = 3.5% Sales Growth = 7.5% Sales Growth = 24.8% MtB = 2.5 MtB = 4.0 All content © copyright 2012 Denison Consulting, LLC All rights reserved. l www.denisonconsulting.com l Page 1
- 2. Research Method To examine the relationship between culture balance sheet and $75 Million in liabilities. The book and performance, we looked at a sample of value of that organization is $25 Million. (Assets – public companies surveyed using the Denison Liabilities = Book Value) If there are 10 million shares Organizational Culture Survey from 1995 to outstanding, each share would represent $2.50 2010. Organizations were removed if there were of book value. If each share sells on the market fewer than 100 total respondents. Additionally, at $5 (market value), then the MtB would be 2 organizations were removed if they were a (because 5/2.50 = 2). Essentially, market value is the subdivision of a public company. The result was investment community’s expectations of the worth a sample of 127 companies in a wide variety of of the company. industries incorporated primarily in the US (86%). (Research indicates that the DOCS results are We predicted that the companies with the higher comparable across countries [Denison Consulting, scores in the DOCS culture traits of Mission, 2012; Denison, Haaland, & Goelzer, 2003].) Consistency, Adaptability and Involvement would also have better ROA, sales growth, and MtB ratios than those with lower scores. To test our Measuring Performance hypothesis, we linked the organizations in our Once the sample was obtained, the next step was database to publicly-available financial performance to measure performance over time. For this study, data from Standard & Poor’s COMPUSTAT three financial metrics were chosen to examine: database. return on assets, sales growth and market to book ratio. First we took a look at return-on-assets. ROA is Table 1: The Results the percentage of profits derived from a company’s Performance Measure Bottom 25% Top 25% total assets, in other words, ROA tells you how Return-on-Assets 1.2% 3.5% much profit a company generated for each dollar Sales Growth 7.5% 24.8% in assets. The higher the percentage of ROA, the better the organization is at using their invested Market-to-Book Ratio 2.5 4.0 capital, or assets, to turn a profit. For example, if two companies independently invest $100,000 in equipment for a project and one company produces $10,000 in profit and another produces $15,000, the second company has a greater ROA. “Culture matters… Second, we took a look at sales growth which If the organization begins to fail, this is related to profitability. Sales growth is usually implies that elements of the culture expressed as the percentage of increased sales have become dysfunctional and from one year to the next. For example, if we must change. Failure to understand surveyed an organization in 2000, year 1 was calculated by subtracting the sales from 1999 from culture and take it seriously can have the current sales year (2000). To get the percentage, disastrous consequences for an we divided the difference by the 1999 sales. organization.” Finally we looked at market-to-book ratio as another measure of an organization’s financial performance. Edgar H. Schein The Corporate Culture Survival Guide,1999, The MtB seeks to show the value of a company, p.3 by comparing the book value of a share to the market value of a share. For example, assume an organization has $100 Million in assets on the All content © copyright 2012 Denison Consulting, LLC All rights reserved. l www.denisonconsulting.com l Page 2
- 3. The Results Figure 2: Return-on-Assets The results of our analyses show some exciting findings. As you can see in Table 1, in the year of the survey, those organizations with the lowest scoring percentiles for Mission, Consistency, Involvement, and Adaptability earn $1200 for every $100,000 spent on assets, while those in the top 25% earned $3500. This profitability is also related to how fast these companies are growing. The sales growth of the top 25% group was 24.8% versus the bottom scoring companies at 7.5%. Turning to the MtB ratio, the investment/ market community is recognizing the organizations with the higher culture scores at 400% of book value versus Figure 3: Sales Growth 250% for organizations in the bottom 25%. This evidence indicates that the companies with higher culture scores have better performance in the year of the survey. But this study also allowed us to take a look at the longitudinal data and the results indicate that those high scoring organizations also perform better in the future. Figures 2, 3, and 4 illustrate how the bottom and top 25% Figures of organizations rank in their industry (by NAICS code) over a three year period for each of the three performance measures. The graphs indicate that today’s culture Figure 4: Market-to-Book Ratio affects tomorrow’s performance. Figure 2 shows that companies in the top 25% exhibited a slight gain in industry ROA within a three year period, whereas the bottom 25% companies displayed an opposite trend. Figure 3 shows that, as measured by sales growth, both groups displayed a negative trend but the bottom 25% experienced a sharper decline than the top 25% in subsequent years. Figure 4 shows the top 25% remained at a consistent advantage over the bottom 25% in market value. All content © copyright 2012 Denison Consulting, LLC All rights reserved. l www.denisonconsulting.com l Page 3
- 4. Conclusion These results indicate that culture has not only a short-term impact on performance but lasting effects as a competitive edge. Specifically, this research has shown an advantage in ROA, sales growth, and market value for organizations scoring in the top (vs. bottom) 25% on the DOCS. Culture makes a difference in financial performance. As a measurable and controllable aspect of your organization, it is a factor that can improve future business performance. Executives, managers, and employees can focus on their organization’s culture today to improve their financial performance tomorrow. The Denison Model This research uses a culture model developed by Daniel Denison built “This research shows to explain the cultural factors leading to financial performance and us how we can organizational effectiveness (Denison 1990). The model assesses four behavioral traits: Involvement, Consistency, Mission, and Adaptability. measure culture in a These traits are each broken down into three indexes. Ultimately, they way that is useful to can be defined as “a code, a logic, and a system of structured behaviors managers because it and meaning that have stood the test of time and serve as a collective links culture with guide to future adaptation and survival” (Denison 1990, 175). The traits other bottom-line and definition of culture match Schein’s notion of the “shared basic assumption that the group learned as it solved its problems of external performance adaptation and internal integration” (1992, 12). The notion of survival in measures.” the external environment is manifested in the adaptability and mission traits which describe how strategically-oriented and customer-focused Daniel Denison, an organization is. The learned responses to the “problems of internal Denison Consulting integration” are manifested by the traits of involvement and consistency. Related Resources Denison, D. R. (1984). Bringing Corporate Culture to the Bottom Line. Organizational dynamics, 13(2) Denison Consulting. (2012, March). High-perfor- 5-22. mance Organizational Culture around the World. Denison Research Notes. Ann Arbor, MI. Denison, D. R. (1990). Corporate culture and organizational effectiveness. New York: John Wiley Denison Consulting. (2005, April). Overview of the & Sons. Reliability and Validity of the Denison Organizational Culture Survey. White Paper. Ann Arbor, MI. Schein, E. H. (1992). Organizational culture and leadership (2nd ed.). San Francisco: Jossey-Bass. Denison, D. R., Haaland, S. & Goelzer, P. (2003). Is Asia different from the rest of the world?. Schein, E. H. (1999). The Corporate Culture Survival Organizational Dynamics, 33 (1), 98-109. Guide. San Francisco: Jossey-Bass. Contact Information Copyright Information Denison Consulting, LLC Copyright 2012 Denison Consulting, LLC 121 West Washington, Suite 201 All Rights Reserved. Ann Arbor, Michigan 48104 Unauthorized reproduction, in any manner, is prohibited. Phone: (734) 302-4002 The Denison model, circumplex and survey are trade- Fax: (734) 302-4023 marks of Denison Consulting, LLC. Email: research@denisonconsulting.com *This Research Note is an update of “Proving the Link”, originally released as Volume 1, Issue 2, 2006 All content © copyright 2012 Denison Consulting, LLC All rights reserved. l www.denisonconsulting.com l Page 4