
Empfohlen
Weitere ähnliche Inhalte
Ähnlich wie Other presentations using cbms results canaman camarines sur - slgr+cbms 2009
Ähnlich wie Other presentations using cbms results canaman camarines sur - slgr+cbms 2009 (20)
Kürzlich hochgeladen
Kürzlich hochgeladen (20)
Other presentations using cbms results canaman camarines sur - slgr+cbms 2009
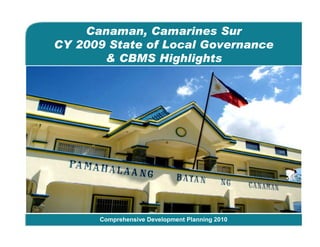
- 1. Canaman, Camarines Sur CY 2009 State of Local Governance & CBMS Highlights Bago City, Negros Occidental Comprehensive Development Planning 2010
- 2. An Canaman Aggregate Area: 4,327.2901 hectares Municipality of Magarao 9 urban barangays Municipality of 15 rural barangays Libmanan Naga City Municipality of Municipality of Camaligan Pamplona Municipality of Gainza Population: 29,933; Households: 6,533 * 96.10% or 4,158.53 hectares is relatively flat (0-3% slope)
- 3. Outline • State of Local Governance Performance – the obtaining capacity level of the LGU and the circumstances that bear upon it • Financial Performance – information on LGU’s revenue generation, revenue allocation & utilization • State of Local Development – the obtaining development conditions and the factors/circumstances that have influenced such Presented in graphs, percentages or figures based on pre-defined indicators & performance scale
- 4. State of Performance: ADMINISTRATIVE GOVERNANCE Very High High Fair Low Very Low • 7th among the 13 fourth class municipalities & 22nd among the 36 component LGUs of the province STATE OF PERFORMANCE : Administrative Governance
- 5. State of Performance ADMINISTRATIVE GOVERNANCE – Priority Areas of Concern • On Local Legislation: 1) Enactment of vital codes (e.g. Code for Children, Code of General Ordinances, Environmental Code, etc.); 2) Enhancement of Legislative Tracking System (e.g. computerization); and 3) Review/updating of ordinances • Revenue Generation: 1) Formulation of Annual Revenue Generation Plan; 2) Improvement of system on LGU-imposed or collected taxes, fees & charges; 3) Improvement of RPT collection system; 4) Enhancement of Local Revenue base • On Development Planning: 1) Strengthening of the Municipal Dev’t Council; 2) Enhancement of database; 3) Formulation/Updating of plans • On Resource Allocation & Utilization: Strict adherence to regulations/ mandatory requirements (i.e. 20% EDF utilization, PS ceiling, GAD & Local Council for the Protection of Children allocation, etc.) What are the Priority Areas of Concern?
- 6. State of Performance ADMINISTRATIVE GOVERNANCE – Priority Areas of Concern • On Human Resource Management and Development: Enhance- ment/institutionalization of HRMD practices: Transparency in recruitment and selection, stability in employment, recognition of good performance, promotion of professional growth, and ease of being heard through a personnel grievance system • On Customer Service – Civil Applications: 1) Enhancement of the civil application system ( i.e. transform into a seamless transactional process); 2) Enhancement/strengthening of the Public Assistance Desk; 3) Enhancement/installation of computerized database system (real property, civil registry, etc.) • Over-arching concern: Is our present organizational structure and staffing pattern – which is a vital component of governance, at par/ready/responsive to the needs? What are the Priority Areas of Concern?
- 7. State of Performance: SOCIAL GOVERNANCE Very High High Fair Low Very Low • 2nd among the 13 fourth class municipalities & 10th among the 36 component LGUs of the province STATE OF PERFORMANCE : Social Governance
- 8. State of Performance SOCIAL GOVERNANCE – Priority Areas of Concern • On Support to Health Services: 1) Strengthening of the Local Health Board; 2) Enhancement of primary health care (basic curative) service • On Support to Education Services: 1) Strengthening of Local School Board; 2) Strict adherence to SEF utilization & expense prioritization; 3) Strengthen support to basic education (e.g. scholarship program, extension classes, etc.) and alternative learning system • On Support to Housing & Basic Utilities: 1) Updating of inventory of sites for potential socialized housing; 2) Validation of database (e.g. informal settlers, households with access to water/electricity supply, etc) • On Peace, Security & Disaster Risk Mgt: 1) Strengthen Peace & Order Council, Council for the Protection of Children & Disaster Coordinating Council; 2) Ensure annual allocation to the Katarungang Pambarangay; 3) Enhance LGU readiness to manage disaster risks What are the Priority Areas of Concern?
- 9. State of Performance: ECONOMIC GOVERNANCE Very High High Fair Low Very Low • 7th among the 13 fourth class municipalities & 15th among the 36 component LGUs of the province STATE OF PERFORMANCE : Economic Governance
- 10. State of Performance: ECONOMIC GOVERNANCE: Priority Areas of Concern • On Support to Agriculture Sector: 1) Improvement of infrastructure support (e.g. communal irrigation system, farm-to-market roads/bridges, postharvest facilities); 2) Improve credit facilitation services to farmers; 3) Improve market development services (e.g. trade fairs, exhibits, missions & congress); 4) Enhance assistance to research & development • On Entrepreneurship, Business & Industry Promotion: 1) Improve the quality of permitting/licensing system; 2) Ensure the ease of doing business (i.e. in getting permits); 3) Establish an administrative support body to take the lead in marketing the investment potentials of the local government; 4) Provide/cause the provision of, direct support services to business, particularly those categorized as micro, small and medium enterprises (e.g. tax incentives, product labeling, product packaging, training, job fairs and trade fairs) What are the priority areas of concern?
- 11. State of Performance: ENVIRONMENTAL GOVERNANCE Very High High Fair Low Very Low • 7th among the 13 fourth class municipalities & 14th among the 36 component LGUs of the province STATE OF PERFORMANCE : Environmental Governance
- 12. State of Performance: ENVIRONMENTAL GOVERNANCE: Priority Areas of Concern • On Freshwater Ecosystem Management: 1) Strengthen partnership with Civil Society Organizations and citizen participation in freshwater ecosystem management; 2) Review/update target areas for rehabilitation and protection • On Urban Ecosystem Management: 1) Strengthen the Solid Waste Management Board; 2) Improve/update the Solid Waste Management Plan; 3) Ensure that every barangay has a Materials Recovery Facility; 4) Improve Solid Waste Collection Practices; 5) Ensure that no open dumpsite facility exist STATE OF PERFORMANCE : Environmental Governance
- 13. State of Performance: VALUING FUNDAMENTALS OF GOOD GOVERNANCE Very High High Fair Low Very Low • 10th among the 13 fourth class municipalities & 31st among the 36 component LGUs of the province STATE OF PERFORMANCE : Fundamentals of Good Governance
- 14. State of Performance: VALUING FUNDAMENTALS OF GOOD GOVERNANCE • On Participation: Engage the citizens and civil society organizations in governance much more effectively • On Transparency: 1) Maximize communication channels (e.g. Bulletin board, Public Information Desk, print & broadcast media, etc.) in communication information such as plans, programs, services, etc.; 2) Enhance/update the website • On Financial Accountability: Strengthen administrative capacity to ensure observance of guidelines relative to accounting & internal control, procurement & financial transactions STATE OF PERFORMANCE : Fundamentals of Good Governance
- 15. Financial Performance: REVENUE GENERATION Cost in collecting revenue/total local revenues collected
- 16. Financial Performance: REVENUE GENERATION Amount of locally-sourced revenue Amount of locally-sourced revenue / population
- 17. Financial Performance: REVENUE GENERATION Amount of RPT collected / amount of projected RPT
- 18. Financial Performance: RESOURCE ALLOCATION & UTILIZATION Actual debt service cost/regular income Should not exceed 20% of the regular income (the debt servicing limitation set for under LG Code of 1991)
- 19. Financial Performance: RESOURCE ALLOCATION & UTILIZATION Total expenditures/population Describes how much was actually spent by the LGU in a per capita basis.
- 20. Financial Performance: FINANCIAL PERFORMANCE - Priority Areas of Concern • On Revenue Generation: 1) Increase locally-sourced income; 2) Increase cost-collection efficiency • On Resource Allocation & Utilization: 1) Sustain compliance with statutory requirements, especially on budget ceilings; 2) Carefully explore possibilities to take advantage of the relatively large percentage of debt servicing capacity What are the Priority Areas of Concern?
- 21. State of Local Development SOCIAL DEVELOPMENT Very High High Fair Low Very Low
- 22. State of Local Development SOCIAL DEVELOPMENT – Health & Nutrition Malnutrition Rate (0-5 years old): below 10% (CBMS Data: 2.3%) Morbidity Rate for leading illnesses: within acceptable condition per national standards Crude Death Rate: 1 per 1,000 population Maternal Mortality Rate: 0.3% or below per 1,000 live births (CBMS Data: 0.3%) Infant Mortality Rate: 6-14 per 1,000 live births Children Mortality Rate: 11-29 per 1,000 live births (CBMS Data: 0.7%) Malnutrition Rate, Morbidity Rate, Crude Death Rate, Maternal Mortality Rate & Infant/Children Mortality Rate are all within the acceptable standards of the DOH. Sustain the efforts and aim for ideal and desirable condition. State of Health & Nutrition – Priority Areas of Concern
- 23. State of Local Development SOCIAL DEVELOPMENT – Education Elementary Participation Rate: 85-91% (CBMS Data: 84%) Elementary Completion Rate: 78-88% Secondary Participation Rate: 65% CBMS Data Secondary Completion Rate: 60-70% Tertiary or Technical Education Completion Rate: 25-50% Simple Literacy Rate: 95-97% (CBMS Data: 97.81%) Exert more effort to improve the situation. Quality of human capital is at risk! State of Education – Priority Areas of Concern
- 24. State of Local Development SOCIAL DEVELOPMENT – Housing & Basic Utilities % of squatters: 5% or below (CBMS Data: 4%) % of HHs living in makeshift housing: >2% (CBMS Data: 7.6%) % of HHs w/ access to piped-in water: <30% (CBMS Data: 68%) % of HHs w/ sanitary toilet: 86-91% (CBMS Data: 91.9%) % of HHs w/ electricity: 80-90% (CBMS Data: 85%) Exert more effort to improve the situation. Quality of life is at stake! State of Housing & Basic Utilities – Priority Areas of Concern
- 25. State of Local Development SOCIAL DEVELOPMENT – Peace & Order Incidence of Index Crime (i.e. murder, homicide, physical injury, rape, robbery & theft): more than 8 per 10,000 population (benchmark is 5-6 per 10,000) Incidence of non-index Crime (e.g. crimes against public order, public morals, illegal gambling, illegal drugs, violation of special laws, carnapping, etc.): more than 6 per 10,000 population (benchmark is 3-4 per 10,000 population) Exert more effort to improve the situation. Quality of life is at stake! State of Peace & Order – Priority Areas of Concern
- 26. State of Local Development ECONOMIC DEVELOPMENT Very High High Fair Low Very Low
- 27. State of Local Development ECONOMIC DEVELOPMENT – State of Employment & Income Unemployment Rate: 0-2% (CBMS Data: 1.6%) Underemployment Rate: 16-20% (benchmark: should not be higher than 20%) Income per Capita: 20,000 – 34,000 (benchmark: should not be lower than P35,000) Poverty Incidence: 36-50% (benchmark: 26-35%; CBMS Data: 48.7%) HHs living below food threshold: 34.2% CBMS Data Exert more effort to improve the situation. Quality of life is at stake! State of Employment & Income – Priority Areas of Concern
- 28. State of Local Development ENVIRONMENTAL DEVELOPMENT Very High High Fair Low Very Low
- 29. State of Local Development ENVIRONMENTAL DEVELOPMENT – Urban Ecosystems % of tree cover in Urban Areas (town center): 10-20% (benchmark: at least 20%) % of polluting industries: 0% Smog, odor & noise in town center: NONE Solid waste heaps on roadsides & vacant/idle lots & in urban lands: Present in some spots & sites (benchmark: this should not occur) Exert more effort to improve the situation. Quality of life is at stake! State of Urban Ecosystems – Priority Areas of Concern
- 30. State of Local Development ENVIRONMENTAL DEVELOPMENT – Agricultural Ecosystems % of irrigated lands to total irrigable lands: 40- 50% (benchmark: 40-50%) % prime lands converted to non-agricultural uses: <5% (benchmark: should not be more than 5%) Exert more effort to improve the situation. Food sufficiency is at stake! State of Agricultural Ecosystems – Priority Areas of Concern
- 31. State of Local Development ENVIRONMENTAL DEVELOPMENT – Freshwater Ecosystems Fish catch in river or lake: decreasing over the past 5 years (benchmark: should be stable or increasing) Freshwater quality: Water is turbid (light brown to brown color) with floating wastes (benchmark: should be clear, without water lilies and/or floating wastes) Extent of Riverside Squatters: 6-20 houses per kilometer (benchmark: should not be more than 20) Exert more effort to improve the situation. Quality of life is at stake! State of Freshwater Ecosystems – Priority Areas of Concern
- 32. Dios Mabalos Po! (Tenkyu!) Tenkyu!)