Procuring digital preservation CAN be quick and painless with our new dynamic...
quantization_PCM
1. K. L. Poland, Revision F T1 - Basic Transmission Theory
7.0 Quantization and Pulse Code Modulation
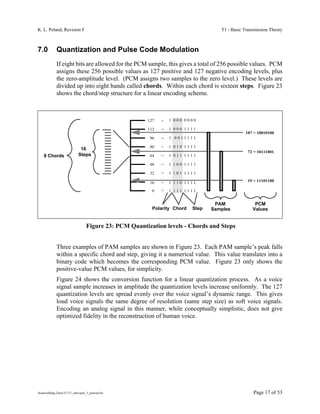
If eight bits are allowed for the PCM sample, this gives a total of 256 possible values. PCM
assigns these 256 possible values as 127 positive and 127 negative encoding levels, plus
the zero-amplitude level. (PCM assigns two samples to the zero level.) These levels are
divided up into eight bands called chords. Within each chord is sixteen steps. Figure 23
shows the chord/step structure for a linear encoding scheme.
127 = 1 000 0000
112 = 1 000 1111
107 = 10010100
96 = 1 0011111
80 = 1 010 1111
16
72 = 10111001
8 Chords Steps 64 = 1 011 1111
48 = 1 100 1111
32 = 1 101 1111
16 = 1 110 1111 19 = 11101100
0 = 1 111 1111
PAM PCM
Polarity Chord Step Samples Values
Figure 23: PCM Quantization levels - Chords and Steps
Three examples of PAM samples are shown in Figure 23. Each PAM sample’s peak falls
within a specific chord and step, giving it a numerical value. This value translates into a
binary code which becomes the corresponding PCM value. Figure 23 only shows the
positive-value PCM values, for simplicity.
Figure 24 shows the conversion function for a linear quantization process. As a voice
signal sample increases in amplitude the quantization levels increase uniformly. The 127
quantization levels are spread evenly over the voice signal’s dynamic range. This gives
loud voice signals the same degree of resolution (same step size) as soft voice signals.
Encoding an analog signal in this manner, while conceptually simplistic, does not give
optimized fidelity in the reconstruction of human voice.
/home/tellabg-2/ken/T1/T1_intro/part_3_portrait.fm Page 17 of 53
2. T1 - Basic Transmission Theory K. L. Poland, Revision F
Voice signal
amplitude
Quantization value
Figure 24: Linear Quantization, Signal Amplitude versus Quantization Value
Notice this transfer function gives two values for a zero-amplitude signal. In PCM, there
is a “positive zero” and a “negative zero”.
7.1 Companding
Dividing the amplitude of the voice signal up into equal positive and negative steps is not
an efficient way to encode voice into PCM. Figure 23 shows PCM chords and steps as
uniform increments (such as would be created by the transfer function depicted in Figure
24). This does not take advantage of a natural property of human voice: voices create low-
amplitude signals most of the time (people seldom shout on the telephone). That is, most
of the energy in human voice is concentrated in the lower end of voice’s dynamic range.
To create the highest-fidelity voice reproduction from PCM, the quantization process must
take into account this fact that most voice signals are typically of lower amplitude. To do
this the vocoder adjusts the chords and steps so that most of them are in the low-amplitude
Page 18 of 53 /home/tellabg-2/ken/T1/T1_intro/part_3_portrait.fm
3. K. L. Poland, Revision F T1 - Basic Transmission Theory
end of the total encoding range. In this scheme, all step sizes are not equal. Step sizes are
smaller for lower-amplitude signals.
Quantization levels distributed according to a logarithmic, instead of linear, function gives
finer resolution, or smaller quantization steps, at lower signal amplitudes. Therefore,
higher-fidelity reproduction of voice is achieved. Figure 25 shows a conversion function
for a logarithmic quantization process.
A vocoder that places most of the quantization steps at lower amplitudes by using a non-
linear function, such as a logarithm, is said to compress voice upon encoding, then expand
the PCM samples to re-create an analog voice signal. Such a vocoder is hence called a
compander (from compress and expand).
Voice signal
amplitude
Quantization value
Figure 25: Logarithmic Quantization, Signal Amplitude versus Quantization Value
In reality, voice quantization does not exactly follow the logarithmic curve step for step, as
Figure 25 appears to indicate. PCM in North America uses a logarithmic function called
µ-law. The encoding function only approximates a logarithmic curve, as steps within a
chord are all the same size, and therefore linear. The steps change in size only from chord
/home/tellabg-2/ken/T1/T1_intro/part_3_portrait.fm Page 19 of 53
4. T1 - Basic Transmission Theory K. L. Poland, Revision F
to chord. The chords form linear segments that approximate the µ-law logarithmic curve.
The chords form a piece-wise linear approximation of the logarithmic curve.
7.2 Quantization Error
Figure 26 shows three PAM samples that have their amplitudes measured and given PCM
values. If a PAM sample’s level lies between two steps, it is assigned the value of the
highest step it crosses. A PAM sample that just reaches this step would be given the same
quantization value. Therefore, all PAM samples are treated as if they fall exactly on a step
level.
PAM samples with amplitudes that are not close to each other (e.g., B & C in Figure 26)
can be given the same quantization value. Even though the PAM samples represent
different amplitudes of the original signal, they receive the same PCM value. This causes
an impreciseness in the voice encoding process called quantization error.
Figure 26 shows how the quantization process can alter a voice signal. Samples A and B
are closest in amplitude, with C being much lower. However, due to how the samples fall
into the quantization levels, the sample steps created from the PCM words have B and C at
the same amplitude. Obviously, the reconstructed waveform will be different from the
original waveform.
Sample A
Sample B
Sample C
one step
Quantization level steps Encode: PAM to PCM Decode: PCM to Step
Figure 26: Quantization Error: Recovered Step levels do not match PAM levels
7.2.1 Fidelity: Maintaining a high Signal-to-Noise ratio
Quantization error is another reason for using compressed encoding for digitizing a voice
signal. Compressed encoding allows a higher signal-to-quantization-noise ratio (SNQR)
than linear encoding. This ratio defined as
S
SN Q R = 20log 〈 -------〉
NQ
Page 20 of 53 /home/tellabg-2/ken/T1/T1_intro/part_3_portrait.fm
5. K. L. Poland, Revision F T1 - Basic Transmission Theory
where S is the voice signal level and NQ is noise due to the quantization error. Clearly,
keeping the quantization error small is key to keeping a high SNQR. As signal amplitude
gets smaller, NQ must get smaller to keep SNQR from dropping. Compression
accomplishes this by forcing quantization error magnitude to decrease with lower
amplitudes.
Step
Higher amplitude
Waveform to quantize
Chord
Magnification of small signal
Lower amplitude
PAM sample
Figure 27: Linear Quantization, another View
Without increasing the overall number of quantization samples, it is desirable to increase
the SNQR for small-amplitude signals. This is what logarithmic quantization
accomplishes.
Figure 27 gives another view (as opposed to Figure 24) of the scale for a linear quantizer.
The quantization levels are shown to the left for the positive range of a voice waveform.
This is only the positive half of the quantization scale. There is a mirror image scale for
/home/tellabg-2/ken/T1/T1_intro/part_3_portrait.fm Page 21 of 53
6. T1 - Basic Transmission Theory K. L. Poland, Revision F
the negative half of the voice signal (not shown here for simplicity). The magnification of
a small-amplitude portion of the voice signal shows the relative coarseness of the sampling
function. Few sample levels for a small signal corresponds to a low-fidelity (low SNQR)
encoding technique.
Step
Higher amplitude
Waveform to quantize
Chord
Magnification of small signal
Lower amplitude
PAM sample
Figure 28: Logarithmic Quantization, another View
Figure 28 gives another view (as opposed to Figure 25) of a logarithmic quantizer process.
The magnification of a low-amplitude region of the signal shows how sampling levels are
close together, compared to the same low-amplitude signal quantized by linear encoding
(see Figure 27). Smaller quantizing steps for low-amplitude signals allows a better signal-
to-noise ratio, which amounts to better fidelity, when sampling voice signals.
Page 22 of 53 /home/tellabg-2/ken/T1/T1_intro/part_3_portrait.fm