Understanding Motivators and Evaluating SNAP/EBT Incentive Outcomes in Farmer...
2010 SNAP at FMs Fact Sheet
1. Supplemental Nutrition Assistance Program Fact Sheet
Farmers’ Market
Edition: FY 2010
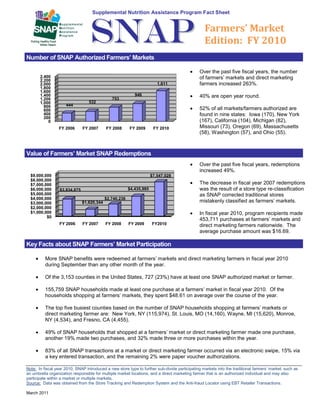
Number of SNAP Authorized Farmers’ Markets
Over the past five fiscal years, the number
2,400
2,200
of farmers’ markets and direct marketing
2,000 1,611 farmers increased 263%.
1,800
1,600
1,400 946 40% are open year round.
1,200 753
1,000 532
800 444
600 52% of all markets/farmers authorized are
400 found in nine states: Iowa (170), New York
200
0 (167), California (104), Michigan (82),
FY 2006 FY 2007 FY 2008 FY 2009 FY 2010 Missouri (73), Oregon (69), Massachusetts
(58), Washington (57), and Ohio (55).
Value of Farmers’ Market SNAP Redemptions
Over the past five fiscal years, redemptions
increased 49%.
$9,000,000 $7,547,028
$8,000,000
$7,000,000 The decrease in fiscal year 2007 redemptions
$6,000,000 $3,834,875 $4,435,985 was the result of a store type re-classification
$5,000,000 as SNAP corrected traditional stores
$4,000,000 $2,740,236
$3,000,000 $1,620,344 mistakenly classified as farmers’ markets.
$2,000,000
$1,000,000 In fiscal year 2010, program recipients made
$0
453,711 purchases at farmers’ markets and
FY 2006 FY 2007 FY 2008 FY 2009 FY2010 direct marketing farmers nationwide. The
average purchase amount was $16.69.
Key Facts about SNAP Farmers’ Market Participation
More SNAP benefits were redeemed at farmers’ markets and direct marketing farmers in fiscal year 2010
during September than any other month of the year.
Of the 3,153 counties in the United States, 727 (23%) have at least one SNAP authorized market or farmer.
155,759 SNAP households made at least one purchase at a farmers’ market in fiscal year 2010. Of the
households shopping at farmers’ markets, they spent $48.61 on average over the course of the year.
The top five busiest counties based on the number of SNAP households shopping at farmers’ markets or
direct marketing farmer are: New York, NY (115,974), St. Louis, MO (14,160), Wayne, MI (15,620), Monroe,
NY (4,534), and Fresno, CA (4,455).
49% of SNAP households that shopped at a farmers’ market or direct marketing farmer made one purchase,
another 19% made two purchases, and 32% made three or more purchases within the year.
83% of all SNAP transactions at a market or direct marketing farmer occurred via an electronic swipe, 15% via
a key entered transaction, and the remaining 2% were paper voucher authorizations.
Note: In fiscal year 2010, SNAP introduced a new store type to further sub-divide participating markets into the traditional farmers’ market, such as
an umbrella organization responsible for multiple market locations, and a direct marketing farmer that is an authorized individual and may also
participate within a market or multiple markets.
Source: Data was obtained from the Store Tracking and Redemption System and the Anti-fraud Locator using EBT Retailer Transactions.
March 2011