Design of experiments

An introduction to SigmaXL's Design of Experiments tools. Established in 1998, SigmaXL Inc. is a leading provider of user friendly Excel Add-ins for Lean Six Sigma graphical and statistical tools and Monte Carlo simulation. SigmaXL® customers include market leaders like Agilent, Diebold, FedEx, Microsoft, Motorola and Shell. SigmaXL® software is also used by numerous colleges, universities and government agencies. Our flagship product, SigmaXL®, was designed from the ground up to be a cost-effective, powerful, but easy to use tool that enables users to measure, analyze, improve and control their service, transactional, and manufacturing processes. As an add-in to the already familiar Microsoft Excel, SigmaXL® is ideal for Lean Six Sigma training and application, or use in a college statistics course. DiscoverSim™ enables you to quantify your risk through Monte Carlo simulation and minimize your risk with global optimization. Business decisions are often based on assumptions with a single point value estimate or an average, resulting in unexpected outcomes. DiscoverSim™ allows you to model the uncertainty in your inputs so that you know what to expect in your outputs.

Empfohlen
Weitere ähnliche Inhalte
Was ist angesagt?
Was ist angesagt? (20)
Ähnlich wie Design of experiments
Ähnlich wie Design of experiments (20)
Mehr von Cynthia Cumby
Mehr von Cynthia Cumby (6)
Kürzlich hochgeladen
Kürzlich hochgeladen (20)
Design of experiments
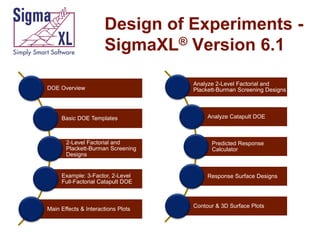
- 1. Design of Experiments SigmaXL® Version 6.1 DOE Overview Basic DOE Templates 2-Level Factorial and Plackett-Burman Screening Designs Example: 3-Factor, 2-Level Full-Factorial Catapult DOE Main Effects & Interactions Plots Analyze 2-Level Factorial and Plackett-Burman Screening Designs Analyze Catapult DOE Predicted Response Calculator Response Surface Designs Contour & 3D Surface Plots
- 2. Design of Experiments Basic DOE Templates Automatic update to Pareto of Coefficients Easy to use, ideal for training Generate 2-Level Factorial and PlackettBurman Screening Designs Main Effects & Interaction Plots Analyze 2-Level Factorial and PlackettBurman Screening Designs Back to Index
- 3. Basic DOE Templates Back to Index
- 4. Design of Experiments: Generate 2-Level Factorial and Plackett-Burman Screening Designs User-friendly dialog box 2 to 19 Factors 4,8,12,16,20 Runs Unique “view power analysis as you design” Randomization, Replication, Blocking and Center Points Back to Index
- 5. Design of Experiments: Generate 2-Level Factorial and Plackett-Burman Screening Designs View Power Information as you design! Back to Index
- 6. Design of Experiments Example: 3-Factor, 2-Level Full-Factorial Catapult DOE Objective: Hit a target at exactly 100 inches! Back to Index
- 7. Design of Experiments: Main Effects and Interaction Plots Back to Index
- 8. Design of Experiments: Analyze 2-Level Factorial and Plackett-Burman Screening Designs Used in conjunction with Recall Last Dialog, it is very easy to iteratively remove terms from the model Interactive Predicted Response Calculator with 95% Confidence Interval and 95% Prediction Interval. ANOVA report for Blocks, Pure Error, Lack-offit and Curvature Collinearity Variance Inflation Factor (VIF) and Tolerance report Back to Index
- 9. Design of Experiments: Analyze 2-Level Factorial and Plackett-Burman Screening Designs Residual plots: histogram, normal probability plot, residuals vs. time, residuals vs. predicted and residuals vs. X factors Residual types include Regular, Standardized, Studentized (Deleted t) and Cook's Distance (Influence), Leverage and DFITS Highlight of significant outliers in residuals Durbin-Watson Test for Autocorrelation in Residuals with p-value Back to Index
- 10. Design of Experiments Example: Analyze Catapult DOE Pareto Chart of Coefficients for Distance 25 Abs(Coefficient) 20 15 10 5 B: BC AB AC AB C St op Pi n gh t He i C: Pi n A: Pu ll B ac k 0 Back to Index
- 11. Design of Experiments: Predicted Response Calculator Excel’s Solver is used with the Predicted Response Calculator to determine optimal X factor settings to hit a target distance of 100 inches. 95% Confidence Interval and Prediction Interval Back to Index
- 12. Design of Experiments: Response Surface Designs 2 to 5 Factors Central Composite and Box-Behnken Designs Easy to use design selection sorted by number of runs: Back to Index
- 13. Design of Experiments: Contour & 3D Surface Plots Back to Index