Wisconsin State Bridge Profile
•
0 gefällt mir•410 views

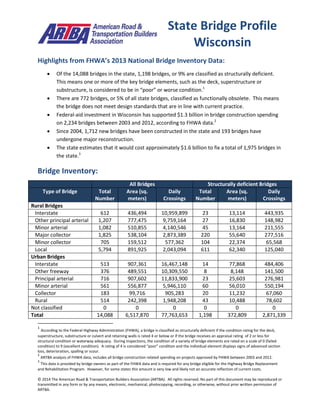
This document summarizes bridge data from Wisconsin's 2013 National Bridge Inventory. Some key points: - 9% of the state's 14,088 bridges, or 1,198 bridges, are structurally deficient. - 5% of bridges, or 772 bridges, are functionally obsolete. - $1.3 billion in federal funding supported bridge construction on 2,234 bridges from 2003 to 2012. - It is estimated that it would cost $1.6 billion to repair 1,975 bridges in need of work.

Empfohlen
Weitere ähnliche Inhalte
Was ist angesagt?
Was ist angesagt? (20)
Andere mochten auch
Andere mochten auch (20)
Ähnlich wie Wisconsin State Bridge Profile
Ähnlich wie Wisconsin State Bridge Profile (13)
Mehr von artba
Mehr von artba (20)
Kürzlich hochgeladen
Kürzlich hochgeladen (20)
Wisconsin State Bridge Profile
- 1. © 2014 The American Road & Transportation Builders Association (ARTBA). All rights reserved. No part of this document may be reproduced or transmitted in any form or by any means, electronic, mechanical, photocopying, recording, or otherwise, without prior written permission of ARTBA. Highlights from FHWA’s 2013 National Bridge Inventory Data: Of the 14,088 bridges in the state, 1,198 bridges, or 9% are classified as structurally deficient. This means one or more of the key bridge elements, such as the deck, superstructure or substructure, is considered to be in “poor” or worse condition.1 There are 772 bridges, or 5% of all state bridges, classified as functionally obsolete. This means the bridge does not meet design standards that are in line with current practice. Federal-aid investment in Wisconsin has supported $1.3 billion in bridge construction spending on 2,234 bridges between 2003 and 2012, according to FHWA data.2 Since 2004, 1,712 new bridges have been constructed in the state and 193 bridges have undergone major reconstruction. The state estimates that it would cost approximately $1.6 billion to fix a total of 1,975 bridges in the state.3 Bridge Inventory: All Bridges Structurally deficient Bridges Type of Bridge Total Number Area (sq. meters) Daily Crossings Total Number Area (sq. meters) Daily Crossings Rural Bridges Interstate 612 436,494 10,959,899 23 13,114 443,935 Other principal arterial 1,207 777,475 9,759,164 27 16,830 148,982 Minor arterial 1,082 510,855 4,140,546 45 13,164 211,555 Major collector 1,825 538,104 2,873,389 220 55,640 277,516 Minor collector 705 159,512 577,362 104 22,374 65,568 Local 5,794 891,925 2,043,094 611 62,340 125,040 Urban Bridges Interstate 513 907,361 16,467,148 14 77,868 484,406 Other freeway 376 489,551 10,309,550 8 8,148 141,500 Principal arterial 716 907,602 11,833,900 23 25,603 276,981 Minor arterial 561 556,877 5,946,110 60 56,010 550,194 Collector 183 99,716 905,283 20 11,232 67,060 Local 514 242,398 1,948,208 43 10,488 78,602 Not classified 0 0 0 0 0 0 Total 14,088 6,517,870 77,763,653 1,198 372,809 2,871,339 1 According to the Federal Highway Administration (FHWA), a bridge is classified as structurally deficient if the condition rating for the deck, superstructure, substructure or culvert and retaining walls is rated 4 or below or if the bridge receives an appraisal rating of 2 or less for structural condition or waterway adequacy. During inspections, the condition of a variety of bridge elements are rated on a scale of 0 (failed condition) to 9 (excellent condition). A rating of 4 is considered “poor” condition and the individual element displays signs of advanced section loss, deterioration, spalling or scour. 2 ARTBA analysis of FHWA data, includes all bridge construction related spending on projects approved by FHWA between 2003 and 2012. 3 This data is provided by bridge owners as part of the FHWA data and is required for any bridge eligible for the Highway Bridge Replacement and Rehabilitation Program. However, for some states this amount is very low and likely not an accurate reflection of current costs. State Bridge Profile Wisconsin
- 2. © 2014 The American Road & Transportation Builders Association (ARTBA). All rights reserved. No part of this document may be reproduced or transmitted in any form or by any means, electronic, mechanical, photocopying, recording, or otherwise, without prior written permission of ARTBA. Proposed bridge work: Type of Work Number Cost (millions) Daily Crossings Area (sq. meters) Bridge replacement 1,953 $1,563.8 12,048,437 1,044,508 Widening & rehabilitation 0 $0.0 0 0 Rehabilitation 0 $0.0 0 0 Deck rehabilitation/replacement 15 $0.3 13,830 2,989 Other work 7 $0.1 1,382 666 Top 10 Most Traveled Structurally Deficient Bridges in the State County Year Built Daily Crossings Type of Bridge Location (route/water under the bridge, traffic on the bridge and location) Milwaukee 1962 106,700 Urban Interstate CMSTPP RR, IH 43-N-S FREEWAY, X 0.4M N JCT STH 190 TO E Washington 1952 71,200 Urban freeway/expressway MENOMONEE RIVER, USH 41-USH 45, 3.3M N JCT STH 100 TO N St. Croix 1972 61,790 Urban Interstate STH 35 SB, IH 94-USH 12-STH 3, 0.6M E MINN STATE LINE Douglas 1961 41,293 Urban Interstate LRD GARFIELD AVE, IH 535-USH 53, 0.9M N JCT USH 53 Douglas 1961 41,293 Urban Interstate ST LOUIS BAY, IH 535-USH 53, 0.7M N JCT USH 53 Douglas 1961 41,293 Urban Interstate SOO LINE, IH 535-USH 53, 0.5M N JCT USH 53 Douglas 1961 41,293 Urban Interstate USH 53 SB-STH 35, IH 535-USH 53, 0.1M N JCT USH 53 Douglas 1961 41,293 Urban Interstate HOWARDS POCKET, IH 535-USH 53, 0.4M N JCT USH 53 Milwaukee 1958 36,800 Urban other principal arterial BR MENOMONEE RIVER, STH 190-CAPITOL DR, 0.2M E JCT STH 100 Racine 1959 33,680 Rural Interstate STH 20, IH 94 EB-USH 41 SB, 6.0M E JCT CTH G TO E Sources: All data is from the 2013 National Bridge Inventory, released by the Federal Highway Administration in March 2014. Note that specific conditions on bridge may have changed as a result of recent work. Cost estimates of bridge work provided as part of the data and have been adjusted to 2013$ for inflation and estimated project costs. Contract awards data is for state and local government awards and comes from McGraw Hill. Note that additional bridge investment may be a part of other contract awards if a smaller bridge project is included with a highway project, and that would not be accounted for in the total in this profile.