EnrichNet: Graph-based statistic and web-application for gene/protein set enrichment analysis
•
3 gefällt mir•1,182 views

EnrichNet is a web-application and web-service to identify and visualize functional associations between a user-defined list of genes/proteins and known cellular pathways. As a complement to classical overlap-based enrichment analysis methods, the EnrichNet approach integrates a novel graph-based statistic with a new interactive visualization of network sub-structures to enable a direct molecular interpretation of how a set of genes or proteins is related to a specific cellular pathway. Available at: http://www.enrichnet.org

Empfohlen
Weitere ähnliche Inhalte
Was ist angesagt?
Was ist angesagt? (20)
Andere mochten auch
Andere mochten auch (20)
Ähnlich wie EnrichNet: Graph-based statistic and web-application for gene/protein set enrichment analysis
Ähnlich wie EnrichNet: Graph-based statistic and web-application for gene/protein set enrichment analysis (20)
Kürzlich hochgeladen
Kürzlich hochgeladen (20)
EnrichNet: Graph-based statistic and web-application for gene/protein set enrichment analysis
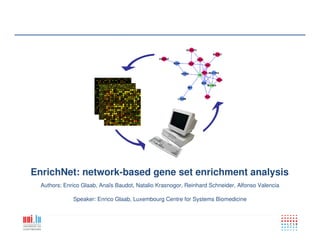
- 1. Speaker: Enrico Glaab, Luxembourg Centre for Systems Biomedicine EnrichNet: network-based gene set enrichment analysis Authors: Enrico Glaab, Anaïs Baudot, Natalio Krasnogor, Reinhard Schneider, Alfonso Valencia
- 2. 1 Motivation How to identify and score functional associations between a gene/protein set of interest (target set) and a collection of known, annotated gene/protein sets (reference sets), representing cellular pathways, processes or complexes? Problem: Functional annotation/pathway databases (reference sets) Experimentally-derived gene/protein set (target set)
- 3. 2 Previous approaches Previous gene/protein set enrichment analyses techniques: Three types of enrichment analysis approaches (see Huang et al., Nucleic Acid Res, 2009): • Over-representation analysis (ORA) • Gene Set Enrichment Analysis (GSEA) • Integrative and modular enrichment analysis (MEA) generally applicable, but scores often not discriminative, rankings difficult to interpret biologically quantitative measurements required, molecular network neighbourhood not taken into account mostly use clustering of annotations or data from ontology graphs rather than molecular networks GOAL: Maximally exploit functional information from a molecular interaction network for association scoring and visualization
- 4. 3 EnrichNet: Design principles (1) Network association measure for mapped datasets: account for distances in a molecular network and multiplicity and density of interactions between the datasets of interest (use random walk distances instead of shortest paths distances) Example sub-networks: reference node target set node other nodes Case 1: dense inter- connections Case 2: sparse inter- connections
- 5. 4 EnrichNet: Design principles (2) Handling of overlapping nodes and long distance outliers: overlapping nodes and node pairs with small distances expected to be over-represented in functionally associated datasets: assign heigher weight to short distance node pairs account for outlier nodes: assign lower weight to long distance node pairs Example sub-network: outlier (low weight) outlier (low weight) pathway node target set node other nodes overlap (high weight)
- 6. 5 EnrichNet: Procedure Input: • 10 or more human gene or protein identifiers of interest (= target set) • Selection of a reference database (gene sets from GO, KEGG, BioCarta, Reactome, WikiPathways, PID, etc.) Processing (details on next slides): • Target and reference datasets are mapped onto a human genome-scale molecular network (default: STRING confidence-weighted PPI network, optional: user-defined network) • Random walk with restart (RWR) algorithm applied to compute node-specific association scores between mapped target set and reference sets • Integration of scores for each reference set and comparison against background model Output: • Ranking table of reference pathways with association scores (optional: 60 tissue-specific scores) • For each reference dataset: Interactive sub-network visualization of the association with target set
- 7. 6 EnrichNet: Random walk with restart (RWR) RWR relevance scoring (Tong et al., 2006): Simulate random walks via iterative matrix multiplications: pt+1 = (1-r) A pt + p0 • A:= network adjacency matrix • r:= restart probability (here: r = 0.9) • pi t:= probability walker is at node i at time t Result: a vector of node relevance scores for each reference pathway (converted to distance scores and compared against a background model, see next slide) Example network: target set target/pathway overlap pathway 1 pathway 2
- 8. 7 EnrichNet: Background model Pathway-based background model: • Gene/protein sets for background model should have similar connectivity properties as pathway-representing reference nodes (not the case for random matched-size node sets) use score distribution across the entire reference database as background (n = number of equally spaced distance bins, default: n = 10; Tissue-specific scores: pre-filter nodes by tissue-label) • Apply Xd-distance (Olmea et al., 1999) to compare foreground against background distances distance-dependent weighting (account for long-distance and high degree outliers)
- 9. 8 EnrichNet: Comparative analysis Comparative analysis on benchmark microarray data: • compare EnrichNet against classical over-representation analysis using benchmark datasets from the Broad Institute of MIT and Harvard (5 gene expression datasets and 2 reference databases) EnrichNet provides a consistently higher agreement with benchmark gene set rankings
- 10. 9 EnrichNet: Results Biological application on disease-related gene sets EnrichNet is suited in particular for the following settings: 1) Target gene/protein set of interest has no associated high-throughput experimental data: Examples: Mutated genes in genetic diseases (OMIM, COSMIC, CGC) Gene sets obtained from the literature (risk factors, animal model genes) 2) Target and reference set share few members but are densely connected in the network: Examples: Occurs often for differentially expressed genes (DEGs) in complex phenotypes (examples for Parkinson‘s disease on next slides) Occurs often when integrating results from different studies or omics (e.g. comparing transcriptomics and proteomics data)
- 11. 10 DEGs for Parkinson‘s disease (PD) vs. KEGG PD pathway • DEGs in PD vs. control samples • KEGG Parkinson‘s disease pathway • Overlap OPA1 mediates mitochondrial fusion NR4A2 mutations have been associated with familial PD
- 12. 11 DEGs for PD vs. exocytosis regulation pathway • DEGs in PD vs. control samples • Regulation of exocytosis process (Gene Ontology) • Overlap
- 13. 12 Summary • EnrichNet provides a new means to score and interpret gene/protein set associations by exploiting functional information captured in the graph structure of molecular networks • New functional associations are identified and sub-network visualizations enable a biological interpretation on the level of single molecular interactions
- 14. 13 Availability Software, tutorials and examples freely available at: www.enrichnet.org We acknowledge support by:
- 15. 14 References References 1. E. Glaab, A. Baudot, N. Krasnogor, R. Schneider, A. Valencia. EnrichNet: network-based gene set enrichment analysis, Bioinformatics, 28(18):i451-i457, 2012 2. E. Glaab, R. Schneider, PathVar: analysis of gene and protein expression variance in cellular pathways using microarray data, Bioinformatics, 28(3):446-447, 2012 3. E. Glaab, J. Bacardit, J. M. Garibaldi, N. Krasnogor, Using rule-based machine learning for candidate disease gene prioritization and sample classification of cancer gene expression data, PLoS ONE, 7(7):e39932, 2012 4. E. Glaab, A. Baudot, N. Krasnogor, A. Valencia. TopoGSA: network topological gene set analysis, Bioinformatics, 26(9):1271-1272, 2010 5. E. Glaab, A. Baudot, N. Krasnogor, A. Valencia. Extending pathways and processes using molecular interaction networks to analyse cancer genome data, BMC Bioinformatics, 11(1):597, 2010 6. H. O. Habashy, D. G. Powe, E. Glaab, N. Krasnogor, J. M. Garibaldi, E. A. Rakha, G. Ball, A. R Green, C. Caldas, I. O. Ellis, RERG (Ras-related and oestrogen-regulated growth-inhibitor) expression in breast cancer: A marker of ER-positive luminal-like subtype, Breast Cancer Research and Treatment, 128(2):315-326, 2011 7. E. Glaab, J. M. Garibaldi and N. Krasnogor. ArrayMining: a modular web-application for microarray analysis combining ensemble and consensus methods with cross-study normalization, BMC Bioinformatics,10:358, 2009 8. E. Glaab, J. M. Garibaldi, N. Krasnogor. Learning pathway-based decision rules to classify microarray cancer samples, German Conference on Bioinformatics 2010, Lecture Notes in Informatics (LNI), 173, 123-134 9. E. Glaab, J. M. Garibaldi and N. Krasnogor. VRMLGen: An R-package for 3D Data Visualization on the Web, Journal of Statistical Software, 36(8),1-18, 2010