Weitere ähnliche Inhalte
Ähnlich wie Time & motion study (20)
Mehr von Anupam Kumar (20)
Kürzlich hochgeladen (20)
Time & motion study
- 1. 4/11/2013
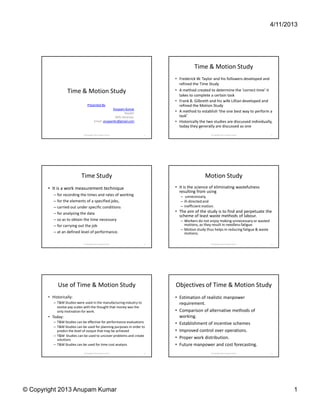
Time & Motion Study
• Frederick W. Taylor and his followers developed and
refined the Time Study
Time & Motion Study • A method created to determine the ‘correct time’ it
takes to complete a certain task
• Frank B. Gilbreth and his wife Lillian developed and
Presented By: refined the Motion Study
Anupam Kumar
Reader • A method to establish ‘the one best way to perform a
SMS Varanasi. task’
Email: anupamkr@gmail.com • Historically the two studies are discussed individually,
today they generally are discussed as one
© Copyright 2013 Anupam Kumar 1 © Copyright 2013 Anupam Kumar 2
Time Study Motion Study
• It is a work measurement technique • It is the science of eliminating wastefulness
resulting from using
– for recording the times and rates of working – unnecessary,
– for the elements of a specified jobs, – ill-directed and
– carried out under specific conditions – inefficient motion.
– for analyzing the data • The aim of the study is to find and perpetuate the
scheme of least waste methods of labour.
– so as to obtain the time necessary – Workers do not enjoy making unnecessary or wasted
– for carrying out the job motions, as they result in needless fatigue.
– Motion study thus helps in reducing fatigue & waste
– at an defined level of performance. motions.
© Copyright 2013 Anupam Kumar 3 © Copyright 2013 Anupam Kumar 4
Use of Time & Motion Study Objectives of Time & Motion Study
• Historically: • Estimation of realistic manpower
– T&M Studies were used in the manufacturing industry to requirement.
evolve pay scales with the thought that money was the
only motivation for work. • Comparison of alternative methods of
• Today: working.
– T&M Studies can be effective for performance evaluations • Establishment of incentive schemes
– T&M Studies can be used for planning purposes in order to
predict the level of output that may be achieved • Improved control over operations.
– T&M Studies can be used to uncover problems and create
solutions • Proper work distribution.
– T&M Studies can be used for time cost analysis • Future manpower and cost forecasting.
© Copyright 2013 Anupam Kumar 5 © Copyright 2013 Anupam Kumar 6
© Copyright 2013 Anupam Kumar 1
- 2. 4/11/2013
Steps Involved in T&M Study Job Element
• Selection • Should be as short as possible and should be
conveniently timed.
• Obtain all necessary information
• Should be unified and should have logical sequence
• Divide the job into job-elements of basic motions.
• Time each element • Constant and variable elements should be separated
• Number of cycles to be timed for generation of data for subsequent studies.
• Rate the operator • Regular and Irregular elements should be separated
so as to provide for time allowances.
• The rating of the operator to be objective • Elements involving heavy and fatigue work should be
• Make provisions for allowances. separated to allow for proper allowances.
© Copyright 2013 Anupam Kumar 7 © Copyright 2013 Anupam Kumar 8
Determination of Times Determination of Times
• Standard Time • Performance Rating
– It is the time required – It is the pace of the actual work being done as a
– by an operator of average skill percentage of the standard pace of doing the same work.
– who expends an average amount of effort and • Level of Performance
– is working under average conditions.
– It is the rate of output achieved by a qualified worker as an
• Use of Standard Time average for the day.
– To establish minimum performance requirements
• Normal Time
– Control of labour cost
– It is the productive time needed to perform a task, utilizing
– Planning wage incentive schemes
appropriate work methods, work area layout and
– Product line balancing.
performing at a pace the firm defines as normal.
© Copyright 2013 Anupam Kumar 9 © Copyright 2013 Anupam Kumar 10
Determination of Times Determination of Times
• Actual Time • Allowance
– It is the time actually taken in completing the desired – Standard times for elements or jobs are necessary to
task. provide for allowances for compensating fatigue, personal
– If the operator works at 100% efficiency then the needs, contingencies, etc.
actual time would be equal to the normal time. – These are generally given as a percentage of the standards
• Use of Actual Time time or normal time.
– In method study – If allowance is given as a percentage of normal time
• Standard Time = Normal Time (1+Allowance)
– In plant layout planning
– If allowance is given as a percentage of standard time
– In setting realistic starting and finishing times for
• Normal Time = Standard Time (1 – Allowance)
operator.
© Copyright 2013 Anupam Kumar 11 © Copyright 2013 Anupam Kumar 12
© Copyright 2013 Anupam Kumar 2
- 3. 4/11/2013
Allowances or Time Allowances Illustration 1
• Relaxation Allowance • Reject Allowance • How many working minutes do you expect
– For fatigue and personal – Time used up in
needs producing items which
would take a worker to produce a part for
• Contingency Allowance turn out to be defective which
– For duties of periodic • Interference Allowance – the time standard is 10 minutes,
nature – Stoppage of 2 or
machines
– if the allowance for this work is 25% of the normal
• Tools and Machinery time and
Allowance • Excessive Work
– For adjusting machines, Allowance – the worker is rated at 80%?
sharpening tools, etc. – Due to unforeseen Click for Solutions
temporary changes
© Copyright 2013 Anupam Kumar 13 © Copyright 2013 Anupam Kumar 14
Solution to Illustration No. 1 Illustration 2
Standard time = 10 Min Standard time = 10 Min • Calculate the standard production per shift of
Allowance = 25% of N.T. Performance Rating = 80% 8 hours duration, with the following data.
ST = NT (1+All.) Actual time = ST/Per. Ratg
– Observed time per unit = 5 minutes
⇒ NT = ST / (1 + All.) ⇒ AT = 10/(80%)
⇒ NT = 10/(1+25%) ⇒ AT = 12.5 Min. – Rating factor = 120%
⇒ NT = 8 Min Actual time = Observed time – Total Allowance = 33.33% of normal time.
Performance Rating = (Normal *(1+All.)
time) / (Observed time) ⇒ OT = AT / (1+ All.)
⇒ OT = NT / (Per. Rating) ⇒ OT = 12.5 / (1+25%)
Click for Solutions
⇒ OT = 8/(80%) ⇒ OT = 12.5 X 4/5
⇒ OT = 10 Min. ⇒ OT = 10 Min.
© Copyright 2013 Anupam Kumar 15 © Copyright 2013 Anupam Kumar 16
Solution to Illustration No. 2 Methods of Time Estimation
OT = 5 Min 8 Min. is needed for 1 Unit • Study of Past Production Records
Per. Ratg. = 120% ⇒ 1 Min. is needed for 1/8 unit
⇒ 8 Hrs. is needed for 8 X 60/8 – It is an invaluable source of information regarding
All. = 33.33% of NT
Units the time taken to perform a particular task.
NT = OT * Per. Ratg. ⇒ 8 Hrs. is needed for 60 units.
– It is however assumed that the nature of activities
⇒ NT = 5 X 120/100
performed in the process does not change over
⇒ NT = 6 Min. • The standard production
per shift is 60 Units.
the period of time.
ST = NT (1+ All.)
⇒ ST = 6 (1+33.33%) • Estimation Method
⇒ ST = 6X4/3 – It involves the analysis based on the experience &
⇒ ST = 8 Min. judgment of the observer.
© Copyright 2013 Anupam Kumar 17 © Copyright 2013 Anupam Kumar 18
© Copyright 2013 Anupam Kumar 3
- 4. 4/11/2013
Work Measurement Techniques Illustration 3
• Direct Time Study Methods • Calculate the standard time per article produced
– Analytical Estimation from the following data obtained by a work sampling
– Work Sampling study.
• It is based on statistical estimation of work during various time
samples. – Total No. of observations = 2500
• Indirect Time Study Methods – No. of working observations = 2100
– Synthetic Timing Data – No. of units produced in 100 hours duration = 6000
• It is based on the previous data available with the establishment – Proportion of manual labour = 2/3
which helps in synthesizing the overall data
– Proportion of machine time = 1/3
– Predetermined Motion Time Studies (PMTS)
• It is based on the standard data available based on the various – Observed rating factor = 115%
micro motion studies. – Total allowance = 12% of normal time.
Hint
© Copyright 2013 Anupam Kumar 19 © Copyright 2013 Anupam Kumar 20
Hint for Illustration 3 Illustration 4
• Actual Working time in 100 hours = 100*2100/2500 = 84 • After application of work simplification techniques and a
• Time taken per article = 84*60/6000 = 0.84 Min. direct time study of elements the following time elements in
• Observed Manual time = (2/3) * 0.84 = 0.56 Min. minutes were obtained as in table below.
• Observed Machine time = (1/3) * 0.84 = 0.28 Min. Job Cycle
Element 1 2 3 4 5
• Normal Labour time = Observed Manual time * Rating Factor
1 0.16 0.12 0.13 0.15 0.24
= 0.56 * 1.15
2 0.60 0.60 0.60 0.60 0.60
• Standard Labour Time = (0.56*1.15) * (1+ 12/100)
3 0.33 0.50 0.35 0.37 0.35
= 0.56*1.15*1.12 4 0.50 0.50 0.50 0.50 0.50
• Standard time per unit = Standard Labour Time + Observed Machine Time 5 0.24 0.24 0.25 0.27 0.25
© Copyright 2013 Anupam Kumar 21 © Copyright 2013 Anupam Kumar 22
Illustration 4 (Contd.) Hint for Illustration 4
• The following information was also determined about the job. • Identify the Irregular occurrences.
– Job Element 2 & 4 are machine controlled and cannot be speeded up • Calculate the average time for each job element.
by the operator
• Calculate Normal Time and then Standard Time by using the
– There were 2 irregular occurrences while timing.
data given for allowances.
– The operator was rated at 110% when working.
– Personal allowance – 30 min/day; Unavoidable delays – 20 min/day & Job Cycle Ave.
Fatigue 10% of the operator’s actual physical time. Element 1 2 3 4 5 Time
– Shift is 8 hour long. 1 0.16 0.12 0.13 0.15 0.24 0.14
• Calculate standard time per unit & shift output standard. 2 0.60 0.60 0.60 0.60 0.60 0.60
3 0.33 0.50 0.35 0.37 0.35 0.35
4 0.50 0.50 0.50 0.50 0.50 0.50
5 0.24 0.24 0.25 0.27 0.25 0.25
Hint Solution
© Copyright 2013 Anupam Kumar 23 © Copyright 2013 Anupam Kumar 24
© Copyright 2013 Anupam Kumar 4
- 5. 4/11/2013
Solution for Illustration No. 4 Illustration No. 5
OTJE1 = 0.14 NTtotal =0.8954+0.50+0.60 = • An operator manufactures 50 jobs in 6 hours
⇒ NTJE1 = OTJE1 X Per. Rat. 1.9954
and 30 minutes. If this time includes the time
⇒ NTJE1 = 1.4 X 110/100 ST = NTtotal / (1 – AllowanceST)
Allowance = (30 + 20) / (8 * 60)
for setting the machine. Calculate the
⇒ NTJE1 = 1.54
Similarly, Allowance = 0.104167 operator’s efficiency. Standard time allowed
NTJE3 = 0.385 ST = 1.9954 / (1- 0.1042) for the job is as follows.
NTJE5 = 0.275 ST = 1.9954 / 0.8958 = 2.227 Sr. No. Job Element Details
NTmanual = 0.814 min 1. Setting Time 35 minutes
Tmanual = 0.814 * 1.10 = 0.8954 Standard Time = 2.23 minute 2. Production time per piece 8 minutes
NTtotal = Tmanual + Tmachine Shift Output = 8 * 60 / 2.23 Solution
Shift Output = 215.25 Units.
© Copyright 2013 Anupam Kumar 25 © Copyright 2013 Anupam Kumar 26
Solution for Illustration No. 5 Illustration 5
• Time data taken for a bulk filling activity in Bangalore were recorded on a
• 50 Jobs in 6 hours and 30 minutes continuous basis as shown below.
⇒50 Job in (6*60 +30) minutes = 390 minutes • The firm’s labour contract requires a 15% allowance based on total time
for all workers on the bulk filling line
• Compute the standard time for this activity.
• Standard Time = Setting time+Production time Cycle Time (in Sec.) Rating
⇒S.T. = 35 + 8*50 = 35 + 400 = 435 minutes Factor
1 2 3 4 5
Grasp Bag 4 37 74 105 338 120
• Per. Rating = Standard Time / Actual time Locate for fill 16 51 84 117 352 120
Machine Fill 26 61 94 127 362
⇒Per. Rat. = (435 / 390)*100 = 111.5% Set on Conveyor 34 68 102 334 369 110 Hint
© Copyright 2013 Anupam Kumar 27 © Copyright 2013 Anupam Kumar 28
Hint for Illustration No. 6 Solution for Illustration No. 6
Cycle Time (in Sec.) Rating Cycle Time (in Sec.) Average
Factor
1 2 3 4 5
1 2 3 4 5
Grasp Bag 4 3 6 3 4 4
Grasp Bag 4 37 74 105 338 120
Locate for fill 12 14 10 12 14 12.4
Locate for fill 16 51 84 117 352 120
Machine Fill 10 10 10 10 10 10
Machine Fill 26 61 94 127 362
Set on Conveyor 8 7 8 207 7 7.5
Set on Conveyor 34 68 102 334 369 110
Grasp Bag 4 3 6 3 4 120
• Allowance = 15% on total time = 15% of Standard Time
• Normal Time = (OT1 XPer.Rat.1 + OT2 XPer.Rat.2 +OT3 + OT4 XPer.Rat.4)
Locate for fill 12 14 10 12 14 120
• Normal Time = 4*1.2 + 12.4*1.2+10+7.5*1.1 = 4.8 + 14.88 + 10 + 8.25
Machine Fill 10 10 10 10 10
• Normal Time = 37.93 sec.
Set on Conveyor 8 7 8 207 7 110
• Standard Time = NT / (1 – All.) = 37.93 / (1 – 0.15) = 37.93/0.85
Solution • Standard Time = 44.62 sec.
© Copyright 2013 Anupam Kumar 29 © Copyright 2013 Anupam Kumar 30
© Copyright 2013 Anupam Kumar 5
- 6. 4/11/2013
Further Numericals
• Assuming that the total observed time for an operation of
assembling an electric switch is 1 minute. If the rating is 125%,
find normal time. If an allowance of 20% is allowed for the
operation for employee fatigue, determine the standard time. For further details,…
• Find out the standard time using the following data:
Contact:
Sr. No. Job Element Details Anupam Kumar
1. Average time for machine element 7 min. Reader,
2. Average time for manual element 5 min. SMS Varanasi.
3. Performance Rating 120% Email: anupamkr@gmail.com
4. Allowance (as a percentage of S.T.) 15%
© Copyright 2013 Anupam Kumar 31 © Copyright 2013 Anupam Kumar 32
Bibliography
• Buffa, E.S. and Sarin, R.K., “Modern Production/Operations Management,” Eighth Edition. Singapore: John Wiley &
Sons (Asia). 1994.
• Martinich, J.S., “Production and Operations Management: An Applied Approach”, Singapore: John Wiley & Sons
(Asia), 2003.
• Badi, R.V. and Badi, N.V., “Production and Operations Management”, Second Edition, New Delhi: Vrinda
Publication, 2008.
• Chary, S.N., “Productions and Operations Management,” Third Edition, New Delhi: Tata McGraw Hill, 2004
• Kumar Anil, S. and Suresh, N.. “Production and Operations Management,” New Delhi: New Age International
Publishers Second Edition, 2008.
• Goel, B.S., “Production Operations Management”, Twenty Second Edition, Meerut, U.P.: Pragati Prakashan, 2010.
• Kachru, U. “Production and Operations Management: Text and Cases,” New Delhi: Excel Books, 2007.
• Rama Murthy, P., “Production and Operations Management,” New Delhi: New Age International, 2012.
• Chunawalla, S.A., and Patel, D.R., “Production and Operations Management,” Mumbai: Himalaya Publishing
House, 2006.
• Jauhari, V. and Dutta, K., “Services: Marketing Operations and Management,” New Delhi: Oxford University Press,
2010.
• Verma, H.V., “Services Marketing: Text and Cases,” New Delhi: Dorling Kindersley, Pearson Education, 2009.
© Copyright 2013 Anupam Kumar 33
© Copyright 2013 Anupam Kumar 6