RSA Conference Exhibitor List 2024 - Exhibitors Data
Options trading research
1. By Bernie Schaeffer
As regular readers of these commentaries well know, I am a big fan of determining "price levels of interest" as a
prerequisite for success in options trading. You simply cannot be a successful options trader without a wellconstructed price forecast for the underlying security, as well as a specific time frame during which you expect
this price forecast to be achieved. Without a price forecast within a time frame, you have no idea which strike to
select, how much time to buy, or whether a particular month and strike is too richly priced for the reward achieved
to be worth the risk, even if your price forecast proves correct. And without price forecasts that are intelligently
constructed, you are simply rolling the dice or flipping a coin when you trade.
Since most options traders look to purchase time that's measured in days and weeks (as opposed to months and
years), the so-called fundamentals of the stock must by definition take a distant back seat to technical factors
(such as moving averages and levels of chart support and resistance) in developing this price forecast. And I
have very often found that some deceptively simple price levels -- such as those derived from round number
year-to-date gains and round number price levels of all sorts -- can provide very effective roadmaps that can help
explain past price movement and serve as a framework for developing a price forecast for the weeks ahead.
For example, stocks and market indices often encounter price hesitation or "congestion" at round number price
levels (such as $70.00) for a number of logical reasons. Traders will often target overhead round number levels
for at least initial profit taking on rallies. And the fact that activity in call and put options is most often the heaviest
at round number strike prices (as measured by the open interest levels at these strikes) adds further to the
"congestion," as adjustments by those holding (or hedging) options positions often have a tendency to create
mean-reverting movement toward the strike price. And while technicians who trade options usually focus on
short-term indicators to match their abbreviated time horizon, by so doing they can miss out on some very
significant long-term phenomena that can come into play over the short term. For example, rallies will often
hesitate at multiples of a previous low and market declines at fractions of a previous high. Common areas of
hesitation would include twice the most recent major low (or half the most recent high), but higher multiples and
lesser fractions (sometimes as small as 10%) can also come into play.
With this serving as our background, let's take a look at the road maps for some of the major worldwide market
indices. (Charts courtesy of Google Finance.)
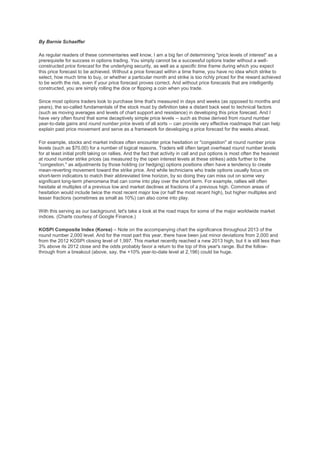
KOSPI Composite Index (Korea) – Note on the accompanying chart the significance throughout 2013 of the
round number 2,000 level. And for the most part this year, there have been just minor deviations from 2,000 and
from the 2012 KOSPI closing level of 1,997. This market recently reached a new 2013 high, but it is still less than
3% above its 2012 close and the odds probably favor a return to the top of this year's range. But the followthrough from a breakout (above, say, the +10% year-to-date level at 2,196) could be huge.
2.
3. S&P BSE SENSEX (India) – The trading range pattern this year of the SENSEX has been very similar to that of
the KOSPI – just substitute 20,000 for 2,000 as the major level of interest. Note the October rally to 2013 highs
has thus far fallen short of the +10% year-to-date level, and a breakout above this level (at 21,368) could lead to
impressive additional gains
When you buy a long put option on a stock, it's because you expect the shares to decline. In a long put spread,
however, you probably have a more concrete downside target in mind. Rather than betting on an all-out plunge in
the underlying equity, you might be expecting a more muted decline -- perhaps with a particular layer of support
in mind that could halt a downtrend.
By selecting a likely floor for the equity's decline, and then selling a put at a corresponding strike, a bearish trader
can effectively reduce the cost of entry and breakeven point on the trade. On the other hand, the trade-off is a
lower potential profit than a straightforward put play.
To examine a long put spread in action, let's check out an example.
Stock XYZ is trending lower on the charts, and you expect the slide to continue during the near term. However,
with the shares trading at $48, you suspect the $45 level may step up to act as a temporary floor. This area
previously acted as support on multiple occasions, and you see no reason to expect it will give way during the
next month or so.
To implement a long put spread, you buy to open a 47.50-strike put, asked at $0.40, and sell to open a 45-strike
put, bid at $0.10. Subtracting the premium you collected for selling the short put from the premium you paid for
the long put, your net debit on the trade is $0.30. Multiplied by 100 shares per contract, your total cost of entry is
$30.
Since the long put spread is typically initiated for a net debit, it's considered to be a "debit spread."
The best-case scenario is for XYZ to settle exactly at $45 upon expiration. In this case, you can collect the
maximum profit on the long put, which is equivalent to the difference between the two option strikes, less the net
debit — or (47.50 – 45) – $0.30 = $2.20. Accounting for 100 shares per contract, you stand to rake in a profit of
$220 on the spread. Meanwhile, the short put can be left to expire worthless.
You'll reap the same profit if XYZ finishes anywhere below $45, although you'll then have to initiate another
transaction to buy to close your short put.
Breakeven, meanwhile, is equal to the purchased put strike less the net debit. In this example, once XYZ falls
below $47.20, your profits will begin to add up. (For comparison's sake: if you'd simply bought the long put at the
47.50 strike, the stock would need to drop below $47.10 before you'd begin to see profits, as your debit would be
the entire $0.40 paid to buy the option.)
If XYZ remains at or above $47.50 through expiration, the most you stand to lose is your initial net debit of $0.30,
or $30.
There's also a potential opportunity loss involved if XYZ should plummet significantly below the sold put strike
before expiration. While the long put spread effectively lowers your breakeven and cost of entry, it also curbs
your ability to profit from a drastic downside move.
Before opting for a long put spread over a long put, carefully assess the stock's technical outlook and your own
trading goals to determine whether the lower upfront cost is justified by the reduced profit potential. In the
example above, XYZ would need to drop just another $0.10 to offset the premium collected on the sold put.