Powerpoint 3D Chart Collection Data Driven

"Numbers speak for themselves", this quote perfectly reflects importance and authenticity of numbers. Numeric data appeals the audience more than anything, that's why numbers are inevitable for most presentations. However, at the same time it's very challenging to represent numeric data without losing interest of audience. This data driven 3D chart Collection template allows you to represent your complicated yet important data such as earning through various sources, market share, sales done by different channels, etc. Slides in this templates contains absolutely new array of graphics ever used for charts. These graphics such as cone bars, Angled bars and many others will definitely amuse your audience. The most important factor is easy customization capability and flexibility of graphics used in this template, a presentator just need to do a right click on the chart and go to 'edit data' option to change data that will reflect in the graph automatically, compatible with PowerPoint 2007 only. One can also change colors to suit their on theme. Bar charts will be very helpful to furnish comparative details to your audience.

Empfohlen
Empfohlen
Weitere ähnliche Inhalte
Andere mochten auch
Andere mochten auch (10)
Mehr von SlideShop.com
Mehr von SlideShop.com (20)
Kürzlich hochgeladen
Kürzlich hochgeladen (20)
Powerpoint 3D Chart Collection Data Driven
- 1. 3D CHART COLLECTION DATA-DRIVEN Download at SlideShop.com
- 2. 3D CHART COLLECTION DATA-DRIVEN Download at SlideShop.com
- 3. 3D CHART COLLECTION DATA-DRIVEN Download at SlideShop.com
- 4. 3D CHART COLLECTION DATA-DRIVEN Download at SlideShop.com
- 5. 3D CHART COLLECTION DATA-DRIVEN Download at SlideShop.com
- 6. 3D CHART COLLECTION DATA-DRIVEN Download at SlideShop.com
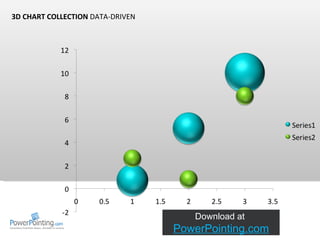
- 7. 3D CHART COLLECTION DATA-DRIVEN
- 8. 3D CHART COLLECTION DATA-DRIVEN Download at SlideShop.com
- 9. 3D CHART COLLECTION DATA-DRIVEN
- 10. 3D CHART COLLECTION DATA-DRIVEN
- 11. 3D CHART COLLECTION DATA-DRIVEN
- 12. 3D CHART COLLECTION DATA-DRIVEN
- 13. 3D CHART COLLECTION DATA-DRIVEN Download at SlideShop.com
- 14. 3D CHART COLLECTION DATA-DRIVEN 3D CHART COLLECTION DATA-DRIVEN Download at SlideShop.com
- 15. 3D CHART COLLECTION DATA-DRIVEN Download at SlideShop.com
- 16. 3D CHART COLLECTION DATA-DRIVEN Download at SlideShop.com
- 17. 3D CHART COLLECTION DATA-DRIVEN Download at SlideShop.com
- 18. 3D CHART COLLECTION DATA-DRIVEN Download at SlideShop.com
- 19. 3D CHART COLLECTION DATA-DRIVEN Download at SlideShop.com
- 20. 3D CHART COLLECTION DATA-DRIVEN Download at SlideShop.com
- 21. 3D CHART COLLECTION DATA-DRIVEN Download at SlideShop.com
- 22. 3D CHART COLLECTION DATA-DRIVEN Download at SlideShop.com