1. Holistic Dam Operations Assessment for Southeast Queensland
Luke Toombes
Rob Ayre
Aurecon Australasia Pty Ltd, Brisbane QLD, AUSTRALIA
Many large dams are built as multi-purpose structures, providing both flood mitigation and bulk water
storage, but requiring a trade-off in functionality between those purposes. In response to the Millennium
Drought (2001 to 2009) closely followed by devastating floods in 2011, the State of Queensland initiated a
comprehensive review of the operation of its flood mitigation dams. Part of this study involved
development of an Integrated Assessment Methodology to provide an informed and unbiased assessment of
the competing factors affecting dam operations. The methodology assessed the primary variables of flood
damage and other impacts, future bulk water infrastructure and water security requirements in the form of
a net present cost/benefit. The study concluded that modification of the dam flood release strategy to
reduce flood damage during large events would come at the expense of increased frequency of minor
flooding, or vice versa, with minimal net benefit. Similarly, reducing bulk water storage to increase flood
mitigation would increase water supply costs by a similar magnitude to the flood damage prevented.
Keywords: Flood damage, water supply, water security, net present cost, joint assessment
Introduction
Flood mitigation or water supply?
Many of Australia’s larger dams have been built as multi-
purpose structures, providing some degree of flood
mitigation together with bulk water storage. Completed
in 1985, Wivenhoe Dam on the Brisbane River is a multi-
functional dam that is used for the storage and supply of
water, for flood mitigation and also as the lower pumping
pool for a hydro-electric generation scheme. The policy
behind the operation of Wivenhoe Dam involves the
balancing of its functions, namely securing water supply
and providing flood mitigation for the communities
located downstream along the Brisbane River. Wivenhoe
Dam is equipped with five radial gates that increase the
water storage capacity and which can also be used to
release water at set times during flood events, as well as
fuse-plug spillways for emergency release of water during
extreme flood events.
Southeast Queensland experienced severe and prolonged
drought conditions during the period from 2001 to 2009.
The Millennium drought, as it became known, was the
most severe drought to impact the region in 125 years of
record, eclipsing the previous record Federation drought
(1900-1903). Wivenhoe Dam levels dropped to 17%
capacity by August 2007, during which time severe water
restrictions were imposed throughout the regulated supply
areas and consumption fell to below 170 L/person/day.
The State government implemented several drought
contingency measures including the construction of a
$1.8billion desalination plant at Tugun on the Gold Coast
(GCDP) and the $2.1billion Western Corridor Recycled
Water Scheme (WCRWS), involving the conveyance of
treated wastewater from five existing treatment plants in
Brisbane to advanced treatment plants to enable this water
to either be used by industrial users such as Swanbank
and Tarong power stations or utilised in an indirect
potable reuse scheme involving Wivenhoe Dam. The
Millennium drought was officially declared over once the
combined capacity of Somerset and Wivenhoe Dams
reached 60%, which occurred in May 2009 when
Somerset dam spilled for the first time since early 2001.
Public and political opinion has a tendency to vary in
response to the prevailing circumstance. During a flood
event in October 2010, the State opposition called for the
floodwaters that were being released from Wivenhoe
Dam to be retained and the water storage capacity of
Wivenhoe Dam increased by raising the full supply level
by 2m. However, all this changed as a result of the 2010-
2011 wet-season when six significant rainfall events led
to unprecedented flood conditions throughout
Queensland. Some 78% of the state was declared a
disaster zone and record releases from dams in all regions
of the State occurred, especially in Southeast Queensland.
The January 2011 flood event led to significant impacts in
the cities of Brisbane and Ipswich, with damages
estimated to be between $3.5 and 4.5billion. Following
these floods, several parties called for the Wivenhoe full
supply level to be lowered from its current capacity to
provide additional free volume for flood mitigation.
Making an informed response
The conflicting objectives of water supply and flood
mitigation require a balanced assessment in order to make
an informed decision rather than a knee-jerk reaction to
the latest water crisis. Responding to the devastating
floods in January 2011 and subsequent recommendations
of the Queensland Floods Commission of Inquiry, the
State of Queensland initiated a detailed review of the
operation of the flood mitigation dams in southeast
Queensland as part of the Wivenhoe and Somerset Dam
Optimisation Study (WSDOS) and North Pine Dam
Optimisation Study (NPDOS). Seqwater developed a
dam operations model to perform stochastic simulations
of the Wivenhoe Dam flood operations for thousands of
synthetic flood events in order to examine the complex
interaction between dam operations, flood release and
downstream tributary flows. Additionally, the Integrated
Assessment Methodology (IAM) was developed to assess
and compare the relative costs and benefits of dam
operation or other strategies affecting the southeast
Queensland flood mitigation and water supply systems.
The primary focus of the project has been the trade-off
between flood mitigation and water supply.
2. Assessment of flood damage is based upon the complex
relationship between dam releases, river flow, flood
heights, flood frequency and resultant damage sustained
in terms of property and infrastructure affected and
financial loss. These must be weighed against issues such
as potential changes to water supply, drought risk, as well
as present and future infrastructure costs. The objective of
the integrated assessment was to quantify, compare and
report on various operational options for mitigating flood
damage to identify preferred options and assist in making
trade-offs between the multiple influences on dam
operations.
To allow different scenarios to be compared, it is
necessary to translate these impacts into a consistent and
measureable format. The simplest comparable format is
that of a Net Present Cost (NPC), although there are
limitations with this approach. For phenomena that are
both discrete and random, such as floods, NPC must be
presented in the form of average or expected value. The
actual cost may however vary significantly depending
upon the magnitude of floods that then occur (if any).
NPC is only one indicator of the relative benefit of a
particular option. Other criteria that may be considered to
be important can be identified, but cannot be directly
compared unless they can be converted into an equivalent
cost.
The total expected Net Present Cost is the accumulated
costs that can be directly attributed to, or modified by the
scenario or operating strategy. For this study, scenarios
were assessed based on their effect on a combination of:
Flood damage – spatially distributed property damage
directly related to inundation during a flood (or water
release) event
Flood impact – impacts associated with loss or
disruption of a service due to a flood event
Serviceability and supply impacts (e.g. water security)
– costs directly or indirectly resulting from changes to
a flood mitigation or water supply strategy
Direct infrastructure and other capital costs associated
with implementation of a strategy
Since flood damage assessments are always to some
degree controversial, this paper focusses on the
methodology rather than absolute numbers or specific
outcomes. The reader is referred to DEWS (2014) and
Aurecon (2014) for more information.
Flood damage and impacts
Types of flood damage
Flood damage is a broad term covering damage and
associated impacts to buildings, infrastructure,
environment and the community. Tangible damages are
those that are materially real and measureable. This may
include both direct, physical damages caused by the flood
water, and indirect impacts related to the flood event such
as emergency response, clean-up, community support and
disruption to employment, commerce, tourism or other
services. There may also be intangible damages, such as
environmental or social impacts, which are much more
difficult to quantify and to place a monetary value on.
Damage assessment
When conducting flood damage assessments, greatest
focus is generally placed on direct tangible damages as
these are the most obvious and easiest to attribute a direct
cost relationship. This cost relationship was a key focus,
and therefore also a fundamental limitation of the IAM.
The IAM reviewed available data, but opportunity for
otherwise independent derivation or modification of
damage-cost relationships was limited. Primary focus of
the assessment was therefore direct tangible damages to
buildings (residential and non-residential) and
infrastructure (roads, bridges and rail) and indirect
tangible damage to roads and bridges, related to clean-up,
road closure and repair/reconstruction.
Residential property damage
Residential flood damage is dependent on numerous
factors including flood depth, velocity and duration of
inundation. However, due to the limited data available
most current estimates of property damage are based on
peak flood levels, with the other factors assumed to have
relatively minor influence on building damages.
A number of Australian studies have developed
residential stage-damage functions. One of the
consistently referenced works is ANUFLOOD
(Greenaway and Smith, 1983). The ANUFLOOD stage-
damage curves are only appropriate in gently flowing
waters (velocity less than 1 m/s). Dale et al (2004)
developed stage-damage functions including velocity, but
these have not been widely adopted so far. The
Queensland Department of Natural Resources and Mines,
in its publication ‘Guidance on the Assessment of
Tangible Flood Damages’ (DNRM 2002), presented
stage-damage based on ANUFLOOD functions for three
house sizes. WRM (2006) developed stage-damage
functions for Maroochy Shire Council. These were sub-
divided into three types of damage; external damage
(vehicles, fences, sheds etc.), internal damage (contents of
main building) and structure damage. These functions
were adopted and updated by KBR (2011) for use by
Ipswich City Council. For the same council, O2 (2012)
recommended a hybrid function between the
ANUFLOOD approach and that developed by the NSW
Department of Environment, Climate Change and Water
(DECCW), which serves as one of the guideline
documents for Floodplain Risk Management.
Based on review of the existing damage assessment
approaches, the O2 (2012) methodology was adopted for
the IAM. Amongst other benefits, the O2 study assessed
structural damages based on reconstruction and reparation
costs, which leads to higher damage estimates but is
considered to provide more reliable results than other
available approaches. Like the WRM (2006) approach,
the O2 methodology distinguishes external, internal and
structural damages. Damage functions were derived for
five different housing types:
Fully detached, single storey (FDSS)
Fully detached, double (and more) storey (FDDS)
Fully detached, high set (FDHS)
Multi-unit, single storey (MUSS)
Multi-unit, double (and more) storey (MUDS)
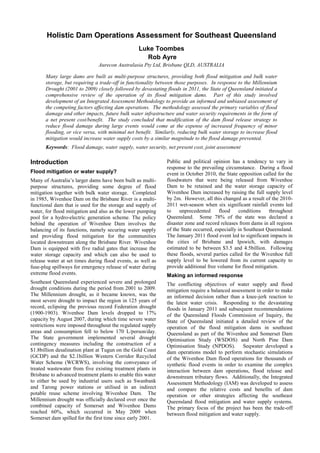
3. Figure 1 shows example stage damage functions for
FDHS properties. Note that internal and structural
damages are based on depth above floor level whereas
external damages are depth above ground level.
Figure 1 Residential stage-damage functions
Non-residential property damage
The ANUFLOOD study (Greenaway and Smith, 1983)
methodology for non-residential properties characterises
properties by two aspects - their size and a ‘value class’.
While the size can be easily assessed by the buildings
footprint in GIS, the value of the property is estimated by
its main use within five categories ranging from very low
to very high value. As opposed to residential buildings,
for non-residential properties the assessment does not
distinguish between structural, internal and external
damages. Instead, the overall damage is directly
expressed in the damage function.
The methodology for non-residential building damage
developed in the ANUFLOOD (1983) study has
subsequently been applied in several flood damage
studies, including DNRM (2002), WRM (2006), KBR
(2011) and O2 (2012), without major improvements. Due
to the absence of other assessment approaches, the
ANUFLOOD methodology for non-residential buildings
was also adopted for the IAM study. However, the
limitations of this methodology are noted both in the IAM
and in this paper, and further research into the assessment
of non-residential damages is recommended to enable
implementation of a state-of-the-art assessment.
Transportation infrastructure damage
Damages to transportation infrastructure such as roads
and railway lines can lead to significant consequences not
only in the flooded area, but in the whole region or
country. The reconstruction and reparation of
transportation routes can also take a very long time,
especially after major flood events. Consequences of
flooding can be direct or indirect, depending on whether
or not the damage is caused directly as a result of
inundation. Indirect damages are of major interest, as the
flooding of roads, railway lines or even airports may lead
to considerable economic impact outside the flooded area.
DNRM (2002) identified that the repair of roads and
bridges is commonly the largest component of damages to
public assets. The amount of damage is a result of flood-
related factors and the ability of the road to withstand
flood conditions, and needs to consider both the initial
repair costs and the possibility of a significant reduction
in the overall life of the road surface. The DNRM method
provides typical damage rates per kilometre of road
inundated based on studies completed following floods in
Victoria, and includes initial repairs and subsequent
accelerated deterioration of roads (i.e. reduced pavement
life) and initial repairs and subsequent additional
maintenance required by bridges.
Direct damage is only one component of transportation
infrastructure impact. Rolfe et al. (2011) conducted a
comprehensive study on indirect consequences of
flooding of transportation infrastructure, identifying that
indirect damage may have a significant share of the
overall flood damage due to traffic interruption since the
flooding can lead to considerable impacts outside the
flooded area. Numerous bridges cross the Brisbane River
downstream of Wivenhoe Dam. A number of these have
relatively low immunity and therefore influence dam
operations, with the ‘rural’ dam operating strategy
currently in place to control minor flood releases to
minimise disruption to rural life where possible.
Specific flood impacts were assessed for seven low level
road bridge crossings of the Brisbane River. These
impacts included costs associated with physical closure,
cleaning/repair and re-opening of the infrastructure as
well as an impact on productivity in the form of a delay
cost per vehicle. The impact cost for a flood event is
calculated by estimating the number of vehicles impacted
by the closure, the average lost time per vehicle due to
diversion via alternate routes, and the cost per vehicle
hour of delay. Closure times are a function of the flood
duration above the bridge deck level, and the time
required to close, clean, repair and reopen the bridge prior
to and after the flood. Values adopted for the assessment
were based on information provided by the Queensland
Department of Transport and Main Roads (DTMR),
which included experience from the Brisbane River
floods of 2011 and 2013.
It is noted that the study only assessed the impact of
flooding on the bridges with relatively low immunity.
Major bridges in the CBD and suburbs of Brisbane City
provide critical infrastructure links across the Brisbane
River. These bridges have a high immunity, but closure
and even failure may potentially occur during extreme
flood events. Consequences of their failure are regional
and lie well beyond simply the number of impacted
vehicles, however there is currently no available
information to predict either when failure may be
expected or the regional impacts that such failure may
have. Flood impacts related to these bridges were omitted,
but considered likely to have minimal relative impact on
the study conclusions on the basis that:
Minor impacts (e.g. bridge closure) are rare, short-
term and not significant compared to the other flood
damages that would occur during the same event
Major impacts (e.g. bridge failure) would only be
expected during extreme flood events, occurring
outside the range where Wivenhoe operations are
focussed on flood mitigation rather than dam safety,
and thus outside the focus of the WSDOS assessment.
0 1 2 3 4 5 6
DamageCost($)
Depth (m)
Structural
Internal
Exernal
4. Other flood damage costs and impacts
Residential, non-residential and transport infrastructure
represent the three common damage types for which
generic flood damage costs studies are available. Damage
and impacts were also estimated for infrastructure items
specific to the Brisbane River, including ferry services
(damage to ferry terminals and disruption to service) and
reinstatement of Wivenhoe Dam fuse-plug spillways if
triggered by extreme flood events (based on Seqwater
cost estimates).
Review of damages attributed to the 2011 and 2013
Brisbane River floods identified a range of other damage
costs, including utilities, public assets and infrastructure,
clean-up and rehabilitation. A single flood event does not
realistically provide sufficient data for a full assessment,
so in the absence of other comparable data, these costs
were assumed to have a consistent relationship to one of
the three common costs to allow the costs to be scaled to
events of other magnitude.
Damage assessment methodology
Flood damage, and hence direct costs associated with the
flood, is dependent on the severity of a particular flood
event. Floods are random events and, while they may
satisfy a particular probabilistic distribution, the severity
and occurrence of any particular future flood event or
events cannot be predicted with any certainty. A simple
method for producing a weighted measurement of flood
impact (damage, time of closure of a bridge, etc.) is
average annual impact, which is the integral of the
impact-frequency curve:
1
0
PdPPIA (1)
where A is the average annual impact and I(P) is the
impact of a flood of probability P. Average annual
damage can then be converted to a net present cost:
Y
i
i
R
A
NPC
1 1
(2)
where R is a cash flow discount rate and Y is a financial
forecast period. Just as the actual flood damage in a given
year may vary significantly from the average, dependent
on the flood (if any) that occurs in that year, so too the
actual net future cost will depend on the timing and
severity of flooding that occurs within the forecast period.
The flood damage cost is therefore referred to as an
average or Expected NPC.
Calculation of ENPC associated with flooding involves a
multi-step process to estimate the damage costs resulting
from the full range of flood events from very likely/minor
damage to very unlikely/maximum damage, culminating
in a probabilistic economic assessment:
STEP 1 Hydrologic assessment to determine flood
characteristics (e.g. discharge, duration, tide
level) at key points in the system for the
complete range of flood events
STEP 2 Hydraulic assessment using the flood
characteristics to calculate flood attributes (e.g.
water level, velocity, duration of inundation)
STEP 3 Flood damage assessment to quantify the damage
and other impacts caused by each flood event
STEP 4 Probabilistic and economic assessments to
calculate the AAD and expected NPC
This procedure is straightforward to implement for a
small or simple system and can be conducted using
design-event type procedures, conducting an independent
hydraulic and damage assessment for each flood event. A
complex dam-influenced system like the Brisbane River
experiences rainfall events with significant variation in
spatial and temporal distribution, creating different
magnitude and timing of multiple inflows upstream and
downstream of the dam that then become interrelated with
dam operations. The procedure for calculating NPC is
then much more complicated.
WSDOS and the Seqwater Dam Operations model were
developed to perform stochastic hydrologic and dam
operations modelling to assess the interrelated nature of
the Brisbane River tributaries and operation of Wivenhoe
and Somerset Dams. To extend this stochastic assessment
through Steps 2 and 3, the ENPC calculation would
involve the hydraulic simulation and damage assessment
of literally thousands of flood events. Although
potentially possible for simple (e.g. one-dimensional)
models, stochastic simulation of large or complicated
hydraulic models is impractical due to the time and
storage space required to process such a large number of
floods. The process can be simplified by assuming that:
Flood attributes required for calculating damage (e.g.
flood depth or time of inundation) within a defined
area can be directly related to one or two key flood
attributes (e.g. peak discharge and/or peak or
coincident level at a defined point)
Costs can be directly related to these attributes, and
The key flood characteristics can be provided directly
from the hydrologic model
These assumptions allow Steps 2 and 3 to be conducted
independently from the stochastic simulation. The
hydraulic and flood damage assessments can thus be
conducted for a range of flood events and used to generate
rating curves linking the flood characteristic to the
resulting damage. Once the flood characteristics for any
given flood event are known from the hydrologic
modelling, flood impact and damage can be determined
directly from the rating curve.
Calculation of damage ratings
In keeping with these assumptions, the Brisbane River
floodplain area was divided into sixteen zones controlled
by regions of hydraulic influence (e.g. downstream, at,
and upstream of each major confluence) and Local
Government Authority (for ease of reporting). Individual
ratings were developed for each of the zones to allow for
different flow conditions occurring within the catchment
for any particular event. Spatially distributed flood
damages (residential buildings, non-residential buildings
and transportation infrastructure) were assessed using an
array-based GIS integrated spatial modelling concept
utilising a combination of Excel based spreadsheet model
input/output and Python based modules. Python is an
open source programming language offering scripting
5. interfaces to various programs such as Microsoft Excel
and ArcGIS. It incorporates numerous packages for
specific aspects such the NumPy package for
comprehensive analysis of multi-dimensional arrays.
The GIS assessment combined spatial information for
buildings, roads, railways and other assets (such as size,
building type, ground and floor levels) with flood level
mapping and the stage damage functions discussed above
to determine flood damages for a wide range of flood
events, thus generating ratings providing a direct
relationship between flood magnitude and damage cost.
Typical damage ratings for a relatively urbanised zone are
shown in Figure 2. Transport infrastructure damages tend
to initiate earlier than residential and non-residential
property damages, but increase at a slower rate. This is
consistent with current design standards that typically
afford properties a higher immunity than roads, and
property damage being a function of inundation area and
depth (i.e. event magnitude) while transport infrastructure
is proportional to inundated length only. Property
damage increases rapidly once that immunity threshold is
breached.
Figure 2 Flow-damage ratings
Flood modelling for the study was based on flood level
surfaces from 2009 BCC flood modelling for Brisbane
River discharges ranging from 3,000 to 38,000 m³/s.
These surfaces were developed using a two-dimensional
TUFLOW model but have a limitation that each flood
surface produced by the modelling is from a single event
linked to a characteristic flow at Brisbane Port Office.
While inflows from major tributaries such as Lockyer
Creek and Bremer River are included, they cannot be
varied independent of the Brisbane River flow. The study
therefore identifies changes in areas dominated by
Brisbane River flood levels, but may over or
underestimate levels in the tributary floodplain depending
on the contribution of the tributary relative to the main
river. Updated flood modelling will shortly be
undertaken as part of the Brisbane River Catchment Flood
Study, which is being coordinated by the Department of
State Development, Infrastructure and Planning (DSDIP).
With sufficient variability in the tributary/river
combinations, a multi-dependent damage rating could
theoretically be developed to determine a flood surface,
and hence damage, resulting from two (or more)
characteristic flows or other attributes.
Impact ratings were also determined for each of the seven
low-immunity bridges. The impact cost for a flood event
is a function of the time of closure and the diversion time,
dependent on the availability of alternate routes. As
illustrated in Figure 3, this can lead to a multi-stage rating
as the likely amount of damage increases while alternate
diversion routes also become increasingly affected.
Closure times are a function of the flood duration above
the bridge deck level, and the time required to close,
clean, repair and reopen the bridge prior to and after the
flood, making the impact a multi-variate function
dependent on both the flood duration above a threshold
(time above deck level) and peak flow (damage caused by
the event).
Figure 3 Bridge closure flow-impact ratings
Brisbane River flows and damages
The Integrated Assessment of the Wivenhoe and
Somerset Dam operations used flows extracted from the
GoldSim-based WSDOS project Dam Optimisation
Model developed by Seqwater so as to represent the
variability inherent in the Brisbane River catchment and
influence of the dam operations. This model was set up to
simulate 48 historical rainfall events from the URBS
hydrologic model calibration, up to 80 conventional
design rainfall events and around 5000 synthetic
stochastic rainfall events with rainfall intensity ranging
from 2 year to 100,000 year ARI.
The stochastic events were based on analysis of radar
imaging of 8 historic Brisbane River catchment floods,
reinterpreted to provide 600 different synthetic rainfall
event distributions. These synthetic events were
developed by the Bureau of Meteorology and SKM and
were used to ‘stress test’ Wivenhoe Dam operations for a
wide variability of spatial and temporal distributions and
the resulting combinations of dam release with tributary
inflow in the river downstream of the dam. Due to this
variability, the rainfall probability does not directly
correlate to flood discharge probability. Results for each
event were accumulated and analysed using the Total
Probability Theorem (Nathan & Weinmann 2013) to
determine expected probability estimates for the flood
frequency curve, and subsequently for the damage
frequency curves used to estimate average annual
damages.
0 10000 20000 30000 40000
DamageCost($)
Brisbane River Flow (m³/s)
Residential
Non-Residential
Transport Infr.
0 2000 4000 6000
ImpactCost($)
Brisbane River Flow (m³/s)
CostandDelayfor
safety,cleaning&Repair
Flood
Closure
Increasing damage
to bridge
High submergence.
No further
damage increase
Bridge
closure
Closure of preferred
diversion route
6. Notably, the use of the stochastic rainfall events in the
hydrologic modelling had not previously been reconciled
to other analysis methods. Comparison of the TPT results
with current estimates of the flood frequency curve
obtained from statistical analysis of historical gauge data
identified a discrepancy. For the purposes of this study,
this was reconciled by adjusting the probability
increments used in the TPT assessment to make the
discharge (and consequently damage) consistent with the
stream gauge frequency analysis. It is acknowledged that
this is an approximation, and usage of the stochastic
events and stream gauge flood frequency estimates are
both currently being assessed as part of the Brisbane
River Catchment Flood Study. Using the simplified
damage methodology, flows output from the Seqwater
Dam Operations Model at key locations were combined
with the damage ratings to calculate damages within each
zone for each of the stochastic events. Total Probability
Theorem was then used to estimate the damage-frequency
curve, which could then be integrated to calculate the
average annual damage cost and subsequently the
expected net present cost. Figure 4 shows an indicative
calculation of residential flood damage, highlighting the
significant variation in damage costs possible for different
rainfall events of any theoretical magnitude.
Figure 4 TPT assessment of flood damage
Bulk water supply
Water supply in southeast Queensland is provided by a
number of reservoirs, of which the largest are Wivenhoe
(1165GL), Somerset (380GL) and North Pine (214GL).
Water allocation from the Central Brisbane River Water
Supply Scheme including Wivenhoe and Somerset dams
is around 279,000 ML/a. Water supply strategy requires
the provision of a certain level of service, the ability of
the bulk water system to provide water supply and meet
community needs, while also having the ability to
withstand drought conditions in order to satisfy this
criteria with a probability of failure that is acceptably
small. Any change to the supply capacity for south-east
Queensland therefore affects:
Bulk water infrastructure – planned infrastructure
requirements to provide the required level of service
into the future.
Water security – the robustness of the system to
maintain water supply during times of drought.
Bulk Water infrastructure
At the time that the IAM investigation was conducted,
southeast Queensland’s bulk water supply strategy was
based on a two-stage augmentation of the existing water
supply infrastructure with desalination plants rather than
construction of additional dams. Costs associated with
each augmentation stage include initial construction and
ongoing operational costs. These projected costs,
illustrated in Figure 5, can be discounted for the decreased
current value of future expenditure and accumulated to
give a present cost of the proposed future works.
Figure 5 Projected augmentation costs
Changes to the bulk water supply infrastructure affect the
water supply capacity, having a flow-on effect on the
timing of the proposed augmentation stages. Due to the
discount rate applied to future cash flow, short-term
works have much greater present value than long-term
works, and bring-forward of works increases the effective
present cost. The net cost (or benefit) of proposed
changes is the difference between the present costs of the
modified works and the original base-case strategy. The
timing of augmentation stages was assessed by Seqwater
for a range of combinations of Wivenhoe and North Pine
reservoir levels, resulting in revised augmentation dates
for each of the options, which were then used to calculate
the net present cost. As shown in Figure 6, moderate
reductions in Wivenhoe’s supply volume would result in
an approximately linear increase in cost, however
reductions greater than 20% begin to have a much more
significant impact.
Figure 6 Water infrastructure and security costs
Water Security
The southeast Queensland region depends on bulk water
storage, augmented by some manufactured water, to
provide water for residential, industrial and agricultural
use. A number of water storage thresholds have been
identified to ensure reliability of supply, each
0.00001 0.0001 0.001 0.01 0.1 1
ResidentialDamage($)
Event Probabilty
Adjusted TPT
Event damage
2019
2021
2023
2025
2027
2029
2031
2033
2035
2037
2039
2041
2043
2045
2047
2049
2051
2053
2055
2057
2059
Expenditure($M)
Discounted amount
Operating Costs
Stage 2 Capital
Stage 1 Capital
0% 10% 20% 30% 40%
NetPresentCost($M)
Total System Volume Reduction
Bulk Infrastructure.
Water Security
Area = Average Annual Damage
7. accompanied by a triggered response to augment the
available water supply. Current strategy is based around
three augmentation trigger thresholds (60%, 40% and
30% capacity) that sequentially trigger operation of the
Gold Coast Desalination Plant (GCDP) at full capacity,
operation of the Western Corridor Recycled Water
Scheme (WCRWS) at full capacity, and immediate
commencement of construction of drought response
infrastructure, assumed to be a new desalination plant
Water security costs were considered to consist of
production costs for the drought response manufactured
water and any associated infrastructure capital costs.
Production costs were based on annual operating costs for
the infrastructure provided by Seqwater and assumed that
the plant would remain active for two months longer than
the average duration that the water level remains below
the threshold. New drought response infrastructure is to
be constructed when combined capacity falls below 30%.
Effective cost of infrastructure is the bring-forward cost
of the next planned augmentation (i.e. the difference in
present cost between the triggered drought-response
construction and the planned construction).
The drought response plan includes imposition of water
restrictions when supply levels fall below a trigger
threshold, currently set at 40% combined capacity of key
water grid storages. There is little available information
on the actual costs to the community, industry and
government of the imposition of water restrictions as
many of these are indirect and potentially intangible,
including decreased production, inconvenience and loss
of amenity, compliance and enforcement. Studies have
indicated that water consumers are willing to pay
relatively little to avoid low-level restrictions, but much
greater amounts to ensure high-level restrictions are not
imposed or are imposed very rarely. It should be noted
that willingness-to-pay values are based on public
perception of cost and probabilities rather than a technical
assessment, and therefore do not necessarily correlate to
an actual impact cost. Nevertheless, the public perception
of restriction costs is approximately twice the operating
costs of the WCRWS and desalination plant.
Water balance modelling was undertaken by Seqwater to
determine the cumulative probability of reaching each
threshold level. The probability of falling below a
threshold (for the first time) was observed to be consistent
with a standard Gamma (or Pearson III) distribution.
Figure 7 shows the mean time to first falling below each
trigger threshold, and demonstrates the significant impact
of reducing the reservoir volume, particularly on the first
(60%) trigger which falls from 25 years to less than 5
years with a 34% reduction in storage volume. Note that
the relationship is not linear as volume reduction also
affects the timing of infrastructure augmentation as
discussed in the previous section.
The Gamma distribution relationship was used to estimate
the probability of reaching a threshold (either for the first
or subsequent times) in any year. Net present cost
attributable to providing water security could then be
calculated as the sum of the present cost of the
consequences of reaching a threshold in each year
multiplied by the probability of the threshold being
reached in that year. Figure 8 demonstrates the relative
contribution of each of the trigger threshold components
and the impact of reducing water storage volume. The
60% threshold incurs relatively minor costs (triggered
operation GCDP) but is triggered most frequently, and
therefore represents the largest single contribution, while
the 30% threshold triggering of infrastructure construction
is much rarer, but has significant cost implications.
Overall however, the water security costs are an order of
magnitude smaller than the impact on bulk water
infrastructure, shown in Figure 6 above.
Figure 7 Mean time to fall below trigger threshold
Figure 8 Water security costs
Integrated Assessment results
The integrated assessment combines the flood damages,
impacts, bulk water infrastructure and water security costs
to allow a balanced examination and comparison of the
performance of different operating scenarios. Results for
the Brisbane River floodplain downstream of Wivenhoe
are shown in Figure 9 for a number of typical scenarios:
0 Current operating strategy and full supply volume
A Alternate operating strategy, with earlier release to
provide greater mitigation for larger floods
0+L Current operating strategy with moderate lowering
of full supply volume
A+L Alternate operating strategy with moderate lowering
of full supply volume
NP North Pine Dam current strategy (not to scale,
shown for comparison only)
0
10
20
30
40
50
60
70
80
0% 10% 20% 30% 40%
MeanFirstOccurrence(Years)
Total System Volume Reduction
30% Threshold
40% Threshold
60% Threshold
0%
2%
7%
10%
12%
17%
20%
28%
34%
WaterSecurityNPC($)
Total System Volume Reduction
Water Restrictions
30% Infrastructure
30% Production
40% Production
60% Production
8. Note that these scenarios are provided for discussion
purposes and are not intended to represent the final or
preferred operating strategies.
Figure 9 Typical integrated assessment results
Magnitude of cost contributions to total cost
The total expected net present cost is comprised of
numerous contributing factors. For the Brisbane River
floodplain, which affects the cities of Brisbane and
Ipswich as well as a number of smaller rural communities,
the largest single contributor is residential property
damage. It is nevertheless worth noting that the higher
frequency of transport infrastructure inundation still
represents a significant contribution (25% to 40% of
residential damage) despite having damage costs that are
over an order of magnitude smaller during large floods as
demonstrated back in Figure 2. Conversely, assessed
bridge closure impacts are comparatively small despite
having low immunity due to relatively light traffic
volumes and availability of alternate routes.
It must be cautioned that the relative contribution of these
factors is highly dependent on the location, and the
balance could be quite different if any one sub-area was
investigated. As an extreme example, the area
downstream of North Pine Dam has few flood prone
houses but an active and highly flood prone causeway
(Young’s Crossing). Application of the integrated
assessment methodology to the NPDOS project identified
very minor property damage, moderate transport
infrastructure damage and high traffic interruption costs
(note that scale of North Pine results in Figure 9 is
intended to highlight relative proportions of each cost
component, not the comparative magnitude of North Pine
and Wivenhoe costs).
Impact of modifying flood release operations
WSDOS and the IAM were used to investigate a range of
alternative operating strategies for Wivenhoe Dam. These
strategies control when and how the available flood
storage volume is used. A number of the strategies, such
as Strategy ‘A’ shown in Figure 9, modified the release
triggers to discharge more flow earlier in a flood event to
leave more volume available for later mitigation should
the flood grow larger. Alternatively, a strategy could hold
back early flood waters, thus potentially minimising the
impact if the rain stops, but also consuming storage and
thus reducing attenuation if the flood continues to grow.
The overall benefit of any strategy is therefore dependent
on whether the potential benefits outweigh the potential
costs. The IAM provides a means to conduct a balanced
assessment of these costs and benefits. In the provided
example, the IAM demonstrates that Strategy ‘A’ would
accomplish the desired objective of reducing property
damages (compared to the current operating strategy),
which generally occur during moderate to major flood
events. The consequence of this strategy, however, would
be increased severity and frequency of minor ‘rural’
releases leading to increased inundation and damage to
roads and bridges as well as other impacts (e.g. disruption
to ferry services). The IAM indicates that these costs
actually outweigh the benefit of reduced property damage,
leading to this particular strategy having an overall net
cost rather than a benefit.
Impact of modifying dam levels
Modifying dam full supply levels is a highly contentious
option for many reasons, including a high degree of (often
uninformed) public and political opinion, potential risk
(discussed further in Limitations below) and requiring a
comparison of elements that are not just dissimilar, but
also actively compete against each other.
Lowering the dam level provides additional storage for
mitigation without forcing a compromise between how
and when flood flows are released. The compromise
however comes between availability of mitigation during
times of flood and of bulk water during times of drought.
The IAM provides a means of weighting and assessing
these conflicting issues. The example shown in Figure 9
demonstrates that, with current release strategy, a
moderate reduction in Wivenhoe storage volume produces
an evident reduction in all forms of flood damage (around
15% for the case shown). However, there is a
corresponding increase in bulk infrastructure and security
costs. In this case, the cost is of similar order of
magnitude to benefit, such that the net benefit of the
strategy is in fact less than 1.5%.
As identified in the sections above, the larger the
reduction in supply volume, the more rapidly the bulk
water costs increase. Therefore a larger reduction in
water storage would produce a net cost rather than
benefit. The cost reduction resulting from lowering
supply volume is also dependent on the dam operating
scenario. Operating Scenario ‘A’ demonstrates less
benefit than the current operations for the same reduction
in volume, to the point that storage reduction is actually
counter-productive. This relationship was also observed
for some operating scenarios that did initially reduce total
flood damage costs (i.e. adopting the operating scenario
would produce a net benefit, but that scenario plus
volume reduction would produce a smaller benefit or even
a net cost).
Limitations and future work
The Integrated Assessment Methodology has a number of
significant limitations. The result is obviously dependent
on the quality/reliability of the all the data (rainfall,
hydrologic routing, flood modelling, GIS information,
stage-damage relationships etc.) and the validity of the
simplifying assumptions allowing use of damage ratings
0 A 0+L A+L
ENPC($)
Water Security
Water Infrastructure
Other Flood Damage
Bridge Closure Impact
Transport Infr. Damage
Non-Res. Damage
Residential Damage
NP(NotToScale)
9. (considered reasonable for much of the main river reaches
but uncertain in co-dependent areas such as junctions).
Another obvious limitation is that it can only assess and
compare things to which a cost can be assigned. Direct
tangible damages generally fit well into this category, but
intangible damages are much harder to quantify. There
are also still a wide range of tangible damages, direct or
indirect, for which there are currently insufficient data or
understanding to form the necessary defined relationships
between flood, cause, impact and cost required for
inclusion in cost assessment (e.g. bank slumping, erosion,
and flora and fauna impacts).
The IAM is dependent on flows (and other characteristics)
produced by the Seqwater WSDOS assessment. This
assessment did not consider dam failure, whether as a
result of dam overtopping or some other mechanism. The
focus of the study was on dam storage and operation
strategies affecting rural and urban flood mitigation.
During extreme events, the dam operating strategy
changes from flood mitigation to dam safety. For most
scenarios this strategy remained relatively unchanged, and
the probability and consequences of failure should
therefore be virtually identical for most of the examined
options and thus have little influence on the study
conclusions. A limited number of the examined strategies
considered raising the dam safety trigger threshold, and it
is acknowledged in both the IAM and this paper that a full
failure impact assessment would be required to assess the
probability and consequences of such a change.
The methodology used for the IAM currently assesses
flood damages and impacts for discrete flood events.
Despite their rarity, flood events can (and do) occur in
close succession. Two of the largest flood events in
Brisbane’s flood history occurred within 3 weeks of each
other on 29 January and 15 February 1893. Although the
probabilistic weighting theoretically accounts for this
occurrence, the cumulative impacts of successive events
are not considered, and costs may be underestimated (e.g.
if Wivenhoe’s fuse-plug spillways are failed by the first
event, limiting the ability of the dam to mitigate even
minor follow-up flooding) or overestimated (unrepaired
damages would be double-counted). Additionally, the
Seqwater stochastic WSDOS assessment (and hence the
IAM) currently assumes that the dams are at full supply
level for each of the events. This is not necessarily
unrealistic, as major flood events are known to usually
occur during wet periods and dams are more likely to be
at or near full level, however minor events still contribute
to the cumulative AAD and NPC. This could tend to
overestimate flood damages, and hence the benefit of any
flood reduction, thus making the scenario seem more
favourable, or bias the damage estimates and perceived
cost/benefit of scenarios that preferentially mitigate minor
at the expense of major floods or vice versa. Pre-flood
conditions such as starting reservoir level and fuse plug
condition could be included as variables in the stochastic
assessment. The Brisbane River Catchment Flood Study
is currently investigating some of these relationships.
Ultimately, any change carries a risk, as whether the next
‘crisis’ will be flood or drought cannot be reliably
predicted. The IAM, which works with averaged values,
can identify strategies that should see a benefit on
average, but it cannot guarantee that any benefit will be
realised. The cost/benefit analysis may recommend a
reduction in dam volume only for the region to head into
a prolonged period of drought, or vice versa. The IAM
can be used to assess the odds, but not the outcome.
The Bureau of Meteorology publishes short-term rainfall
predictions prior to and during storm events and long-
term seasonal outlooks based on prevailing climactic
conditions. These are highly qualified as estimates and
are provided for risk awareness, but currently have no
defined place in operational procedures. The use of
seasonal outlooks in setting operational strategies (e.g.
temporary lowering of supply levels) is intuitively valid
but currently unquantified by systematic study. Similarly,
a fixed flood release strategy does not achieve the best
outcome for all floods, however tailoring of the operating
strategy to specific events would require foreknowledge
prior to and during the flood event. While short and long-
term forecasts are available, in both these cases the
uncertainty means that an improved outcome cannot be
guaranteed and use could even result in a worse outcome,
such as unnecessary downstream flooding, risk to water
security, and risk of dam failure. Nevertheless, the use of
seasonal outlooks and quantifiable precipitation forecasts
for use in the strategic operation of the dams could
potentially improve the odds. There is currently no
documented evidence to either support or oppose the use
of forecast information, although it is understood that this
is currently being investigated by Seqwater in association
with BoM. The Integrated Assessment Methodology
would provide a consistent method for assessing the
potential costs and benefits of such strategic operations.
Conclusions
Wivenhoe Dam on the Brisbane River was designed to
serve several purposes including the storage and supply of
water to southeast Queensland and flood mitigation to
protect the cities of Brisbane and Ipswich. A limitation of
multi-purpose dams is that they require trade-off between
those purposes. In response to the Millennium Drought
followed by devastating floods of 2011, the State of
Queensland initiated a comprehensive review of the
operation of the flood mitigation dams located in
southeast Queensland. As part of this work, Aurecon was
commissioned to develop an Integrated Assessment
Methodology to provide a balanced assessment of various
competing factors affecting dam operations in order to
make an informed decision. The methodology assessed
the primary variables of flood damage and other impacts,
future bulk water infrastructure and water security
requirements in the form of a net present cost or benefit.
Flood damages and impacts occur in many forms, often
categorised into direct or indirect depending on whether
the impact is caused directly by the flood water, and
tangible or intangible depending on whether the impact is
physically ‘real’. Direct tangible damages are the easiest
to quantify. The three most common types for which
accepted generic flood damage relationships are available
are residential and non-residential properties and transport
infrastructure. Analysis of costs associated with the 2011
and 2013 Brisbane River floods provided limited data for
other damage types.
10. Reduction in dam full supply volume is often suggested
as a means for improving mitigation and reducing flood
damage costs. The other side of the flood damage versus
bulk water supply trade-off is represented by cost of water
infrastructure requirements (to provide required level of
service into the future) and water security (to withstand
periods of drought), which are adversely impacted by
reduction in water supply volume. The Integrated
Assessment Methodology was used to test a range of
scenarios affecting flood operations and supply volume of
Wivenhoe Dam by assessing the net impact on these
factors.
Changes to the dam flood operations strategy modify how
and when flood inflow is released, potentially releasing
flows earlier to improve later mitigation of larger floods
or withholding flows to mitigate smaller events. In most
cases, improving mitigation during larger floods reduces
likely property damage, but at the expense of more
frequent damage to transportation infrastructure which
tends to have lower immunity and be affected by smaller
floods (or vice versa). The overall benefit was usually
marginal or even a slight cost. Greatest benefit was
observed for strategies that increased the dam safety
trigger levels (the level at which dam operations switch
from flood mitigation to dam safety concerns), thereby
reducing flood damage but at increased risk of breaching
the fuse-plugs or even failing the dam. The IAM did not
fully assess these risks and a full dam safety/failure
assessment would be required to quantify the risks and
consequences. Reduction in dam full supply volume
reduces damage but increases future bulk water
infrastructure and water security costs. Minor to
moderate reduction could offer some benefit, but again
the net benefit tends to be very marginal.
This paper presents a general methodology and possible
outcomes rather than specific results. The reader is
referred to DEWS (2014) for more specific details.
Realistically, any decision to modify dam operating
strategy or full supply volume is a gamble as to whether
the next crisis will be a minor or major flood or a drought.
The IAM provides a means to skew the odds of a
successful decision in the decision maker’s favour, but
cannot guarantee a successful outcome. As an outcome
of the WSDOS/IAM assessment, the Queensland
government is currently investigating potential locations
for new water supply reservoirs to allow Wivenhoe levels
to be reduced without the impact on future water
infrastructure and security. It is anticipated that a similar
holistic approach will assist in the cost-benefit analysis of
these options.
Acknowledgements
The authors would like to thank the Department of
Energy and Water Supply (QLD) and Seqwater for their
permission to publish this paper, as well as the support of
Seqwater, Department of Transport and Main Roads
(QLD), Department of Natural Resources and Mines
(QLD), Brisbane City Council and Ipswich City Council
in providing hydrologic, GIS, flood damage and other
information used in the IAM.
References
Aurecon Australasia 2014. WSDOS/NPDOS Integrated
Assessment – WSDOS Assessment Results. QLD
Department of Energy and Water Supply
Dale, K.; Edwards, M.; Middelman, M.; Zoppou, C. 2004
Structural flood vulnerability and the Australianisation of
Black’s curves. Risk 2004 Conference Proceedings, Risk
Engineering Society, Melbourne
Department of Energy and Water Supply (QLD) 2014
Wivenhoe and Somerset Dams Optimisation Study
Report
Department of Natural Resources and Mines (QLD) 2002.
Guidance on the Assessment of Tangible Flood Damages
Greenaway, M.A.; Smith, D.I. 1983. ANUFLOOD Field
Guide. Centre for Resource and Environmental Studies,
Australian National University, Canberra
Kellogg Brown & Root 2011. Goodna & Booval
Catchments Flood Risk Management Plans Estimation of
Flooding Stage-Damage Relationships. Ipswich City
Council
Nathan, R.; Weinmann, E. 2013. Monte Carlo Simulation
Techniques. Discussion Paper, Australian Rainfall &
Runoff, Engineers Australia
Rolfe, J.: Gowen, R.: Kinnear, S.: Flint, N.; Liu, W. 2011.
Assessing the regional economic impacts of flood
interruption to transport corridors in Rockhampton. CQ
University of Australia
O2 Environmental 2012. Rosewood Catchments Flood
Study and Flood Risk Management Study, Draft Final
Report. Ipswich City Council
WRM Water & Environment 2006. Brisbane Valley
Flood Damage minimisation Study – Brisbane City Flood
Damage Assessment. Brisbane City Council - City Design