Weekly Market Report
•
0 gefällt mir•479 views

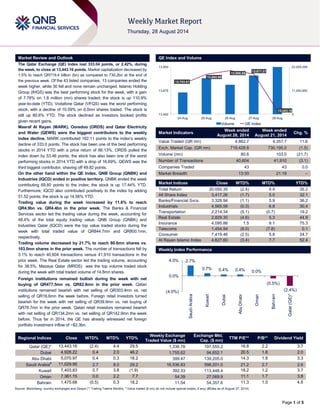
The QE Index lost 2.42% over the week to close at 13,443.16 points. Market capitalization decreased by 1.5% to QR719.4 billion. Three stocks, Masraf Al Rayan, Ooredoo, and Qatar Electricity and Water, were the biggest contributors to the weekly index decline. Trading value increased by 11.6% while trading volume decreased by 21.7%. Foreign institutions remained bullish while Qatari and foreign retail investors remained bearish.

Empfohlen
Weitere ähnliche Inhalte
Was ist angesagt?
Was ist angesagt? (20)
Andere mochten auch
Andere mochten auch (11)
Ähnlich wie Weekly Market Report
Ähnlich wie Weekly Market Report (20)
Mehr von QNB Group
Mehr von QNB Group (20)
Kürzlich hochgeladen
Kürzlich hochgeladen (20)
Weekly Market Report
- 1. Page 1 of 5 Market Review and Outlook QE Index and Volume The Qatar Exchange (QE) Index lost 333.04 points, or 2.42%, during the week, to close at 13,443.16 points. Market capitalization decreased by 1.5% to reach QR719.4 billion (bn) as compared to 730.2bn at the end of the previous week. Of the 43 listed companies, 13 companies ended the week higher, while 30 fell and none remain unchanged. Islamic Holding Group (IHGS) was the best performing stock for the week, with a gain of 7.78% on 1.8 million (mn) shares traded; the stock is up 110.9% year-to-date (YTD). Vodafone Qatar (VFQS) was the worst performing stock, with a decline of 10.59% on 6.0mn shares traded. The stock is still up 80.6% YTD. The stock declined as investors booked profits given recent gains. Masraf Al Rayan (MARK), Ooredoo (ORDS) and Qatar Electricity and Water (QEWS) were the biggest contributors to the weekly index decline. MARK contributed 162.11 points to the index’s weekly decline of 333.0 points. The stock has been one of the best performing stocks in 2014 YTD with a price return of 66.13%. ORDS pulled the index down by 53.46 points; the stock has also been one of the worst performing stocks in 2014 YTD with a drop of 16.69%. QEWS was the third biggest contributor, shaving off 49.82 points. On the other hand within the QE Index, QNB Group (QNBK) and Industries (IQCD) ended in positive territory. QNBK ended the week contributing 69.80 points to the index; the stock is up 17.44% YTD. Furthermore, IQCD also contributed positively to the index by adding 51.52 points; the stock is up 14.56% YTD. Trading value during the week increased by 11.6% to reach QR4.9bn vs. QR4.4bn in the prior week. The Banks & Financial Services sector led the trading value during the week, accounting for 48.4% of the total equity trading value. QNB Group (QNBK) and Industries Qatar (IQCD) were the top value traded stocks during the week with total traded value of QR844.7mn and QR800.1mn, respectively. Trading volume decreased by 21.7% to reach 80.6mn shares vs. 103.0mn shares in the prior week. The number of transactions fell by 3.1% to reach 40,604 transactions versus 41,910 transactions in the prior week. The Real Estate sector led the trading volume, accounting for 38.5%. Mazaya Qatar (MRDS) was the top volume traded stock during the week with total traded volume of 14.8mn shares. Foreign institutions remained bullish during the week with net buying of QR477.5mn vs. QR82.8mn in the prior week. Qatari institutions remained bearish with net selling of QR303.4mn vs. net selling of QR16.6mn the week before. Foreign retail investors turned bearish for the week with net selling of QR39.9mn vs. net buying of QR76.7mn in the prior week. Qatari retail investors remained bearish with net selling of QR134.2mn vs. net selling of QR142.9mn the week before. Thus far in 2014, the QE has already witnessed net foreign portfolio investment inflow of ~$2.3bn. Market Indicators Week ended August 28, 2014 Week ended August 21, 2014 Chg. % Value Traded (QR mn) 4,862.7 4,357.7 11.6 Exch. Market Cap. (QR mn) 719,428.8 730,195.0 (1.5) Volume (mn) 80.6 103.0 (21.7) Number of Transactions 40,604 41,910 (3.1) Companies Traded 43 43 0.0 Market Breadth 13:30 21:18 – Market Indices Close WTD% MTD% YTD% Total Return 20,050.35 (2.4) 4.4 35.2 All Share Index 3,417.26 (1.7) 5.0 32.1 Banks/Financial Svcs. 3,328.94 (1.1) 5.9 36.2 Industrials 4,565.56 (0.3) 6.8 30.4 Transportation 2,214.34 (5.1) (0.7) 19.2 Real Estate 2,829.30 (4.6) 5.3 44.9 Insurance 4,095.86 1.5 9.1 75.3 Telecoms 1,454.94 (8.0) (7.8) 0.1 Consumer 7,419.46 (2.5) 5.8 24.7 Al Rayan Islamic Index 4,627.60 (3.4) 7.7 52.4 Market Indices Weekly Index Performance Regional Indices Close WTD% MTD% YTD% Weekly Exchange Traded Value ($ mn) Exchange Mkt. Cap. ($ mn) TTM P/E** P/B** Dividend Yield Qatar (QE)* 13,443.16 (2.4) 4.4 29.5 1,336.78 197,555.2 16.8 2.2 3.7 Dubai 4,928.22 0.4 2.0 46.2 1,755.62 94,652.1 20.5 1.8 2.0 Abu Dhabi 5,070.97 0.4 0.3 18.2 399.47 139,205.0 14.3 1.8 3.3 Saudi Arabia# 11,029.95 2.7 8.0 29.2 16,536.83 598,201.0 21.2 2.7 2.6 Kuwait 7,403.83 0.7 3.8 (1.9) 392.33 113,448.4 18.2 1.2 3.7 Oman 7,361.15 0.0 2.2 7.7 54.39 27,069.9 11.1 1.7 3.8 Bahrain 1,475.68 (0.5) 0.3 18.2 11.54 54,357.6 11.3 1.0 4.6 Source: Bloomberg, country exchanges and Zawya (** Trailing Twelve Months; * Value traded ($ mn) do not include special trades, if any) (#Data as of August 27, 2014) 13,753.51 13,865.89 13,906.56 13,871.21 13,443.16 0 11,000,000 22,000,000 13,400 13,675 13,950 24-Aug 25-Aug 26-Aug 27-Aug 28-Aug Volume QE Index 2.7% 0.7% 0.4% 0.4% 0.0% (0.5%) (4.0%) (2.4%) 0.0% 4.0% Saudi Arabia Kuwait Dubai Abu Dhabi Oman Bahrain Qatar (QE)*
- 2. Page 2 of 5 News Economic News New Port set to be operational by 2016-end – The first phase of the QR27bn worth new port project is set to be operational by 2016-end with an initial capacity to accommodate 2mn containers. The port would accommodate 4mn containers in 2018 and 6mn containers when completed in 2020. HE the Prime Minister and Interior Minister Sheikh Abdullah bin Nasser bin Khalifa Al-Thani attended a ceremony marking the final step of building the wall of the new port’s basin in northern Mesaieed’s industrial zone. Officials briefed the Premier on the progress of construction work of the 26 square kilometer project. The new port has divisions like the economic zone, the commercial port and the naval base. The port’s first phase is set to be completed by the end of December 2016. The Prime Minister while expressing his happiness over the work progressing as per the timeframe set by the government voiced his optimism that the project would conclude ahead of schedule. HE the Minister of Transport Jassim Seif Ahmed Al Sulaiti said that the project was progressing ahead of schedule and that the port’s full operation was pushed forward by 10 years from 2030 to 2020. (Gulf-Times.com) MDPS: Qatar trade surplus touches QR33.2bn in July – Qatar’s trade balance showed a surplus of QR33.2bn, an increase of QR0.3bn (0.8%) in July 2014 on a YoY basis. According to preliminary figures released by the Ministry of Development Planning & Statistics (MDPS), the total exports of goods (including exports of domestic origin and re-exports) amounted to QR41.5bn in July, showing an increase of 0.6% YoY as compared to July 2013. On the other hand, the imports of goods in July amounted to QR8.3bn, a decrease of 0.3% YoY over the value recorded in July 2013. The YoY rise in total exports was mainly due to higher exports of Petroleum gases and other gaseous hydrocarbons (LNG, condensates, propane, butane, etc.) which reached QR26.0bn in July, reflecting an increase of 1.2% YoY, and Petroleum oils & oils from bituminous minerals (not crude) reached QR2.5bn (4.3% YoY). However, the increase was partially offset by the drop in exports of Petroleum oils & oils from bituminous minerals (crude), which reached QR7.0bn (-13.8% YoY). The major destinations for Qatar’s exports in July 2014 were Japan with QR10.9bn, a share of 26.2% of the total exports, South Korea with QR6.6bn (15.9% share), and India with QR5.1bn (12.3% share). Motor cars & other passenger vehicles were at the top of the imported group of commodities, with QR 0.7bn in July 2014, showing an increase of 2.1% YoY. (Peninsula Qatar) MDPS: Monthly industrial PPI rises by 4.1% in June – Higher prices for crude, natural gas, basic chemicals and refined petroleum goods led a 4.1% YoY rise in Qatar’s Producer Price Index (PPI) in June 2014. The Ministry of Development Planning & Statistics (MDPS) released the PPI for the industrial sector, which measures average changes in prices received by domestic producers for their output. The PPI for mining (carries a weight of 77% in the PPI basket), surged 4.2% in June due to a 4.2% increase in the price of crude petroleum and natural gas and 1% in stone, sand and clay. The manufacturing sector, (21% weight), reported 3.9% rise in June, driven by a 9.2% increase in the price of basic chemicals, 2.5% in refined petroleum products, 1.3% in grain mill & other products and 1.1% in cement & other non-metallic products. However, beverages prices fell 3.2% and dairy products by 1.4%. The electricity & water group, which has a 2% weight in the PPI basket, saw its index shrink 3.3% in June. Water and electricity prices fell 4.1% and 1.8%, respectively. (Gulf- Times.com) Market & Corporate News QE set to see listings of GCC and MENA companies – Companies from the GCC as well as the MENA region may list their stocks on the Qatar Exchange (QE) putting in place an appropriate environment to attract global fund managers and encourage local savings & investments. During the third phase of development, the QE could see the IPOs from the GCC/MENA region and their listings. According to sources, the dual listings of products and companies are also on the anvil. The exchange has embarked on a three-phase development program to make it an attractive investment destination and since then has initiated major reforms, which include the introduction of delivery-versus-payment in the first phase, which is expected to be completed soon. Moreover, the exchange is all geared up to introduce securities lending and borrowing, margin trading, omnibus accounts and a central counterparty as part of its measures to further enhance operational efficiency and attract foreign investors. The proposed three-layered investor structure – Qatari, regional and foreign, may also lend tacit strength and support to the proposed move to allow GCC and MENA companies to list their stocks on the QE. (Gulf- Times.com) UDCD renews $210mn credit facility agreement with banks – United Development Company (UDCD) announced the renewal of a $210mn credit facility agreement with a group of banks through its agent the Commercial Bank of Qatar (CBQK), and authorizing its Managing Director to implement the necessary procedure for that purpose. The agreement has been renewed for another three years. (Bloomberg) GWCS launches phase 4 operations at Logistics Village – Gulf Warehousing Company (GWCS) announced the launch of operations at its Phase 4 expansion in the Logistics Village in Qatar. This expansion has added 81 thousand square meters of storage and distribution infrastructure to the facility. The company stated that these facilities and logistics structures is available to the public from August 26, 2014. It must be noted that the majority of the available spaces at the Phase 4 expansion has been reserved by GWCS’ current client base. (QE) MERS to open 9 new outlets – Al Meera Consumer Goods Company’s (MERS) Deputy CEO Dr. Mohammed Nasser Al Qahtani stated that the company is working at full capacity to complete a workshop on building new complexes with the advent of 4Q2014 and intends to open 9 new branches after obtaining the required approvals from the competent authorities. Dr. Al-Qahtani said that the new branches will be opened in Al-Wakra, Al-Thumamah, Al-Wajbah, Muaither, Al- Aziziyah, Al-Zakhira, Al-Mereikh and Jaryan Nijaimah. In addition, a branch will be rented at the Gulf Mall, which will open soon. (Bloomberg) AM Best assigns rating to DOHI – Doha Insurance Company’s (DOHI) Chairman HE Sheikh Nawaf Bin Nasser Bin Khaled Al-Thani announced that AM Best Rating Services Limited has assigned a financial strength rating of A- (Excellent) and an issuer credit rating of “a-” to DOHI. The outlook assigned to both ratings is stable. He added that this new rating achieved reflects DOHI’s robust risk-adjusted capitalization, good operating performance and strong position within the Qatari insurance market. He noted that Standard & Poor’s (S&P) Rating Services announced recently that it had raised DOHI’s rating to A- with stable outlook. (QE)
- 3. Page 3 of 5 Qatar Exchange Top 5 Gainers Top 5 Decliners Source: Qatar Exchange (QE) Source: Qatar Exchange (QE) Most Active Shares by Value (QR Million) Most Active Shares by Volume (Million) Source: Qatar Exchange (QE) Source: Qatar Exchange (QE) Investor Trading Percentage to Total Value Traded Net Traded Value by Nationality (QR Million) Source: Qatar Exchange (QE) Source: Qatar Exchange (QE) 7.8% 4.1% 3.9% 3.7% 2.9% 0.0% 3.0% 6.0% 9.0% Islamic Holding Group Dlala Holding QNB Group Qatar Insurance Industries Qatar -10.6% -9.4% -8.6% -7.8% -7.0% -12.0% -8.0% -4.0% 0.0% Vodafone Qatar Masraf Al Rayan Qatar Electricity and Water Milaha Ooredoo 844.7 800.1 401.0 391.0 371.7 0.0 300.0 600.0 900.0 QNB Group Industries Qatar Masraf Al Rayan Qatar International Islamic Bank Mazaya Qatar 14.8 7.4 7.1 6.0 4.3 0.0 5.0 10.0 15.0 Mazaya Qatar Ezdan Real Estate Masraf Al Rayan Vodafone Qatar Qatar International Islamic Bank 0% 20% 40% 60% 80% 100% Buy Sell 35.11% 37.87% 15.00% 21.24% 10.22% 11.04% 39.67% 29.85% Qatari Individuals Qatari Institutions Non-Qatari Individuals Non-Qatari Institutions 2,184 2,174 2,576 1,782 (392) 392 (1,000) (500) - 500 1,000 1,500 2,000 2,500 3,000 Qatari Non-Qatari Net Investment Total Sold Total Bought
- 4. Page 4 of 5 TECHNICAL ANALYSIS OF THE QE INDEX Source: Bloomberg The QE Index snapped its three-week winning streak and ended on a bearish note. The index after recording a new all-time high of 13,993.34 on Wednesday, witnessed a sharp decline especially in the closing auction on Thursday as sustained selling pressure pulled the index below the 13,450.0 level. Moreover, the index penetrated below many important psychological levels along with the strong ascending trendline support, which is a warning signal for a potential reversal. This has changed the underlying sentiment of the index, which has been bullish till now. Meanwhile, the index has an immediate support of the 21-day moving average (currently at 13,411.89). Any retreat below the 21-day moving average may clearly signify that the index may be due for further correction and move lower to test the 13,350.0 level. Traders may need to keep a close watch on 13,350.0 as any sustained weakness below this level may lead to a decline toward 13,200.0. On the flip side, the index needs to move above 13,600.0 for the bulls to come back in action. Meanwhile, the RSI has shown a negative divergence, while the MACD is about to cross the signal line into the negative territory, implying a further retracement. DEFINITIONS OF KEY TERMS USED IN TECHNICAL ANALYSIS RSI (Relative Strength Index) indicator – RSI is a momentum oscillator that measures the speed and change of price movements. The RSI oscillates between 0 to 100. The index is deemed to be overbought once the RSI approaches the 70 level, indicating that a correction is likely. On the other hand, if the RSI approaches 30, it is an indication that the index may be getting oversold and therefore likely to bounce back. MACD (Moving Average Convergence Divergence) indicator – The indicator consists of the MACD line and a signal line. The divergence or the convergence of the MACD line with the signal line indicates the strength in the momentum during the uptrend or downtrend, as the case may be. When the MACD crosses the signal line from below and trades above it, it gives a positive indication. The reverse is the situation for a bearish trend. Candlestick chart – A candlestick chart is a price chart that displays the high, low, open, and close for a security. The ‘body’ of the chart is portion between the open and close price, while the high and low intraday movements form the ‘shadow’. The candlestick may represent any time frame. We use a one-day candlestick chart (every candlestick represents one trading day) in our analysis. Doji candlestick pattern – A Doji candlestick is formed when a security's open and close are practically equal. The pattern indicates indecisiveness, and based on preceding price actions and future confirmation, may indicate a bullish or bearish trend reversal. Shooting Star/Inverted Hammer candlestick patterns – These candlestick patterns have a small real body (open price and close price are near to each other), and a long upper shadow (large intraday movement on the upside). The Shooting Star is a bearish reversal pattern that forms after a rally. The Inverted Hammer looks exactly like a Shooting Star, but forms after a downtrend. Inverted Hammers represent a potential bullish trend reversal.
- 5. Contacts Saugata Sarkar Abdullah Amin, CFA Shahan Keushgerian Head of Research Senior Research Analyst Senior Research Analyst Tel: (+974) 4476 6534 Tel: (+974) 4476 6569 Tel: (+974) 4476 6509 saugata.sarkar@qnbfs.com.qa abdullah.amin@qnbfs.com.qa shahan.keushgerian@qnbfs.com.qa Sahbi Kasraoui Ahmed Al-Khoudary QNB Financial Services SPC Manager – HNWI Head of Sales Trading – Institutional Contact Center: (+974) 4476 6666 Tel: (+974) 4476 6544 Tel: (+974) 4476 6548 PO Box 24025 sahbi.alkasraoui@qnbfs.com.qa ahmed.alkhoudary@qnbfs.com.qa Doha, Qatar DISCLAIMER: This publication has been prepared by QNB Financial Services SPC (“QNBFS”) a wholly-owned subsidiary of Qatar National Bank (“QNB”). QNBFS is regulated by the Qatar Financial Markets Authority and the Qatar Exchange; QNB is regulated by the Qatar Central Bank. This publication expresses the views and opinions of QNBFS at a given time only. It is not an offer, promotion or recommendation to buy or sell securities or other investments, nor is it intended to constitute legal, tax, accounting, or financial advice. We therefore strongly advise potential investors to seek independent professional advice before making any investment decision. Although the information in this report has been obtained from sources that QNBFS believes to be reliable, we have not independently verified such information and it may not be accurate or complete. While this publication has been prepared with the utmost degree of care by our analysts, QNBFS does not make any representations warranties as to the accuracy and completeness of the information it may contain, and declines any liability in that respect. QNBFS reserves the right to amend the views and opinions expressed in this publication at any time. It may also express viewpoints or make investment decisions that differ significantly from, or even contradict, the views and opinions included in this report. COPYRIGHT: No part of this document may be reproduced without the explicit written permission of QNBFS. Page 5 of 5 Source: Bloomberg Company NamePrice(August 28) % Change 5-Day% Change YTDMarket Cap. QR MillionTTM P/EP/BDiv. YieldQatar National Bank202.003.8617.44141,345 14.42.73.5Qatar Islamic Bank119.00(3.88)72.4628,119 19.82.43.4Commercial Bank of Qatar68.100.8915.4220,221 12.61.22.4Doha Bank61.000.334.8115,761 11.01.47.4Al Ahli Bank53.001.7325.278,755 15.72.3N/AQatar International Islamic Bank87.400.6941.6513,230 16.82.64.3Masraf Al Rayan52.00(9.41)66.1339,000 21.83.82.9Al Khaliji Bank21.70(2.16)8.557,812 15.01.44.6National Leasing28.25(2.08)(6.30)1,398 33.61.15.3Dlala Holding63.004.13185.071,399 17.85.1N/AQatar & Oman Investment17.11(2.23)36.66539 21.91.63.5Islamic Holding Group97.007.78110.87388 31.96.51.8Banking and Financial Services277,967 Zad Holding90.00(1.64)29.501,177 10.81.53.9Qatar German Co. for Medical Devices13.71(1.86)(1.01)158 N/M0.9N/ASalam International Investment19.71(5.24)51.502,253 15.71.45.1Medicare Group129.00(6.52)145.713,631 29.04.51.4Qatar Cinema & Film Distribution50.00(3.47)24.69285 24.42.1N/AQatar Fuel220.00(1.48)0.6718,581 15.63.03.5Qatar Meat and Livestock60.80(0.16)17.601,094 19.54.43.5Al Meera Consumer Goods187.20(1.47)40.443,744 14.52.94.3Consumer Goods and Services30,924 Qatar Industrial Manufacturing46.900.7511.232,229 11.01.5N/AQatar National Cement143.00(0.69)20.177,021 16.02.84.2Industries Qatar193.502.9314.56117,068 18.73.95.7Qatari Investors Group59.00(0.84)35.017,335 32.13.41.3Qatar Electricity and Water171.00(8.56)3.4118,810 12.93.24.0Mannai Corp.112.000.2724.585,109 9.12.64.9Aamal16.29(0.67)8.609,774 18.31.4N/AGulf International Services117.20(3.54)140.1621,781 25.76.71.4Mesaieed Petrochemical Holding33.45(2.48)N/A42,024 N/A3.11.0Industrials231,151 Qatar Insurance100.003.7387.9716,054 16.43.02.0Doha Insurance30.25(5.76)21.001,513 10.51.56.6Qatar General Insurance & Reinsurance46.00(2.13)15.243,182 2.20.72.7Al Khaleej Takaful Insurance47.00(3.49)67.401,043 12.21.6N/AQatar Islamic Insurance86.00(4.44)48.531,290 15.44.54.4Insurance23,082 United Development29.15(2.35)35.3710,322 20.81.03.3Barwa Real Estate39.10(6.90)31.2115,215 11.71.15.1Ezdan Real Estate18.70(5.41)10.0049,602 38.41.71.7Mazaya Qatar Real Estate Development24.501.24119.142,450 13.72.13.1Real Estate77,588 Qatar Telecom114.30(7.00)(16.69)36,613 14.61.53.5Vodafone Qatar19.34(10.59)80.5816,350 N/M2.80.9Telecoms52,963 Qatar Navigation (Milaha)89.00(7.77)7.2310,193 11.30.85.6Gulf Warehousing50.501.0021.692,402 20.53.03.0Qatar Gas Transport (Nakilat)23.50(4.24)16.0513,160 16.03.54.7Transportation25,755 Qatar Exchange719,429