SlideShare ist ein Scribd-Unternehmen logo
1 von 9
Downloaden Sie, um offline zu lesen
Pegasi Energy Resources Corp.
                                 Pegasi Energy Resources Corp. engages in the exploration and production of
                                 natural gas and oil in the east Texas oil and gas region. The company holds
                                 interests in properties located in Marion and Cass County, Texas.


July 18, 2012                                        P: 646-875-4973                         www.caprockrm.com


Chris Jarvis, CFA, CMT             Symbol: PGSI                                Recommendation: Strong Buy
President & CEO                    Last Price: $0.83                                   Target Price: $1.50
chris@caprockrm.com
                                   Risk: Speculative                                       Sector: Energy
Peter White
Executive Vice President & CFO
peter@caprockrm.com


                                    Successful Beta Well Validates Cornerstone Project
                                 Action:

                                 We are reiterating our STRONG BUY rating on Pegasi Energy Resources
                                 Corporation and 12-month price target of $1.50. Our valuation is based on applying
                                 an 8.82x multiple to our Next Twelve Months (NTM) EPS estimate of $0.17. We
                                 believe our valuation is conservative given the fact the multiple represents a 13%
                                 discount to the company’s peer group average multiple of 10.07x. As a result, we
                                 expect as the company continues to execute the “Corner Stone” project further, there
                                 is room for multiple expansion as more investors be accustomed to our investment
                                 thesis.

                                 Summary:

                                     •     With the success of the company’s beta well, we believe PGSI’s strong
                                           management team with geological experience and expertise in the Rodessa
                                           field and ability to accumulate and consolidate acreage will drive and
                                           maximize shareholder wealth.

                                     •     For our calendar year 2013, we are significantly raising our EPS estimates
                                           from $0.30 per share to $0.42 with total revenue of $35.5 million, which is
                                           based on two new horizontal wells coming online in CY2013.
Caprock Risk Management, LLC                                                                    7/18/2012

                      Investment Summary Update
                      On July 10th, PGSI issued a press release for the production results of the Morse Unit # 1-
                      H beta well. The company successfully completed a 2,000 foot lateral, 5-stage frac job
                      beta horizontal well. The initial production results of the beta well yielded 281 barrels of
                      oil a day over a 5-day period. We believe the successful completion of the Morse Unit
                      #1-H beta horizontal well is material for the following five reasons:

                          1) Proof of Concept. The production results for the Morse Unit #1-H beta
                             horizontal well confirms PGSI’s management’s proof of concept for the
   “Reiterating              company’s “Corner Stone” project. We believe the success of the beta well sets
   STRONG BUY                the stage for additional horizontal wells, which management indicated would be
   rating, 12-               roughly 3,000 to 5,000 foot laterals with multi-frac stages ranging from 15 to 25
   month price               that will yield between 800 barrels a day to roughly 1,400 barrels a day in new
   target of $1.50”          production for each additional well. New oil production at these levels will have
                             a material impact on the company’s revenue and earnings growth for the
                             foreseeable future that will drive shareholder wealth and enhancing the
                             risk/reward profile for shares of PGSI.

                          2) Multi-Product Profile. PGSI has been a one dimensional play solely focused on
                             natural gas to this point. The successful completion of the beta well and proof of
                             concept for the “Corner Stoner” project will have a positive material impact on
                             the company’s business model, which now will be dominated by oil revenues
                             while still providing investors with vast portfolio of natural gas production that
                             has been hampered by historically low natural gas prices. A reversal of natural
                             gas prices back to normalized levels in and around $4.00 MMBtu coupled with
                             the new oil production slated to come online over the next 18 months should
                             generate significant earnings growth and with it, a higher market capitalization.

                          3) Learning Curve. The beta well also provides crucial data for piping and other
                             drilling/fracing operations that will optimize the completions for the company’s
                             future horizontal wells. We believe this will also help reduce the costs for new
                             horizontal well completions while optimizing production.

                          4) New Production comes from possible reserves. The Bossier shale where the
                             horizontal well was drilled and the geological area of the two new horizontal
                             wells being drilled over the next 12 months comes from the company’s possible
                             reserves. Given this, PGSI’s P1 (proved producing) should increase materially as
                             PGSI unlocks the value of the company’s underlying reserves, bolstering
                             shareholder value.

                          5) Easier access to Capital. With the success of the beta well, we expect the
                             company to be able to raise additional capital more efficiently at a reduced cost
                             of capital given the proof of concept of the “Corner Stone” project.

                      In summary and as we highlighted in our initiation report dated May 14, 2012, we stated
                      the following as part of our investment thesis, PGSI’s management team has a long track
                      record of success operating in East Texas, specifically the Rodessa field, dating back to
                      the early 1980’s. In addition, PGSI’s management has been focused extensively on the


                                                  2
Caprock Risk Management, LLC                                                                 7/18/2012
                    “Corner Stone” project for over a decade now and long before PGSI became a public
                    entity. We believe the years of experience and intimate knowledge that management
                    brings to the table is on the cusp of bearing fruits for PGSI investors, which starts with
                    the company’s first horizontal well that is expected to be completed by June. With the
                    success of the company’s beta well, we believe PGSI’s strong management team with
                    geological experience and expertise in the Rodessa field and ability to accumulate and
                    consolidate acreage will drive and maximize shareholder wealth.

                    We are reiterating our STRONG BUY rating on Pegasi Energy Resources
                    Corporation and 12-month price target of $1.50. Our valuation is based on applying
                    an 8.82x multiple to our Next Twelve Months (NTM) EPS estimate of $0.17. We believe
                    our valuation is conservative given the fact the multiple represents a 13% discount to the
                    company’s peer group average multiple of 10.07x. As a result, we expect as the company
                    continues to execute the “Corner Stone” project further, there is room for multiple
                    expansion as more investors be accustomed to our investment thesis.

                    Earnings Outlook
                    With the successful completion of the Morse Unit # 1-H well and our recent
                    conversations with management, we are revising our 2012 and 2013 drilling
                    program as well as our revenue and earnings estimates accordingly:

                        •   For the drilling of the second horizontal well, we are moving the start date
                            of the initial drilling from August 2012 to October 2012 to accommodate
                            PGSI’s capital needs to fund the project.

                        •   We estimate that the second well will take several months to drill and be
                            completed, which will likely occur in December 2012 and revenues
                            beginning the first quarter of 2012.

                        •   As a result, we are lowering our calendar year 2012 revenue and earnings
                            per share estimates. For revenues, we are taking down our estimates from
                            $10.9 million to $3.9 million and earnings per share from $0.06 to a loss
                            of $0.05 per share (mainly coming from the large derivative loss in the
                            first quarter of 2012 and timing of the second well). We believe the
                            company will become cash flow and earnings positive in 3Q2012, or EPS
                            of $0.01.

                        •   For the Next Twelve Months (NTM), we are lowering our EPS estimate
                            from $0.24 per share to $0.17 per share with total revenue of $17.3
                            million, which again is due to the timing of the second well in addition to
                            trimming our oil price target for 2012 from an average price of $100 a
                            barrel for the year around $90 a barrel.

                        •   For our calendar year 2013, we are significantly raising our EPS estimates
                            from $0.30 per share to $0.42 with total revenue of $35.5 million, which is


                                                3
Caprock Risk Management, LLC                                                            7/18/2012

                           based on two new horizontal wells (2nd well coming online January 2013
                           and 3rd well coming on line in July 2013) coming online in CY2013
                           (introducing our 2013 model on page 6). For 2013, we are maintaining our
                           average crude oil price target of $100 but there are growing risks to this
                           estimate, which may lead us to cut our oil price forecast for 2013 in the
                           near future.

                    In summary, we believe our new production schedule is conservative with only
                    two new horizontal wells coming online over the next 18 months. Clearly as
                    PGSI successfully executes the “Corner Stone” strategy, we believe PGSI will
                    quickly attract additional capital to fund other projects making our two new well
                    estimates for 2013 conservative (possibility of drilling up to 5 new wells if the
                    company continues to execute and attracts additional investment capital).
                    Furthermore, we have estimated that the two new horizontal wells coming online
                    in 2013 will be 4,000 foot laterals with a 20 stage frac profile yielding 1,100
                    barrels a day each of new production. Again, our estimates are based on the mid-
                    range of guidance, which was provided in PGSI’s press release on July 10th that
                    suggested a range of 3,000 to 5,000 foot laterals with 15 to 25 multiple frac stages
                    and a range of 800 BOD to 1,400 BOD of new production.


                                              4
2012 Earnings Model
 Pegasi                                 100        100        100            100               103              95            82              93            85             90             90                88             95             95             95                95             94

 Earnings Model                        2.50       2.30       2.15            2.32             2.05             2.49          2.50            2.35          2.50           2.50           2.50              2.50           2.50           2.75           3.00              2.75            2.48
                                        31         29         31              30               30               31            30              30            31             31             30                31             31             30             31                31             365

 De scription                          Jan-12     Feb-12     Mar-12         1Q 2012           Apr-12       May 2012         Jun-12       2Q 2012E         Jul-12         Aug-12         Sep-12        3Q 2012E           O ct-12        Nov-12         Dec-12        4Q 2012E            2012E
 Revenues
  T otal Oil Revenues                                                   $     98,820      $     33,552     $    31,603     $ 107,217     $ 172,372       $ 542,656      $ 534,360      $ 481,053      $ 1,558,069       $ 488,242      $ 439,789      $ 423,129      $ 1,351,160       $ 3,180,420
  T otal Gas Revenues                                                         69,188            18,282          22,422        47,279     $    87,983        46,359         43,988         66,480      $ 156,826            64,631         64,766         68,766      $ 198,164            512,161
  Condensate & Skim Oil                                                       12,470             4,500            4,500        4,500     $    13,500         4,500          4,500          4,500      $     13,500          4,500          4,500          4,500      $     13,500           52,970
  T ransportation & Gathering                                                 39,319            12,000          12,000        12,000          36,000        12,000         12,000         12,000            36,000         12,000         12,000         12,000            36,000         147,319

    Total Re venues                                                          219,797            68,334          70,525       170,996         309,854       605,515        594,847        564,033          1,764,395       569,373        521,056        508,395          1,598,824       3,892,870


 COGS                                                                        121,822            20,025          20,627        48,257          88,908       167,749        164,816        156,342           488,907        157,810        144,523        141,042           443,375        1,143,013

    Gross Profit Margin                                                       97,975            48,309          49,898       122,739         220,946       437,766        430,031        407,691          1,275,488       411,563        376,532        367,354          1,155,449       2,749,858


 Operating Expenses
    General & Administrative                                                1,378,071          170,833         170,833       170,833         512,500       170,833        170,833        170,833           512,500        170,833        170,833        170,833           512,500        2,915,571
    Sales & Marketing                                                         30,000            10,000          10,000        10,000          30,000        10,000         10,000         10,000            30,000         10,000         10,000         10,000            30,000         120,000
    Miscellaneous                                                              7,500             2,500            2,500        2,500            7,500        2,500          2,500          2,500             7,500          2,500          2,500          2,500             7,500           30,000

      Total O pe rating Expenses                                            1,415,571          183,333         183,333       183,333         550,000       183,333        183,333        183,333           550,000        183,333        183,333        183,333           550,000        3,065,571

 EBITDA                                                                 (1,317,596)           (135,024)        (133,436)     (60,594)        (329,054)     254,432        246,698        224,357           725,488        228,229        193,199        184,020           605,449         (315,713)

 Hedging & O the r De rivatives                                         (1,201,114)                    -              -              -              -               -              -              -                 -              -              -              -                 -    (1,201,114)

 Inte rest Expe nse                                                          157,943            55,000          55,000        55,000         165,000        55,000         55,000         55,000           165,000         55,000         55,000         55,000           165,000         652,943

 De pre ciation & Amortization                                                67,418            25,000          25,000        25,000          75,000        25,000         25,000         25,000            75,000         25,000         25,000         25,000            75,000         292,418

 Ne t Income Be fore Taxe s                                             (2,744,071)           (215,024)        (213,436)    (140,594)        (569,054)     174,432        166,698        144,357           485,488        148,229        113,199        104,020           365,449       (2,462,188)

 Tax Expense (2012 tax rate 0%)                                                       -                -              -              -              -               -              -              -                 -              -              -              -                 -               -

 Ne t Income                                                            (2,744,071)           (215,024)        (213,436)    (140,594)        (569,054)     174,432        166,698        144,357           485,488        148,229        113,199        104,020           365,449       (2,462,188)
 Earnings Per Share ($)                       -          -          -           (0.05)           (0.00)           (0.00)       (0.00)           (0.01)           0.00           0.00           0.00              0.01           0.00           0.00           0.00              0.01           (0.05)
 Share s O utstanding (in 000's)         54,220    54,220      54,220         54,220            54,220          54,220        54,220          54,220        54,220         54,220         54,220            54,220         54,220         54,220         54,220            54,220           54,220


 Source: Company Data, CRM Estimates
2013 Earnings Model
   Pegasi                                 100            100             100               100             100            100            100               100             100            100            100               100              100            100            100              100             100

   Earnings Model                        3.00           3.00            3.00              3.00            3.00           2.75           2.75              2.83            2.75           2.75           3.00               2.83            3.00           3.25           3.50              3.25            2.98
                                          31             29              31                30              30             31             30                30              31             31             30                31               31             30             31                31             365

   Description                          Jan-13          Fe b-13        Mar-13            1Q 2013E        Apr-13         May-13         Jun-13            2Q 2013E         Jul-13        Aug-13         Sep-13            3Q 2013E         O ct-13        Nov-13         Dec-13        4Q 2013E            2013E
   Revenues
    T otal Oil Revenues                $ 2,784,792    $ 2,415,647     $ 2,394,572    $ 7,595,011        $ 2,149,052    $ 2,059,572    $ 1,848,669    $ 6,057,293        $ 4,154,603    $ 3,863,646    $ 3,477,831    $ 11,496,080        $ 3,405,819    $ 3,125,641    $ 3,064,959    $ 9,596,419       $ 34,744,803
    T otal Gas Revenues                    29,853         27,229          28,379     $      85,461          26,777         24,730         52,044     $     103,550          50,995         48,386         79,776     $     179,157           77,558         76,542         80,227     $ 234,327             602,495
    Condensate & Skim Oil                   4,500          4,500           4,500     $      13,500           4,500          4,500          4,500     $      13,500           4,500          4,500          4,500     $      13,500            4,500          4,500          4,500     $     13,500           54,000
    T ransportation & Gathering            12,000         12,000          12,000            36,000          12,000         12,000         12,000            36,000          12,000         12,000         12,000            36,000           12,000         12,000         12,000           36,000          144,000

      Total Re venue s                  2,831,145      2,459,376       2,439,451          7,729,972      2,192,329      2,100,802      1,917,212          6,210,343      4,222,098      3,928,532      3,574,107         11,724,737       3,499,876      3,218,683      3,161,686         9,880,246      35,545,298


   COGS                                   779,798        677,561         672,082         2,129,441         604,123        578,953        528,466          1,711,543      1,162,310      1,081,579        984,112          3,228,001         963,699        886,371        870,697         2,720,766       9,789,751

      Gross Profit Margin               2,051,348      1,781,814       1,767,369         5,600,531       1,588,205      1,521,849      1,388,746          4,498,800      3,059,788      2,846,953      2,589,994          8,496,736       2,536,177      2,332,313      2,290,990         7,159,480      25,755,547


   Operating Expenses
      General & Administrative            170,833        170,833         170,833           512,500         170,833        170,833        170,833           512,500         170,833        170,833        170,833           512,500          170,833        170,833        170,833          512,500        2,050,000
      Sales & Marketing                    10,000         10,000          10,000            30,000          10,000         10,000         10,000            30,000          10,000         10,000         10,000            30,000           10,000         10,000         10,000           30,000          120,000
      Miscellaneous                         2,500          2,500           2,500                7,500        2,500          2,500          2,500                7,500        2,500          2,500          2,500                7,500         2,500          2,500          2,500            7,500           30,000

        Total O pe rating Expe nse s      183,333        183,333         183,333           550,000         183,333        183,333        183,333           550,000         183,333        183,333        183,333           550,000          183,333        183,333        183,333          550,000        2,200,000

   EBITDA                               1,868,014      1,598,481       1,584,036         5,050,531       1,404,872      1,338,515      1,205,413          3,948,800      2,876,455      2,663,620      2,406,661          7,946,736       2,352,844      2,148,979      2,107,657         6,609,480      23,555,547

   He dging & O the r Derivatives                 -               -              -                  -              -              -              -                  -              -              -              -                   -              -              -              -                 -                -

   Inte rest Expense                       55,000         55,000          55,000           165,000          55,000         55,000         55,000           165,000          55,000         55,000         55,000           165,000           55,000         55,000         55,000          165,000          660,000

   Depre ciation & Amortization            25,000         25,000          25,000            75,000          25,000         25,000         25,000            75,000          25,000         25,000         25,000            75,000           25,000         25,000         25,000           75,000          300,000

   Net Income Before Taxe s             1,788,014      1,518,481       1,504,036         4,810,531       1,324,872      1,258,515      1,125,413          3,708,800      2,796,455      2,583,620      2,326,661          7,706,736       2,272,844      2,068,979      2,027,657         6,369,480      22,595,547

   Tax Expense (2012 tax rate 0%)                 -               -              -                  -              -              -              -                  -              -              -              -                   -              -              -              -                 -                -

   Net Income                           1,788,014      1,518,481       1,504,036         4,810,531       1,324,872      1,258,515      1,125,413          3,708,800      2,796,455      2,583,620      2,326,661          7,706,736       2,272,844      2,068,979      2,027,657         6,369,480      22,595,547
   Earnings Pe r Share ($)                     0.03           0.03            0.03               0.09           0.02           0.02           0.02               0.07           0.05           0.05           0.04                0.14           0.04           0.04           0.04              0.12             0.42
   Share s O utstanding (in 000's)         54,220         54,220          54,220            54,220          54,220         54,220         54,220            54,220          54,220         54,220         54,220            54,220           54,220         54,220         54,220           54,220           54,220


 Source: Company Data, CRM Estimates
Caprock Risk Management, LLC                                                             7/18/2012


                    Disclosures and Certification: Independent Fee-Based Research
                       •   CRM only accepts cash compensation for our work and do not accept any
                           compensation contingent on the content or conclusions of the research or
                           the resulting impact on share price.

                       •   Report Discloser:

                           -   CRM received a 12-month contract for $4,116 a month starting March
                               15, 2012 to launch and maintain independent fee-based research on
                               Pegasi Energy Resource Corporation shares.

                           -   CRM and/or our staff have no personal, professional, or financial
                               relationship with Pegasi or its subsidiaries, agents, or trading entities.

                           -   CRM analyst credentials, including professional designations and
                               experience: Chris Jarvis is Chairman, Chief Executive Officer, and
                               President of Caprock. He has served as Senior Commodities Strategist
                               for vFinance Investments, a unit of National Holdings Corporation of
                               New York, New York. Prior to working at National, Mr. Jarvis was a
                               senior energy and commodities strategist with Merrill Lynch and
                               Advest.

                               He holds a BA from University of Massachusetts and a MBA from
                               University of Connecticut. Christopher has earned the right to use the
                               Chartered Financial Analyst (CFA) designation. He is a member of the
                               CFA Institute. Lastly, Christopher has also earned the right to use the
                               Chartered Market Technician (CMT) designation and is a member of
                               Market Technicians Association (MTA).

                       •   CRM will provide continuing coverage on Pegasi. Interested parties can
                           either visit www.caprockrm.com or email Chris Jarvis at
                           Chris@caprockrm.com or Peter@caprockrm.com for future updates.
                       •   CRM is not aware of any matters that could reasonably be expected to
                           impair our objectivity in drafting the report.

                       •   There is no history of recommendations for the subject-company and
                           number and distribution of recommendations for all companies we cover.

                       •   I, Christopher C. Jarvis, hereby certify that the analysis or
                           recommendations contained in the report, if any, represent the true
                           opinions of the author or authors.

                       •   CRM refrains from engaging in, or receiving compensation from, any
                           investment banking or corporate finance-related activities with the issuer.


                                               7
Caprock Risk Management, LLC                                                             7/18/2012

                        •   CRM’s analyst(s) do not share information about the subject company or
                            the timing of the release of a research report with any person who could
                            have the ability to trade in advance of (“front run”) the release of a report.

                        •   CRM and affiliates refrain from trading in the shares of the subject
                            company in advance of the release of a report or update.

                        •   CRM refrains from trading in a manner that is contrary to, or inconsistent
                            with, the employees’ or the firm’s most recent published recommendations
                            or ratings, except in circumstances of unanticipated extreme financial
                            hardship.

                        •   CRM abides by all laws, rules, and regulations that apply to registered or
                            regulated analysts.


                     About Caprock
                     Chris Jarvis, CFA, CMT founded Caprock Risk Management, LLC (“CRM” or
                     “Caprock”) in 2006. Caprock’s mission is to add value for our clients by
                     providing superior market intelligence and advisory services for energy risk
                     management.

                     Management and Employees

                     Chris Jarvis is Chairman, Chief Executive Officer, and President of Caprock. He
                     has served as Senior Commodities Strategist for vFinance Investments, a unit of
                     National Holdings Corporation of New York, New York. Prior to working at
                     National, Mr. Jarvis was a senior energy and commodities strategist with Merrill
                     Lynch and Advest. He holds a BA from University of Massachusetts and a MBA
                     from University of Connecticut. Christopher has earned the right to use the
                     Chartered Financial Analyst (CFA) designation. He is a member of the CFA
                     Institute. Lastly, Christopher has also earned the right to use the Chartered
                     Market Technician (CMT) designation and is a member of Market Technicians
                     Association (MTA).

                     Peter White is Executive Vice President and Chief Financial Officer. Mr. White
                     is an innovative and proficient executive with over 30 years of experience with
                     private and publicly traded companies in the financial and investment sectors. A
                     CPA, Mr. White has a MBA from New York University and an MAB from
                     Bowdoin College.
Caprock Risk Management, LLC                                              7/18/2012

Disclaimer

    This publication is intended for informational purposes only and the opinions
    set forth herein should not be viewed as an offer or solicitation to buy, sell or
    otherwise trade Equities, futures and/or options. All opinions and information
    contained in this document constitute Caprock Risk Management (CRM)
    judgment as of the date of this document and are subject to change without
    notice. CRM, persons connected with it, members of the CRM, subsidiaries
    and affiliates ("Affiliated Companies") and their respective directors and
    employees may, directly or indirectly, effect or have effected a transaction for
    their own account in the investments referred to in the material contained
    herein before or after the material is published to any customer of an
    Affiliated Company or may give advice to customers which may differ from
    or be inconsistent with the information and opinions contained herein. While
    the information contained herein was obtained from sources believed to be
    reliable, no Affiliated Company accepts any liability whatsoever for any
    direct, indirect or consequential loss arising from any inaccuracy herein or
    from any use of this document or its contents.

    This document may not be reproduced, distributed, or published in electronic,
    paper, or other form for any purpose without the prior written consent of
    CRM. This report has been prepared without regard to the specific investment
    objectives, financial situation and needs of any particular recipient.


                                         9

Weitere ähnliche Inhalte

Was ist angesagt?

Fm nov corp-feb._1
Fm nov corp-feb._1Fm nov corp-feb._1
Fm nov corp-feb._1fizakousar
 
TWC Risk-Managed Canadian Energy Fund Presentation June 29 Mini
TWC Risk-Managed Canadian Energy Fund Presentation   June 29 MiniTWC Risk-Managed Canadian Energy Fund Presentation   June 29 Mini
TWC Risk-Managed Canadian Energy Fund Presentation June 29 Minimartinrp
 
Corporate Summary - December 2016
Corporate Summary - December 2016Corporate Summary - December 2016
Corporate Summary - December 2016yamanagold2016
 
Bayshore Petroleum Corp - Corporate Presentation
Bayshore Petroleum Corp - Corporate PresentationBayshore Petroleum Corp - Corporate Presentation
Bayshore Petroleum Corp - Corporate PresentationViral Network Inc
 
Shona Corporate presentation, January 2012
Shona Corporate presentation, January 2012Shona Corporate presentation, January 2012
Shona Corporate presentation, January 2012Shona_Energy
 
Northern Lights Resources Corp.
Northern Lights Resources Corp. Northern Lights Resources Corp.
Northern Lights Resources Corp. MomentumPR
 

Was ist angesagt? (7)

Fm nov corp-feb._1
Fm nov corp-feb._1Fm nov corp-feb._1
Fm nov corp-feb._1
 
NZEC Corporate Presentation October 2011
NZEC Corporate Presentation October 2011NZEC Corporate Presentation October 2011
NZEC Corporate Presentation October 2011
 
TWC Risk-Managed Canadian Energy Fund Presentation June 29 Mini
TWC Risk-Managed Canadian Energy Fund Presentation   June 29 MiniTWC Risk-Managed Canadian Energy Fund Presentation   June 29 Mini
TWC Risk-Managed Canadian Energy Fund Presentation June 29 Mini
 
Corporate Summary - December 2016
Corporate Summary - December 2016Corporate Summary - December 2016
Corporate Summary - December 2016
 
Bayshore Petroleum Corp - Corporate Presentation
Bayshore Petroleum Corp - Corporate PresentationBayshore Petroleum Corp - Corporate Presentation
Bayshore Petroleum Corp - Corporate Presentation
 
Shona Corporate presentation, January 2012
Shona Corporate presentation, January 2012Shona Corporate presentation, January 2012
Shona Corporate presentation, January 2012
 
Northern Lights Resources Corp.
Northern Lights Resources Corp. Northern Lights Resources Corp.
Northern Lights Resources Corp.
 

Andere mochten auch

The Industry
The IndustryThe Industry
The IndustryBhaveshsw
 
הכל על שדה בריר האמת - תשובה לרותם
הכל על שדה בריר   האמת - תשובה לרותםהכל על שדה בריר   האמת - תשובה לרותם
הכל על שדה בריר האמת - תשובה לרותם111sarit
 
Product portfolio 2012
Product portfolio 2012Product portfolio 2012
Product portfolio 2012Zain Master
 
As media powerpoint
As media  powerpointAs media  powerpoint
As media powerpointHartfordsam
 
Slide Show For Bank Card Pos
Slide Show For Bank Card PosSlide Show For Bank Card Pos
Slide Show For Bank Card PosBryanMiedel
 
Double page spread analysis (main task)
Double page spread analysis (main task)Double page spread analysis (main task)
Double page spread analysis (main task)EDPRICE93
 
Shaun Barnes Data Cabling Reference Sites
Shaun Barnes Data Cabling Reference SitesShaun Barnes Data Cabling Reference Sites
Shaun Barnes Data Cabling Reference Sitesshaunbarnes
 
Medgenics (NYSE AMEX: MDGN) - Nomura Code Securities Limited, London
Medgenics (NYSE AMEX: MDGN) - Nomura Code Securities Limited, LondonMedgenics (NYSE AMEX: MDGN) - Nomura Code Securities Limited, London
Medgenics (NYSE AMEX: MDGN) - Nomura Code Securities Limited, LondonProActive Capital Resources Group
 
Silhouette Designer 3 Guide
Silhouette Designer 3 GuideSilhouette Designer 3 Guide
Silhouette Designer 3 Guidemicrodor
 
fOSSa 2010 - Spago4Q: OSS for Quality Monitoring in IT Projects and Services
fOSSa 2010 - Spago4Q: OSS for Quality Monitoring in IT Projects and ServicesfOSSa 2010 - Spago4Q: OSS for Quality Monitoring in IT Projects and Services
fOSSa 2010 - Spago4Q: OSS for Quality Monitoring in IT Projects and ServicesDavide Dalle Carbonare
 
банк сосьете женераль восток презентация
банк сосьете женераль восток презентациябанк сосьете женераль восток презентация
банк сосьете женераль восток презентацияAlexanderKarchenko
 
Analisis penilaian
Analisis penilaianAnalisis penilaian
Analisis penilaianNaya Ti
 
2012 how to conduct research (updated 21 feb 2012)
2012 how to conduct research (updated 21 feb 2012)2012 how to conduct research (updated 21 feb 2012)
2012 how to conduct research (updated 21 feb 2012)Joanne4
 

Andere mochten auch (20)

Italy Visas
Italy VisasItaly Visas
Italy Visas
 
Las apps
Las appsLas apps
Las apps
 
My video
My videoMy video
My video
 
The Industry
The IndustryThe Industry
The Industry
 
הכל על שדה בריר האמת - תשובה לרותם
הכל על שדה בריר   האמת - תשובה לרותםהכל על שדה בריר   האמת - תשובה לרותם
הכל על שדה בריר האמת - תשובה לרותם
 
Product portfolio 2012
Product portfolio 2012Product portfolio 2012
Product portfolio 2012
 
As media powerpoint
As media  powerpointAs media  powerpoint
As media powerpoint
 
Slide Show For Bank Card Pos
Slide Show For Bank Card PosSlide Show For Bank Card Pos
Slide Show For Bank Card Pos
 
Premier Alliance Group, Inc. (OTC.BB: PIMO), November 2011
Premier Alliance Group, Inc. (OTC.BB: PIMO), November 2011 Premier Alliance Group, Inc. (OTC.BB: PIMO), November 2011
Premier Alliance Group, Inc. (OTC.BB: PIMO), November 2011
 
Double page spread analysis (main task)
Double page spread analysis (main task)Double page spread analysis (main task)
Double page spread analysis (main task)
 
Shaun Barnes Data Cabling Reference Sites
Shaun Barnes Data Cabling Reference SitesShaun Barnes Data Cabling Reference Sites
Shaun Barnes Data Cabling Reference Sites
 
Medgenics (NYSE AMEX: MDGN) - Nomura Code Securities Limited, London
Medgenics (NYSE AMEX: MDGN) - Nomura Code Securities Limited, LondonMedgenics (NYSE AMEX: MDGN) - Nomura Code Securities Limited, London
Medgenics (NYSE AMEX: MDGN) - Nomura Code Securities Limited, London
 
Medgenics (NYSE AMEX: MDGN) - Maxim Group Research Report
Medgenics (NYSE AMEX: MDGN) - Maxim Group Research Report Medgenics (NYSE AMEX: MDGN) - Maxim Group Research Report
Medgenics (NYSE AMEX: MDGN) - Maxim Group Research Report
 
Lecturacompr1rnivell5
Lecturacompr1rnivell5Lecturacompr1rnivell5
Lecturacompr1rnivell5
 
Silhouette Designer 3 Guide
Silhouette Designer 3 GuideSilhouette Designer 3 Guide
Silhouette Designer 3 Guide
 
fOSSa 2010 - Spago4Q: OSS for Quality Monitoring in IT Projects and Services
fOSSa 2010 - Spago4Q: OSS for Quality Monitoring in IT Projects and ServicesfOSSa 2010 - Spago4Q: OSS for Quality Monitoring in IT Projects and Services
fOSSa 2010 - Spago4Q: OSS for Quality Monitoring in IT Projects and Services
 
банк сосьете женераль восток презентация
банк сосьете женераль восток презентациябанк сосьете женераль восток презентация
банк сосьете женераль восток презентация
 
Analisis penilaian
Analisis penilaianAnalisis penilaian
Analisis penilaian
 
2012 how to conduct research (updated 21 feb 2012)
2012 how to conduct research (updated 21 feb 2012)2012 how to conduct research (updated 21 feb 2012)
2012 how to conduct research (updated 21 feb 2012)
 
Session 2 energy sources and uses
Session 2   energy sources and usesSession 2   energy sources and uses
Session 2 energy sources and uses
 

Ähnlich wie Pegasi Energy Research Note July 18, 2012

spectra energy Transcript_Q12008
spectra energy Transcript_Q12008spectra energy Transcript_Q12008
spectra energy Transcript_Q12008finance49
 
Ika Bethari_updated
Ika Bethari_updatedIka Bethari_updated
Ika Bethari_updatedIka Bethari
 
PEG_AGAFinancialForum
PEG_AGAFinancialForumPEG_AGAFinancialForum
PEG_AGAFinancialForumfinance20
 
public serviceenterprise group AGA Financial Forum
public serviceenterprise group AGA Financial Forumpublic serviceenterprise group AGA Financial Forum
public serviceenterprise group AGA Financial Forumfinance20
 
AES Q1 2017 Financial Review
AES Q1 2017 Financial ReviewAES Q1 2017 Financial Review
AES Q1 2017 Financial ReviewAES_BigSky
 
Ratcheted Equity Investment - Overview (A Construction Case Study 3)
Ratcheted Equity Investment - Overview (A Construction Case Study 3)Ratcheted Equity Investment - Overview (A Construction Case Study 3)
Ratcheted Equity Investment - Overview (A Construction Case Study 3)icebreakereim
 
I-Bytes Energy Industry
I-Bytes Energy IndustryI-Bytes Energy Industry
I-Bytes Energy IndustryEGBG Services
 
Portfolio Construction and Management (Equity and Debt) using Efficient Front...
Portfolio Construction and Management (Equity and Debt) using Efficient Front...Portfolio Construction and Management (Equity and Debt) using Efficient Front...
Portfolio Construction and Management (Equity and Debt) using Efficient Front...Karan Jaidka
 
RNEST - Refinaria Abreu Lima, Ipojuca - PE
RNEST - Refinaria Abreu Lima, Ipojuca - PERNEST - Refinaria Abreu Lima, Ipojuca - PE
RNEST - Refinaria Abreu Lima, Ipojuca - PEFrau Soares
 
Foyson Investors Executive Summary
Foyson Investors Executive SummaryFoyson Investors Executive Summary
Foyson Investors Executive SummaryFOYSONRESOURCESLTD
 
Heavy Oil Upgrading Catalyst Technology Presentation
Heavy Oil Upgrading Catalyst Technology PresentationHeavy Oil Upgrading Catalyst Technology Presentation
Heavy Oil Upgrading Catalyst Technology Presentationchristinegao666
 
MILL, Miller Energy Oil and Gas Investor Article One on One
MILL, Miller Energy Oil and Gas Investor Article One on OneMILL, Miller Energy Oil and Gas Investor Article One on One
MILL, Miller Energy Oil and Gas Investor Article One on OneDerek Gradwell
 
Birla corporation limited
Birla corporation limitedBirla corporation limited
Birla corporation limitedtdjariwala
 
05 08-17 first quarter 2017 financial review final
05 08-17 first quarter 2017 financial review final05 08-17 first quarter 2017 financial review final
05 08-17 first quarter 2017 financial review finalAES_BigSky
 
I-Bytes Utilities Industry
I-Bytes Utilities IndustryI-Bytes Utilities Industry
I-Bytes Utilities IndustryEGBG Services
 

Ähnlich wie Pegasi Energy Research Note July 18, 2012 (20)

spectra energy Transcript_Q12008
spectra energy Transcript_Q12008spectra energy Transcript_Q12008
spectra energy Transcript_Q12008
 
NBCC - A Quality Cash Bargain
NBCC - A Quality Cash BargainNBCC - A Quality Cash Bargain
NBCC - A Quality Cash Bargain
 
Godrej properties hbj capital
Godrej properties   hbj capitalGodrej properties   hbj capital
Godrej properties hbj capital
 
Ika Bethari_updated
Ika Bethari_updatedIka Bethari_updated
Ika Bethari_updated
 
NBCC - A Quality Cash Bargain
NBCC - A Quality Cash BargainNBCC - A Quality Cash Bargain
NBCC - A Quality Cash Bargain
 
PEG_AGAFinancialForum
PEG_AGAFinancialForumPEG_AGAFinancialForum
PEG_AGAFinancialForum
 
public serviceenterprise group AGA Financial Forum
public serviceenterprise group AGA Financial Forumpublic serviceenterprise group AGA Financial Forum
public serviceenterprise group AGA Financial Forum
 
ASSAIGNMENT
ASSAIGNMENTASSAIGNMENT
ASSAIGNMENT
 
AES Q1 2017 Financial Review
AES Q1 2017 Financial ReviewAES Q1 2017 Financial Review
AES Q1 2017 Financial Review
 
Ratcheted Equity Investment - Overview (A Construction Case Study 3)
Ratcheted Equity Investment - Overview (A Construction Case Study 3)Ratcheted Equity Investment - Overview (A Construction Case Study 3)
Ratcheted Equity Investment - Overview (A Construction Case Study 3)
 
Balkrishna industries - Good Long Term Bet
Balkrishna industries - Good Long Term BetBalkrishna industries - Good Long Term Bet
Balkrishna industries - Good Long Term Bet
 
I-Bytes Energy Industry
I-Bytes Energy IndustryI-Bytes Energy Industry
I-Bytes Energy Industry
 
Portfolio Construction and Management (Equity and Debt) using Efficient Front...
Portfolio Construction and Management (Equity and Debt) using Efficient Front...Portfolio Construction and Management (Equity and Debt) using Efficient Front...
Portfolio Construction and Management (Equity and Debt) using Efficient Front...
 
RNEST - Refinaria Abreu Lima, Ipojuca - PE
RNEST - Refinaria Abreu Lima, Ipojuca - PERNEST - Refinaria Abreu Lima, Ipojuca - PE
RNEST - Refinaria Abreu Lima, Ipojuca - PE
 
Foyson Investors Executive Summary
Foyson Investors Executive SummaryFoyson Investors Executive Summary
Foyson Investors Executive Summary
 
Heavy Oil Upgrading Catalyst Technology Presentation
Heavy Oil Upgrading Catalyst Technology PresentationHeavy Oil Upgrading Catalyst Technology Presentation
Heavy Oil Upgrading Catalyst Technology Presentation
 
MILL, Miller Energy Oil and Gas Investor Article One on One
MILL, Miller Energy Oil and Gas Investor Article One on OneMILL, Miller Energy Oil and Gas Investor Article One on One
MILL, Miller Energy Oil and Gas Investor Article One on One
 
Birla corporation limited
Birla corporation limitedBirla corporation limited
Birla corporation limited
 
05 08-17 first quarter 2017 financial review final
05 08-17 first quarter 2017 financial review final05 08-17 first quarter 2017 financial review final
05 08-17 first quarter 2017 financial review final
 
I-Bytes Utilities Industry
I-Bytes Utilities IndustryI-Bytes Utilities Industry
I-Bytes Utilities Industry
 

Mehr von ProActive Capital Resources Group

Intracoronary Bone Marrow Mononuclear Cells After Myocardial Infarction
Intracoronary Bone Marrow Mononuclear Cells After Myocardial InfarctionIntracoronary Bone Marrow Mononuclear Cells After Myocardial Infarction
Intracoronary Bone Marrow Mononuclear Cells After Myocardial InfarctionProActive Capital Resources Group
 

Mehr von ProActive Capital Resources Group (20)

Islet defense in bio century week of 5 28-12
Islet defense in bio century week of 5 28-12Islet defense in bio century week of 5 28-12
Islet defense in bio century week of 5 28-12
 
Insider transaction detail for Isa Odidi (IPCI)
Insider transaction detail for Isa Odidi (IPCI)Insider transaction detail for Isa Odidi (IPCI)
Insider transaction detail for Isa Odidi (IPCI)
 
VTUS SEC Filing Form 8-K
VTUS SEC Filing Form 8-KVTUS SEC Filing Form 8-K
VTUS SEC Filing Form 8-K
 
TNXP Fact Sheet May 2012
TNXP Fact Sheet May 2012TNXP Fact Sheet May 2012
TNXP Fact Sheet May 2012
 
Arcis Exec Summary
Arcis Exec Summary Arcis Exec Summary
Arcis Exec Summary
 
SSIE 4.20.12
SSIE 4.20.12 SSIE 4.20.12
SSIE 4.20.12
 
Kerx zerenex phase3
Kerx zerenex phase3Kerx zerenex phase3
Kerx zerenex phase3
 
ARM Stroke
ARM StrokeARM Stroke
ARM Stroke
 
ARM Parkinsons
ARM ParkinsonsARM Parkinsons
ARM Parkinsons
 
ARM Heart Disease
ARM Heart DiseaseARM Heart Disease
ARM Heart Disease
 
ARM Diabetes
ARM DiabetesARM Diabetes
ARM Diabetes
 
Arm ALS
Arm ALSArm ALS
Arm ALS
 
Tonix12 ceocfo-article-clean newphoto
Tonix12 ceocfo-article-clean newphotoTonix12 ceocfo-article-clean newphoto
Tonix12 ceocfo-article-clean newphoto
 
Applied DNA Sciences (OTCBB: APDN)
Applied DNA Sciences (OTCBB: APDN)Applied DNA Sciences (OTCBB: APDN)
Applied DNA Sciences (OTCBB: APDN)
 
Daily Dose Equities - Intracoronary Bone Marrow
Daily Dose Equities - Intracoronary Bone MarrowDaily Dose Equities - Intracoronary Bone Marrow
Daily Dose Equities - Intracoronary Bone Marrow
 
Daily Dose Equities - Effect of Transendocardial Delivery
Daily Dose Equities - Effect of Transendocardial Delivery Daily Dose Equities - Effect of Transendocardial Delivery
Daily Dose Equities - Effect of Transendocardial Delivery
 
Daily Dose Equities - Exosomes from human cd34
Daily Dose Equities - Exosomes from human cd34Daily Dose Equities - Exosomes from human cd34
Daily Dose Equities - Exosomes from human cd34
 
2012 MHCC Web resentation proposal-3-19-2012-published
2012 MHCC Web resentation proposal-3-19-2012-published2012 MHCC Web resentation proposal-3-19-2012-published
2012 MHCC Web resentation proposal-3-19-2012-published
 
PolyMedix ($PYMX) Cowan Research
PolyMedix ($PYMX) Cowan Research PolyMedix ($PYMX) Cowan Research
PolyMedix ($PYMX) Cowan Research
 
Intracoronary Bone Marrow Mononuclear Cells After Myocardial Infarction
Intracoronary Bone Marrow Mononuclear Cells After Myocardial InfarctionIntracoronary Bone Marrow Mononuclear Cells After Myocardial Infarction
Intracoronary Bone Marrow Mononuclear Cells After Myocardial Infarction
 

Kürzlich hochgeladen

Value Proposition canvas- Customer needs and pains
Value Proposition canvas- Customer needs and painsValue Proposition canvas- Customer needs and pains
Value Proposition canvas- Customer needs and painsP&CO
 
Call Girls Pune Just Call 9907093804 Top Class Call Girl Service Available
Call Girls Pune Just Call 9907093804 Top Class Call Girl Service AvailableCall Girls Pune Just Call 9907093804 Top Class Call Girl Service Available
Call Girls Pune Just Call 9907093804 Top Class Call Girl Service AvailableDipal Arora
 
Russian Call Girls In Gurgaon ❤️8448577510 ⊹Best Escorts Service In 24/7 Delh...
Russian Call Girls In Gurgaon ❤️8448577510 ⊹Best Escorts Service In 24/7 Delh...Russian Call Girls In Gurgaon ❤️8448577510 ⊹Best Escorts Service In 24/7 Delh...
Russian Call Girls In Gurgaon ❤️8448577510 ⊹Best Escorts Service In 24/7 Delh...lizamodels9
 
HONOR Veterans Event Keynote by Michael Hawkins
HONOR Veterans Event Keynote by Michael HawkinsHONOR Veterans Event Keynote by Michael Hawkins
HONOR Veterans Event Keynote by Michael HawkinsMichael W. Hawkins
 
MONA 98765-12871 CALL GIRLS IN LUDHIANA LUDHIANA CALL GIRL
MONA 98765-12871 CALL GIRLS IN LUDHIANA LUDHIANA CALL GIRLMONA 98765-12871 CALL GIRLS IN LUDHIANA LUDHIANA CALL GIRL
MONA 98765-12871 CALL GIRLS IN LUDHIANA LUDHIANA CALL GIRLSeo
 
Regression analysis: Simple Linear Regression Multiple Linear Regression
Regression analysis:  Simple Linear Regression Multiple Linear RegressionRegression analysis:  Simple Linear Regression Multiple Linear Regression
Regression analysis: Simple Linear Regression Multiple Linear RegressionRavindra Nath Shukla
 
Call Girls In Panjim North Goa 9971646499 Genuine Service
Call Girls In Panjim North Goa 9971646499 Genuine ServiceCall Girls In Panjim North Goa 9971646499 Genuine Service
Call Girls In Panjim North Goa 9971646499 Genuine Serviceritikaroy0888
 
Monte Carlo simulation : Simulation using MCSM
Monte Carlo simulation : Simulation using MCSMMonte Carlo simulation : Simulation using MCSM
Monte Carlo simulation : Simulation using MCSMRavindra Nath Shukla
 
It will be International Nurses' Day on 12 May
It will be International Nurses' Day on 12 MayIt will be International Nurses' Day on 12 May
It will be International Nurses' Day on 12 MayNZSG
 
Pharma Works Profile of Karan Communications
Pharma Works Profile of Karan CommunicationsPharma Works Profile of Karan Communications
Pharma Works Profile of Karan Communicationskarancommunications
 
Call Girls In DLf Gurgaon ➥99902@11544 ( Best price)100% Genuine Escort In 24...
Call Girls In DLf Gurgaon ➥99902@11544 ( Best price)100% Genuine Escort In 24...Call Girls In DLf Gurgaon ➥99902@11544 ( Best price)100% Genuine Escort In 24...
Call Girls In DLf Gurgaon ➥99902@11544 ( Best price)100% Genuine Escort In 24...lizamodels9
 
Best VIP Call Girls Noida Sector 40 Call Me: 8448380779
Best VIP Call Girls Noida Sector 40 Call Me: 8448380779Best VIP Call Girls Noida Sector 40 Call Me: 8448380779
Best VIP Call Girls Noida Sector 40 Call Me: 8448380779Delhi Call girls
 
Insurers' journeys to build a mastery in the IoT usage
Insurers' journeys to build a mastery in the IoT usageInsurers' journeys to build a mastery in the IoT usage
Insurers' journeys to build a mastery in the IoT usageMatteo Carbone
 
Mondelez State of Snacking and Future Trends 2023
Mondelez State of Snacking and Future Trends 2023Mondelez State of Snacking and Future Trends 2023
Mondelez State of Snacking and Future Trends 2023Neil Kimberley
 
Organizational Transformation Lead with Culture
Organizational Transformation Lead with CultureOrganizational Transformation Lead with Culture
Organizational Transformation Lead with CultureSeta Wicaksana
 
FULL ENJOY Call Girls In Mahipalpur Delhi Contact Us 8377877756
FULL ENJOY Call Girls In Mahipalpur Delhi Contact Us 8377877756FULL ENJOY Call Girls In Mahipalpur Delhi Contact Us 8377877756
FULL ENJOY Call Girls In Mahipalpur Delhi Contact Us 8377877756dollysharma2066
 
0183760ssssssssssssssssssssssssssss00101011 (27).pdf
0183760ssssssssssssssssssssssssssss00101011 (27).pdf0183760ssssssssssssssssssssssssssss00101011 (27).pdf
0183760ssssssssssssssssssssssssssss00101011 (27).pdfRenandantas16
 
Call Girls in Gomti Nagar - 7388211116 - With room Service
Call Girls in Gomti Nagar - 7388211116  - With room ServiceCall Girls in Gomti Nagar - 7388211116  - With room Service
Call Girls in Gomti Nagar - 7388211116 - With room Servicediscovermytutordmt
 
VIP Call Girls In Saharaganj ( Lucknow ) 🔝 8923113531 🔝 Cash Payment (COD) 👒
VIP Call Girls In Saharaganj ( Lucknow  ) 🔝 8923113531 🔝  Cash Payment (COD) 👒VIP Call Girls In Saharaganj ( Lucknow  ) 🔝 8923113531 🔝  Cash Payment (COD) 👒
VIP Call Girls In Saharaganj ( Lucknow ) 🔝 8923113531 🔝 Cash Payment (COD) 👒anilsa9823
 

Kürzlich hochgeladen (20)

Value Proposition canvas- Customer needs and pains
Value Proposition canvas- Customer needs and painsValue Proposition canvas- Customer needs and pains
Value Proposition canvas- Customer needs and pains
 
Call Girls Pune Just Call 9907093804 Top Class Call Girl Service Available
Call Girls Pune Just Call 9907093804 Top Class Call Girl Service AvailableCall Girls Pune Just Call 9907093804 Top Class Call Girl Service Available
Call Girls Pune Just Call 9907093804 Top Class Call Girl Service Available
 
Russian Call Girls In Gurgaon ❤️8448577510 ⊹Best Escorts Service In 24/7 Delh...
Russian Call Girls In Gurgaon ❤️8448577510 ⊹Best Escorts Service In 24/7 Delh...Russian Call Girls In Gurgaon ❤️8448577510 ⊹Best Escorts Service In 24/7 Delh...
Russian Call Girls In Gurgaon ❤️8448577510 ⊹Best Escorts Service In 24/7 Delh...
 
HONOR Veterans Event Keynote by Michael Hawkins
HONOR Veterans Event Keynote by Michael HawkinsHONOR Veterans Event Keynote by Michael Hawkins
HONOR Veterans Event Keynote by Michael Hawkins
 
MONA 98765-12871 CALL GIRLS IN LUDHIANA LUDHIANA CALL GIRL
MONA 98765-12871 CALL GIRLS IN LUDHIANA LUDHIANA CALL GIRLMONA 98765-12871 CALL GIRLS IN LUDHIANA LUDHIANA CALL GIRL
MONA 98765-12871 CALL GIRLS IN LUDHIANA LUDHIANA CALL GIRL
 
Regression analysis: Simple Linear Regression Multiple Linear Regression
Regression analysis:  Simple Linear Regression Multiple Linear RegressionRegression analysis:  Simple Linear Regression Multiple Linear Regression
Regression analysis: Simple Linear Regression Multiple Linear Regression
 
Call Girls In Panjim North Goa 9971646499 Genuine Service
Call Girls In Panjim North Goa 9971646499 Genuine ServiceCall Girls In Panjim North Goa 9971646499 Genuine Service
Call Girls In Panjim North Goa 9971646499 Genuine Service
 
VVVIP Call Girls In Greater Kailash ➡️ Delhi ➡️ 9999965857 🚀 No Advance 24HRS...
VVVIP Call Girls In Greater Kailash ➡️ Delhi ➡️ 9999965857 🚀 No Advance 24HRS...VVVIP Call Girls In Greater Kailash ➡️ Delhi ➡️ 9999965857 🚀 No Advance 24HRS...
VVVIP Call Girls In Greater Kailash ➡️ Delhi ➡️ 9999965857 🚀 No Advance 24HRS...
 
Monte Carlo simulation : Simulation using MCSM
Monte Carlo simulation : Simulation using MCSMMonte Carlo simulation : Simulation using MCSM
Monte Carlo simulation : Simulation using MCSM
 
It will be International Nurses' Day on 12 May
It will be International Nurses' Day on 12 MayIt will be International Nurses' Day on 12 May
It will be International Nurses' Day on 12 May
 
Pharma Works Profile of Karan Communications
Pharma Works Profile of Karan CommunicationsPharma Works Profile of Karan Communications
Pharma Works Profile of Karan Communications
 
Call Girls In DLf Gurgaon ➥99902@11544 ( Best price)100% Genuine Escort In 24...
Call Girls In DLf Gurgaon ➥99902@11544 ( Best price)100% Genuine Escort In 24...Call Girls In DLf Gurgaon ➥99902@11544 ( Best price)100% Genuine Escort In 24...
Call Girls In DLf Gurgaon ➥99902@11544 ( Best price)100% Genuine Escort In 24...
 
Best VIP Call Girls Noida Sector 40 Call Me: 8448380779
Best VIP Call Girls Noida Sector 40 Call Me: 8448380779Best VIP Call Girls Noida Sector 40 Call Me: 8448380779
Best VIP Call Girls Noida Sector 40 Call Me: 8448380779
 
Insurers' journeys to build a mastery in the IoT usage
Insurers' journeys to build a mastery in the IoT usageInsurers' journeys to build a mastery in the IoT usage
Insurers' journeys to build a mastery in the IoT usage
 
Mondelez State of Snacking and Future Trends 2023
Mondelez State of Snacking and Future Trends 2023Mondelez State of Snacking and Future Trends 2023
Mondelez State of Snacking and Future Trends 2023
 
Organizational Transformation Lead with Culture
Organizational Transformation Lead with CultureOrganizational Transformation Lead with Culture
Organizational Transformation Lead with Culture
 
FULL ENJOY Call Girls In Mahipalpur Delhi Contact Us 8377877756
FULL ENJOY Call Girls In Mahipalpur Delhi Contact Us 8377877756FULL ENJOY Call Girls In Mahipalpur Delhi Contact Us 8377877756
FULL ENJOY Call Girls In Mahipalpur Delhi Contact Us 8377877756
 
0183760ssssssssssssssssssssssssssss00101011 (27).pdf
0183760ssssssssssssssssssssssssssss00101011 (27).pdf0183760ssssssssssssssssssssssssssss00101011 (27).pdf
0183760ssssssssssssssssssssssssssss00101011 (27).pdf
 
Call Girls in Gomti Nagar - 7388211116 - With room Service
Call Girls in Gomti Nagar - 7388211116  - With room ServiceCall Girls in Gomti Nagar - 7388211116  - With room Service
Call Girls in Gomti Nagar - 7388211116 - With room Service
 
VIP Call Girls In Saharaganj ( Lucknow ) 🔝 8923113531 🔝 Cash Payment (COD) 👒
VIP Call Girls In Saharaganj ( Lucknow  ) 🔝 8923113531 🔝  Cash Payment (COD) 👒VIP Call Girls In Saharaganj ( Lucknow  ) 🔝 8923113531 🔝  Cash Payment (COD) 👒
VIP Call Girls In Saharaganj ( Lucknow ) 🔝 8923113531 🔝 Cash Payment (COD) 👒
 

Pegasi Energy Research Note July 18, 2012

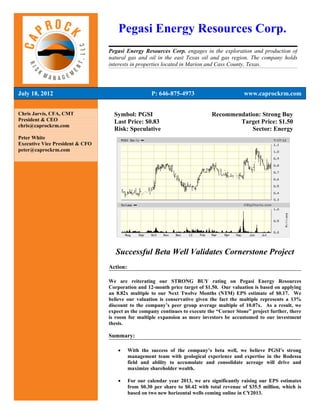
  • 1. Pegasi Energy Resources Corp. Pegasi Energy Resources Corp. engages in the exploration and production of natural gas and oil in the east Texas oil and gas region. The company holds interests in properties located in Marion and Cass County, Texas. July 18, 2012 P: 646-875-4973 www.caprockrm.com Chris Jarvis, CFA, CMT Symbol: PGSI Recommendation: Strong Buy President & CEO Last Price: $0.83 Target Price: $1.50 chris@caprockrm.com Risk: Speculative Sector: Energy Peter White Executive Vice President & CFO peter@caprockrm.com Successful Beta Well Validates Cornerstone Project Action: We are reiterating our STRONG BUY rating on Pegasi Energy Resources Corporation and 12-month price target of $1.50. Our valuation is based on applying an 8.82x multiple to our Next Twelve Months (NTM) EPS estimate of $0.17. We believe our valuation is conservative given the fact the multiple represents a 13% discount to the company’s peer group average multiple of 10.07x. As a result, we expect as the company continues to execute the “Corner Stone” project further, there is room for multiple expansion as more investors be accustomed to our investment thesis. Summary: • With the success of the company’s beta well, we believe PGSI’s strong management team with geological experience and expertise in the Rodessa field and ability to accumulate and consolidate acreage will drive and maximize shareholder wealth. • For our calendar year 2013, we are significantly raising our EPS estimates from $0.30 per share to $0.42 with total revenue of $35.5 million, which is based on two new horizontal wells coming online in CY2013.
  • 2. Caprock Risk Management, LLC 7/18/2012 Investment Summary Update On July 10th, PGSI issued a press release for the production results of the Morse Unit # 1- H beta well. The company successfully completed a 2,000 foot lateral, 5-stage frac job beta horizontal well. The initial production results of the beta well yielded 281 barrels of oil a day over a 5-day period. We believe the successful completion of the Morse Unit #1-H beta horizontal well is material for the following five reasons: 1) Proof of Concept. The production results for the Morse Unit #1-H beta horizontal well confirms PGSI’s management’s proof of concept for the “Reiterating company’s “Corner Stone” project. We believe the success of the beta well sets STRONG BUY the stage for additional horizontal wells, which management indicated would be rating, 12- roughly 3,000 to 5,000 foot laterals with multi-frac stages ranging from 15 to 25 month price that will yield between 800 barrels a day to roughly 1,400 barrels a day in new target of $1.50” production for each additional well. New oil production at these levels will have a material impact on the company’s revenue and earnings growth for the foreseeable future that will drive shareholder wealth and enhancing the risk/reward profile for shares of PGSI. 2) Multi-Product Profile. PGSI has been a one dimensional play solely focused on natural gas to this point. The successful completion of the beta well and proof of concept for the “Corner Stoner” project will have a positive material impact on the company’s business model, which now will be dominated by oil revenues while still providing investors with vast portfolio of natural gas production that has been hampered by historically low natural gas prices. A reversal of natural gas prices back to normalized levels in and around $4.00 MMBtu coupled with the new oil production slated to come online over the next 18 months should generate significant earnings growth and with it, a higher market capitalization. 3) Learning Curve. The beta well also provides crucial data for piping and other drilling/fracing operations that will optimize the completions for the company’s future horizontal wells. We believe this will also help reduce the costs for new horizontal well completions while optimizing production. 4) New Production comes from possible reserves. The Bossier shale where the horizontal well was drilled and the geological area of the two new horizontal wells being drilled over the next 12 months comes from the company’s possible reserves. Given this, PGSI’s P1 (proved producing) should increase materially as PGSI unlocks the value of the company’s underlying reserves, bolstering shareholder value. 5) Easier access to Capital. With the success of the beta well, we expect the company to be able to raise additional capital more efficiently at a reduced cost of capital given the proof of concept of the “Corner Stone” project. In summary and as we highlighted in our initiation report dated May 14, 2012, we stated the following as part of our investment thesis, PGSI’s management team has a long track record of success operating in East Texas, specifically the Rodessa field, dating back to the early 1980’s. In addition, PGSI’s management has been focused extensively on the 2
  • 3. Caprock Risk Management, LLC 7/18/2012 “Corner Stone” project for over a decade now and long before PGSI became a public entity. We believe the years of experience and intimate knowledge that management brings to the table is on the cusp of bearing fruits for PGSI investors, which starts with the company’s first horizontal well that is expected to be completed by June. With the success of the company’s beta well, we believe PGSI’s strong management team with geological experience and expertise in the Rodessa field and ability to accumulate and consolidate acreage will drive and maximize shareholder wealth. We are reiterating our STRONG BUY rating on Pegasi Energy Resources Corporation and 12-month price target of $1.50. Our valuation is based on applying an 8.82x multiple to our Next Twelve Months (NTM) EPS estimate of $0.17. We believe our valuation is conservative given the fact the multiple represents a 13% discount to the company’s peer group average multiple of 10.07x. As a result, we expect as the company continues to execute the “Corner Stone” project further, there is room for multiple expansion as more investors be accustomed to our investment thesis. Earnings Outlook With the successful completion of the Morse Unit # 1-H well and our recent conversations with management, we are revising our 2012 and 2013 drilling program as well as our revenue and earnings estimates accordingly: • For the drilling of the second horizontal well, we are moving the start date of the initial drilling from August 2012 to October 2012 to accommodate PGSI’s capital needs to fund the project. • We estimate that the second well will take several months to drill and be completed, which will likely occur in December 2012 and revenues beginning the first quarter of 2012. • As a result, we are lowering our calendar year 2012 revenue and earnings per share estimates. For revenues, we are taking down our estimates from $10.9 million to $3.9 million and earnings per share from $0.06 to a loss of $0.05 per share (mainly coming from the large derivative loss in the first quarter of 2012 and timing of the second well). We believe the company will become cash flow and earnings positive in 3Q2012, or EPS of $0.01. • For the Next Twelve Months (NTM), we are lowering our EPS estimate from $0.24 per share to $0.17 per share with total revenue of $17.3 million, which again is due to the timing of the second well in addition to trimming our oil price target for 2012 from an average price of $100 a barrel for the year around $90 a barrel. • For our calendar year 2013, we are significantly raising our EPS estimates from $0.30 per share to $0.42 with total revenue of $35.5 million, which is 3
  • 4. Caprock Risk Management, LLC 7/18/2012 based on two new horizontal wells (2nd well coming online January 2013 and 3rd well coming on line in July 2013) coming online in CY2013 (introducing our 2013 model on page 6). For 2013, we are maintaining our average crude oil price target of $100 but there are growing risks to this estimate, which may lead us to cut our oil price forecast for 2013 in the near future. In summary, we believe our new production schedule is conservative with only two new horizontal wells coming online over the next 18 months. Clearly as PGSI successfully executes the “Corner Stone” strategy, we believe PGSI will quickly attract additional capital to fund other projects making our two new well estimates for 2013 conservative (possibility of drilling up to 5 new wells if the company continues to execute and attracts additional investment capital). Furthermore, we have estimated that the two new horizontal wells coming online in 2013 will be 4,000 foot laterals with a 20 stage frac profile yielding 1,100 barrels a day each of new production. Again, our estimates are based on the mid- range of guidance, which was provided in PGSI’s press release on July 10th that suggested a range of 3,000 to 5,000 foot laterals with 15 to 25 multiple frac stages and a range of 800 BOD to 1,400 BOD of new production. 4
  • 5. 2012 Earnings Model Pegasi 100 100 100 100 103 95 82 93 85 90 90 88 95 95 95 95 94 Earnings Model 2.50 2.30 2.15 2.32 2.05 2.49 2.50 2.35 2.50 2.50 2.50 2.50 2.50 2.75 3.00 2.75 2.48 31 29 31 30 30 31 30 30 31 31 30 31 31 30 31 31 365 De scription Jan-12 Feb-12 Mar-12 1Q 2012 Apr-12 May 2012 Jun-12 2Q 2012E Jul-12 Aug-12 Sep-12 3Q 2012E O ct-12 Nov-12 Dec-12 4Q 2012E 2012E Revenues T otal Oil Revenues $ 98,820 $ 33,552 $ 31,603 $ 107,217 $ 172,372 $ 542,656 $ 534,360 $ 481,053 $ 1,558,069 $ 488,242 $ 439,789 $ 423,129 $ 1,351,160 $ 3,180,420 T otal Gas Revenues 69,188 18,282 22,422 47,279 $ 87,983 46,359 43,988 66,480 $ 156,826 64,631 64,766 68,766 $ 198,164 512,161 Condensate & Skim Oil 12,470 4,500 4,500 4,500 $ 13,500 4,500 4,500 4,500 $ 13,500 4,500 4,500 4,500 $ 13,500 52,970 T ransportation & Gathering 39,319 12,000 12,000 12,000 36,000 12,000 12,000 12,000 36,000 12,000 12,000 12,000 36,000 147,319 Total Re venues 219,797 68,334 70,525 170,996 309,854 605,515 594,847 564,033 1,764,395 569,373 521,056 508,395 1,598,824 3,892,870 COGS 121,822 20,025 20,627 48,257 88,908 167,749 164,816 156,342 488,907 157,810 144,523 141,042 443,375 1,143,013 Gross Profit Margin 97,975 48,309 49,898 122,739 220,946 437,766 430,031 407,691 1,275,488 411,563 376,532 367,354 1,155,449 2,749,858 Operating Expenses General & Administrative 1,378,071 170,833 170,833 170,833 512,500 170,833 170,833 170,833 512,500 170,833 170,833 170,833 512,500 2,915,571 Sales & Marketing 30,000 10,000 10,000 10,000 30,000 10,000 10,000 10,000 30,000 10,000 10,000 10,000 30,000 120,000 Miscellaneous 7,500 2,500 2,500 2,500 7,500 2,500 2,500 2,500 7,500 2,500 2,500 2,500 7,500 30,000 Total O pe rating Expenses 1,415,571 183,333 183,333 183,333 550,000 183,333 183,333 183,333 550,000 183,333 183,333 183,333 550,000 3,065,571 EBITDA (1,317,596) (135,024) (133,436) (60,594) (329,054) 254,432 246,698 224,357 725,488 228,229 193,199 184,020 605,449 (315,713) Hedging & O the r De rivatives (1,201,114) - - - - - - - - - - - - (1,201,114) Inte rest Expe nse 157,943 55,000 55,000 55,000 165,000 55,000 55,000 55,000 165,000 55,000 55,000 55,000 165,000 652,943 De pre ciation & Amortization 67,418 25,000 25,000 25,000 75,000 25,000 25,000 25,000 75,000 25,000 25,000 25,000 75,000 292,418 Ne t Income Be fore Taxe s (2,744,071) (215,024) (213,436) (140,594) (569,054) 174,432 166,698 144,357 485,488 148,229 113,199 104,020 365,449 (2,462,188) Tax Expense (2012 tax rate 0%) - - - - - - - - - - - - - - Ne t Income (2,744,071) (215,024) (213,436) (140,594) (569,054) 174,432 166,698 144,357 485,488 148,229 113,199 104,020 365,449 (2,462,188) Earnings Per Share ($) - - - (0.05) (0.00) (0.00) (0.00) (0.01) 0.00 0.00 0.00 0.01 0.00 0.00 0.00 0.01 (0.05) Share s O utstanding (in 000's) 54,220 54,220 54,220 54,220 54,220 54,220 54,220 54,220 54,220 54,220 54,220 54,220 54,220 54,220 54,220 54,220 54,220 Source: Company Data, CRM Estimates
  • 6. 2013 Earnings Model Pegasi 100 100 100 100 100 100 100 100 100 100 100 100 100 100 100 100 100 Earnings Model 3.00 3.00 3.00 3.00 3.00 2.75 2.75 2.83 2.75 2.75 3.00 2.83 3.00 3.25 3.50 3.25 2.98 31 29 31 30 30 31 30 30 31 31 30 31 31 30 31 31 365 Description Jan-13 Fe b-13 Mar-13 1Q 2013E Apr-13 May-13 Jun-13 2Q 2013E Jul-13 Aug-13 Sep-13 3Q 2013E O ct-13 Nov-13 Dec-13 4Q 2013E 2013E Revenues T otal Oil Revenues $ 2,784,792 $ 2,415,647 $ 2,394,572 $ 7,595,011 $ 2,149,052 $ 2,059,572 $ 1,848,669 $ 6,057,293 $ 4,154,603 $ 3,863,646 $ 3,477,831 $ 11,496,080 $ 3,405,819 $ 3,125,641 $ 3,064,959 $ 9,596,419 $ 34,744,803 T otal Gas Revenues 29,853 27,229 28,379 $ 85,461 26,777 24,730 52,044 $ 103,550 50,995 48,386 79,776 $ 179,157 77,558 76,542 80,227 $ 234,327 602,495 Condensate & Skim Oil 4,500 4,500 4,500 $ 13,500 4,500 4,500 4,500 $ 13,500 4,500 4,500 4,500 $ 13,500 4,500 4,500 4,500 $ 13,500 54,000 T ransportation & Gathering 12,000 12,000 12,000 36,000 12,000 12,000 12,000 36,000 12,000 12,000 12,000 36,000 12,000 12,000 12,000 36,000 144,000 Total Re venue s 2,831,145 2,459,376 2,439,451 7,729,972 2,192,329 2,100,802 1,917,212 6,210,343 4,222,098 3,928,532 3,574,107 11,724,737 3,499,876 3,218,683 3,161,686 9,880,246 35,545,298 COGS 779,798 677,561 672,082 2,129,441 604,123 578,953 528,466 1,711,543 1,162,310 1,081,579 984,112 3,228,001 963,699 886,371 870,697 2,720,766 9,789,751 Gross Profit Margin 2,051,348 1,781,814 1,767,369 5,600,531 1,588,205 1,521,849 1,388,746 4,498,800 3,059,788 2,846,953 2,589,994 8,496,736 2,536,177 2,332,313 2,290,990 7,159,480 25,755,547 Operating Expenses General & Administrative 170,833 170,833 170,833 512,500 170,833 170,833 170,833 512,500 170,833 170,833 170,833 512,500 170,833 170,833 170,833 512,500 2,050,000 Sales & Marketing 10,000 10,000 10,000 30,000 10,000 10,000 10,000 30,000 10,000 10,000 10,000 30,000 10,000 10,000 10,000 30,000 120,000 Miscellaneous 2,500 2,500 2,500 7,500 2,500 2,500 2,500 7,500 2,500 2,500 2,500 7,500 2,500 2,500 2,500 7,500 30,000 Total O pe rating Expe nse s 183,333 183,333 183,333 550,000 183,333 183,333 183,333 550,000 183,333 183,333 183,333 550,000 183,333 183,333 183,333 550,000 2,200,000 EBITDA 1,868,014 1,598,481 1,584,036 5,050,531 1,404,872 1,338,515 1,205,413 3,948,800 2,876,455 2,663,620 2,406,661 7,946,736 2,352,844 2,148,979 2,107,657 6,609,480 23,555,547 He dging & O the r Derivatives - - - - - - - - - - - - - - - - - Inte rest Expense 55,000 55,000 55,000 165,000 55,000 55,000 55,000 165,000 55,000 55,000 55,000 165,000 55,000 55,000 55,000 165,000 660,000 Depre ciation & Amortization 25,000 25,000 25,000 75,000 25,000 25,000 25,000 75,000 25,000 25,000 25,000 75,000 25,000 25,000 25,000 75,000 300,000 Net Income Before Taxe s 1,788,014 1,518,481 1,504,036 4,810,531 1,324,872 1,258,515 1,125,413 3,708,800 2,796,455 2,583,620 2,326,661 7,706,736 2,272,844 2,068,979 2,027,657 6,369,480 22,595,547 Tax Expense (2012 tax rate 0%) - - - - - - - - - - - - - - - - - Net Income 1,788,014 1,518,481 1,504,036 4,810,531 1,324,872 1,258,515 1,125,413 3,708,800 2,796,455 2,583,620 2,326,661 7,706,736 2,272,844 2,068,979 2,027,657 6,369,480 22,595,547 Earnings Pe r Share ($) 0.03 0.03 0.03 0.09 0.02 0.02 0.02 0.07 0.05 0.05 0.04 0.14 0.04 0.04 0.04 0.12 0.42 Share s O utstanding (in 000's) 54,220 54,220 54,220 54,220 54,220 54,220 54,220 54,220 54,220 54,220 54,220 54,220 54,220 54,220 54,220 54,220 54,220 Source: Company Data, CRM Estimates
  • 7. Caprock Risk Management, LLC 7/18/2012 Disclosures and Certification: Independent Fee-Based Research • CRM only accepts cash compensation for our work and do not accept any compensation contingent on the content or conclusions of the research or the resulting impact on share price. • Report Discloser: - CRM received a 12-month contract for $4,116 a month starting March 15, 2012 to launch and maintain independent fee-based research on Pegasi Energy Resource Corporation shares. - CRM and/or our staff have no personal, professional, or financial relationship with Pegasi or its subsidiaries, agents, or trading entities. - CRM analyst credentials, including professional designations and experience: Chris Jarvis is Chairman, Chief Executive Officer, and President of Caprock. He has served as Senior Commodities Strategist for vFinance Investments, a unit of National Holdings Corporation of New York, New York. Prior to working at National, Mr. Jarvis was a senior energy and commodities strategist with Merrill Lynch and Advest. He holds a BA from University of Massachusetts and a MBA from University of Connecticut. Christopher has earned the right to use the Chartered Financial Analyst (CFA) designation. He is a member of the CFA Institute. Lastly, Christopher has also earned the right to use the Chartered Market Technician (CMT) designation and is a member of Market Technicians Association (MTA). • CRM will provide continuing coverage on Pegasi. Interested parties can either visit www.caprockrm.com or email Chris Jarvis at Chris@caprockrm.com or Peter@caprockrm.com for future updates. • CRM is not aware of any matters that could reasonably be expected to impair our objectivity in drafting the report. • There is no history of recommendations for the subject-company and number and distribution of recommendations for all companies we cover. • I, Christopher C. Jarvis, hereby certify that the analysis or recommendations contained in the report, if any, represent the true opinions of the author or authors. • CRM refrains from engaging in, or receiving compensation from, any investment banking or corporate finance-related activities with the issuer. 7
  • 8. Caprock Risk Management, LLC 7/18/2012 • CRM’s analyst(s) do not share information about the subject company or the timing of the release of a research report with any person who could have the ability to trade in advance of (“front run”) the release of a report. • CRM and affiliates refrain from trading in the shares of the subject company in advance of the release of a report or update. • CRM refrains from trading in a manner that is contrary to, or inconsistent with, the employees’ or the firm’s most recent published recommendations or ratings, except in circumstances of unanticipated extreme financial hardship. • CRM abides by all laws, rules, and regulations that apply to registered or regulated analysts. About Caprock Chris Jarvis, CFA, CMT founded Caprock Risk Management, LLC (“CRM” or “Caprock”) in 2006. Caprock’s mission is to add value for our clients by providing superior market intelligence and advisory services for energy risk management. Management and Employees Chris Jarvis is Chairman, Chief Executive Officer, and President of Caprock. He has served as Senior Commodities Strategist for vFinance Investments, a unit of National Holdings Corporation of New York, New York. Prior to working at National, Mr. Jarvis was a senior energy and commodities strategist with Merrill Lynch and Advest. He holds a BA from University of Massachusetts and a MBA from University of Connecticut. Christopher has earned the right to use the Chartered Financial Analyst (CFA) designation. He is a member of the CFA Institute. Lastly, Christopher has also earned the right to use the Chartered Market Technician (CMT) designation and is a member of Market Technicians Association (MTA). Peter White is Executive Vice President and Chief Financial Officer. Mr. White is an innovative and proficient executive with over 30 years of experience with private and publicly traded companies in the financial and investment sectors. A CPA, Mr. White has a MBA from New York University and an MAB from Bowdoin College.
  • 9. Caprock Risk Management, LLC 7/18/2012 Disclaimer This publication is intended for informational purposes only and the opinions set forth herein should not be viewed as an offer or solicitation to buy, sell or otherwise trade Equities, futures and/or options. All opinions and information contained in this document constitute Caprock Risk Management (CRM) judgment as of the date of this document and are subject to change without notice. CRM, persons connected with it, members of the CRM, subsidiaries and affiliates ("Affiliated Companies") and their respective directors and employees may, directly or indirectly, effect or have effected a transaction for their own account in the investments referred to in the material contained herein before or after the material is published to any customer of an Affiliated Company or may give advice to customers which may differ from or be inconsistent with the information and opinions contained herein. While the information contained herein was obtained from sources believed to be reliable, no Affiliated Company accepts any liability whatsoever for any direct, indirect or consequential loss arising from any inaccuracy herein or from any use of this document or its contents. This document may not be reproduced, distributed, or published in electronic, paper, or other form for any purpose without the prior written consent of CRM. This report has been prepared without regard to the specific investment objectives, financial situation and needs of any particular recipient. 9