Qarma performance on extreme market move days
•
0 gefällt mir•216 views

QARMA Performance Presentation on Days when S&P went down by more than -1.5%

Empfohlen
Weitere ähnliche Inhalte
Andere mochten auch
Kürzlich hochgeladen
Kürzlich hochgeladen (20)
Qarma performance on extreme market move days
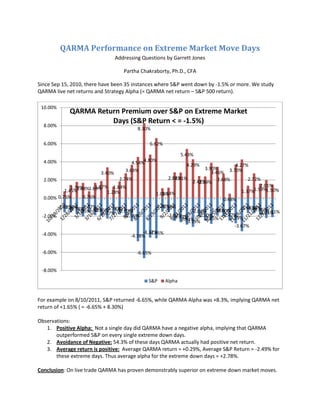
- 1. QARMA Performance on Extreme Market Move Days Addressing Questions by Garrett Jones Partha Chakraborty, Ph.D., CFA Since Sep 15, 2010, there have been 35 instances where S&P went down by -1.5% or more. We study QARMA live net returns and Strategy Alpha (= QARMA net return – S&P 500 return). 10.00% QARMA Return Premium over S&P on Extreme Market Days (S&P Return < = -1.5%) 8.00% 8.30% 6.00% 6.62% 5.43% 4.00% 4.54%4.80% 4.29% 4.27% 3.69% 3.90% 3.70% 3.40% 3.46% 2.00% 2.74% 2.84% 2.81% 2.68% 2.72% 2.43% 2.39% 1.79% 1.87% 1.84% 2.01% 1.45%1.68%1.69% 1.28% 1.37%1.59%1.50% 1.14% 1.09% 0.00% 0.75% 0.76% 0.48% -1.59% -1.57% -1.59%-1.78% -1.89% -1.74% -1.50% -1.55% -1.66% -1.68% -2.05% -1.95% -1.81% -2.27% -2.03% -2.04% -1.94% -2.00% -1.86%-2.11% -2.21% -2.00% -2.56% -2.52% -2.67% -2.50% -2.47% -2.94% -2.85% -2.79% -3.19% -3.67% -4.00% -4.37% -4.45% -4.78% -6.00% -6.65% -8.00% S&P Alpha For example on 8/10/2011, S&P returned -6.65%, while QARMA Alpha was +8.3%, implying QARMA net return of +1.65% ( = -6.65% + 8.30%) Observations: 1. Positive Alpha: Not a single day did QARMA have a negative alpha, implying that QARMA outperformed S&P on every single extreme down days. 2. Avoidance of Negative: 54.3% of these days QARMA actually had positive net return. 3. Average return is positive: Average QARMA return = +0.29%, Average S&P Return = -2.49% for these extreme days. Thus average alpha for the extreme down days = +2.78%. Conclusion: On live trade QARMA has proven demonstrably superior on extreme down market moves.