Bullwhip Effect by Means of Numerical Simulation_PV
1. Bullwhip Effect by Means of Numerical Simulation
CUOA International MBA
Paolo Vaona
paolo.vaona@gmail.com
Abstract
The object of this papers to provide an overview of what the bullwhip effect is and try to better
understanding it by the means of agent base simulation.
The article is divided in four section. First a brief overview of the bullwhip effect is provided.
In the second section the Cisco 2001 case is discussed, showing how relevant is this problem in
the life of a company.
In the third section it is illustrated a code written in NetLogo, a multi-agent programmable modeling
environment, that simulate the Beer Game. In this way it is possible to study how different behavior
of the actor of the process can affect the outcome of the simulation. Some possible way to mitigate
the effect are investigated.
Finally in the conclusion some possible advantage for firm are considered.
The Bullwhip Effect
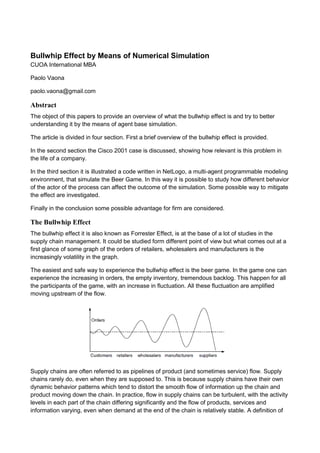
The bullwhip effect it is also known as Forrester Effect, is at the base of a lot of studies in the
supply chain management. It could be studied form different point of view but what comes out at a
first glance of some graph of the orders of retailers, wholesalers and manufacturers is the
increasingly volatility in the graph.
The easiest and safe way to experience the bullwhip effect is the beer game. In the game one can
experience the increasing in orders, the empty inventory, tremendous backlog. This happen for all
the participants of the game, with an increase in fluctuation. All these fluctuation are amplified
moving upstream of the flow.
Supply chains are often referred to as pipelines of product (and sometimes service) flow. Supply
chains rarely do, even when they are supposed to. This is because supply chains have their own
dynamic behavior patterns which tend to distort the smooth flow of information up the chain and
product moving down the chain. In practice, flow in supply chains can be turbulent, with the activity
levels in each part of the chain differing significantly and the flow of products, services and
information varying, even when demand at the end of the chain is relatively stable. A definition of
2. bullwhip effect then could be that small changes in one part of the chain can cause seemingly
erratic behavior in other parts.
It is important to understand it, for although it is essentially a short-term phenomenon, the
measures that operations try to put in place in order to deal with it have more strategic implications.
There are several reason for the bullwhip effect. Some of these are:
Demand forecast updating. Forecasting is often based on the order history from the
company immediate customer and usually the information exchanged between the actors
are the order. When a downstream operation place an order the upstream process that
piece of information as a signal of future demand. This underline a mismatch between what
upstream and downstream see.
Order batching. This is something related by the way usually downstream makes orders.
Generally downstream batches or accumulate demands before placing an order. Periodic
ordering amplify the effect of the bullwhip effect. The effect on the upstream of this behavior
is, even with a steady demand, to have concentrated orders. Another example of these
behaviors could be found in the hockey stick effect.
Price fluctuation. Usually forward buying results from price fluctuation ( due to currency,
materials, due to wholesaler that want to clear the inventory or even due to trade
promotions because of the impact on the manufacturer’s stock performance). I this way the
costumer consumer’s buying pattern doesn’t reflect its consumption pattern. A famous
example is the one that involved Volvo during the 90s. At that time Volvo had an excess of
green cars. To move them along marketing and selling began offering special deals.
Nobody told the manufacture department about the discount and so once they saw the
increase the demand for green car they ramped up production. Another famous case study
in this field is Barilla.
Rationing and shortage gaming This generally happen when demand exceeds supply.
Under such circumstances, a supplier may ration supplies to its customers. For example, it
might allocate a fixed proportion of each customer’s orders for delivery to them. Of course,
if the customer is aware that this is happening, it is in their interests to place a larger order
in the hope that they will still get what they need, even after the order has been rationed
down. This has the effect of killing the supplying operation’s marketing information.
These are the main cause, known by long time, that could generate the bullwhip effect. Although
they are acquainted by more than 30 years, still some firms face the closure due to them.
What went wrong at Cisco in 2001
The easy solution mention in all the textbook to avoid the bullwhip effect is sharing information.
And for sure a company that declare itself the leader in networks should be prepare to manage in
its supply chain changes and avoid negative effects. In practices what Cisco faced in 2001 was a
major downturn due not only to the economic downturn but also to a wrong management of its
supply chain.
2001 has been a year that Cisco has fixed in his memory. During the year they face the beginning
of one of the biggest change in the organization design in order to face the 2001 Internet bubble
burst.
3. According to CEO John Chambers: "We never built models to anticipate something of this
magnitude." That something was 2001 economic downturn. Chambers surveyed the wreckage and
compared it to an unforeseeable natural disaster. In his mind, the economy not his company’s
software nor its management was clearly to blame. But other networking companies, with far less
sophisticated tools started downgrading their forecasts months earlier. They saw the downturn
coming. Cisco did not. Other companies cut back on inventory. Cisco did not. Other companies
saw demand declining. Cisco saw it rising.
The IT system with Cisco manage the supply chain was at the time view as one of the most
advance and as source of real competitive advantage. It was said that the system was able to
manage everything in all the process of the company. What Cisco’s systems didn’t do was model
what would happen if one critical assumption was removed from both their forecasts and their
mind-sets. If Cisco had run even modestly declining demand models, Chambers and others
managers might have seen the consequences of betting on more inventory. But Cisco had enjoyed
more than 40 straight quarters of stout growth. In its immediate past were three quarters of
extreme growth as high as 66 percent. The numbers the virtual close presented to the eye of the
Cisco executives painted a picture of the present lovely and pleasant. According to many
observers, Cisco’s fundamental blunder was to rely on that pretty picture to assume the future
would be equally pretty.
During the 2000 some components for Cisco’s networking equipment were rumored to be in short
supply. Privately, Cisco was already twitchy because lead times on delivering its routers and
switches were extending. Eventually those lead times would reach nearly six months on some
products. Not having the components could push those delivery dates out even further. This was
mainly due to the precedent choice of the company to heavily outsource the production of all his
products. Due to the increasing lead time Cisco decided to build up its components inventory.
Doing that would accomplish two things: It would reduce the wait time for its customers, and it
would give the manufacturers of Cisco’s switches and routers a reserve to draw on if components
makers ran out.
Of course, everyone else wanted those components and the manufacturing capacity to build the
networking devices too. So in order to get both, to make sure they would have them when they
needed them (and they knew they’d need them; the virtual close told them so), Cisco entered into
long-term commitments with its manufacturing partners and certain key components makers.
Promise us the parts, Cisco said, and we promise to buy them. No matter what.
In the summer of 2000, Solectron’s Shah had customers from every corner begging for more
manufacturing capacity. Even so, his forecasts were slowly diverging from his networking partners’,
including Cisco. His were less optimistic, based on what he saw in the general economy. There
were meetings about it, but nothing was resolved about the growing disparity between what Shah
and his customers thought was happening and what Cisco said was happening. Here, the very
core of Cisco’s infrastructure its much-vaunted outsourced manufacturing model worked against
the company because Cisco’s partners were simply not as invested in delivering a loud wake-up
call as an in-house supplier would have been.
By year’s end, the economy was foundering. It was neither a "U" nor a "V" buy a cliff. The biggest
company halted capital spending. Alternative telecommunications carriers disappeared, along with
many of the dotcoms that had been so feverishly buying Cisco gear. That equipment ended up on
a gray market; barely-used Cisco switches could be had for 15 cents on the dollar, and Cisco lost
money every time one was snapped up. Traditional telecom companies stopped spending too. In
4. short, demand vanished. Cisco finally threw on the brakes Dec. 15. Cisco, the networking
industry’s big engine, went over the edge.
Cisco try to deny and blame for problems to uncontrollable forces, as if the historic $2.2 billion
inventory write-off and the steep decline of the company’s stock had nothing to do with the men at
the top or the systems they trusted. But after that moment they start working more closely with
supplier and try to integrate more and more and develop alliance with their partner to really
integrate the supply chain.
Cisco decided to provide its partners with the same tools it used, as stated in Value Added Retail
Business News “Partner Access OnLine (PAL) leverages the same technology Cisco uses
internally to monitor and score customer satisfaction levels. The idea is that the partners can use
the data, which they can access via the Web 24 hours a day, to get a better understanding of the
relationship they have with customers and identify the specific areas where they need
improvement.”
Bullwhip effect by means of agent modelling
Probably the famous application of the bullwhip effect can be seen playing at the Beer Game.
The beer distribution game(also known as the beer game) is an experiential learning business
simulation game created by a group of professors at MIT Sloan School of Management in early
1960s to demonstrate a number of key principles of supply chain management. The game is
played by teams of at least four players, often in heated competition, and takes from one to one
and a half hours to complete. A debriefing session of roughly equivalent length typically follows to
review the results of each team and discuss the lessons involved. The purpose of the game is to
understand the distribution side dynamics of a multi-echelon supply chain used to distribute a
single item, in this case, cases of beer.
Using NetLogo it is possible to create a program where each agent involved( customer, retailer,
wholesaler, distributor and factory) follow a strategy. Some part of the code has been taken from
an existing model of the beer game for human players. The variable set up in the model allow to
change the following features:
Demand style – Step , Sine, Random
Who place first the order – Retail or Factory
Visibility – this option could be swich on or off and allow the upstream to know what the
next order will be.
Duration ( yearly-52 week,104 week and so on)
Order first – allow to place the order before or later the costumer order is received.
Order Style – Could be costumer driven or modeled according to Sterman Model
The program consider each time step as a week and
5. It takes one step (1 week) for an order to be received by the upstream supplier, and two time slots
(2 weeks) for an order to be filled by that supplier, thus a three week lag in all. The cost of
inventory is set in the same way of the beer game ( 0.5$ for inventory and 2$ for backlog).
With all these variable set it is possible to show and test some of the possible misbehavior that
lead to bullwhip effect.
In the picture below the way in which the program calculate the different demands is shown:
In the picture below the way in which the program model possible behaviors according to Sterman
models is shown.
Here a picture of how the program looks like before the simulation start.
6. In the following paragraph an analysis of how the different variables influence the game is shown.
In general a 104 week period is considered. Always the order is driven from retailer.
No human behavior – the customer driven supply chain
In this case the simulation consider to have no interpretation of the information.
If the variable visibility is set to off, meaning there is no exchange of the order and each player
moves upstream the order information as it is the supply chain is influenced only by the lag that
takes to fill the order.
At first the simulation is run with a step model from customer.
7. As can be seen from the order windows the order all follow the customer order.
It is interesting to underline how even under different shape of the costumer order, for example
sine or random the supply chain works efficiently.
In these models, setting visibility on or off doesn’t change the behavior of the supply chain, since
all the players are able to see the real information coming from the customer, since no additional
noise is added.
This situation is of course the best supply chain designable, able to efficiently transmit the
information upstream.
Then the case has no real interest but it could be considered as benchmark for supply chain
optimization.
8.
9. Human behavior – How different biases affect the supply chain.
In this case the order style is switched to Sterman. Here 4 variables, alpha, beta, theta and Q,
allow to module the behavior of the player. Each of these variables add some information to the
order, in this way increasing the noise in the information that travel upstream trough the supply
chain.
Alpha
The alpha coefficient is inserted in order to modify the expectation based on an amplification of the
expectation due to an order. As can be see this effect has its peak every time the order change
and then it is difficult to dispose the excess of inventory. As seen in the first section, this could lead
to a price fluctuation. The use of visibility could help to mitigate this effect.
Same simulation but with visibility on had a substantial decrease in the total inventory cost.
10. Beta
Beta regulate the fraction of the supply line taken into account. In this case since is the retailer the
one who experience the order it ignore partially the order and then the inventory of the retailer is
always in backlog. In this case since the other variable are zero the effect is concentrated. Since it
is multiplied by alpha, a value different from 0 need to be used (0.07 set)
Having the visibility and constant order it can be seen how the information travel trough the supply
chain and actually beta could help to optimize the cost reducing the inventory at the lowest level.
Of course, under the step demand it easy to optimize the minimum inventory, while under random
demand it could lead to extra cost. In the picture below could be seen the result of the visibility
increase dramatically the efficiency of the supply chain with beta.
11. Theta
The theta represent the phase lag in the order, between the expectation and the last order. For this
reason it is useful to show the result of the simulation under the sine demand instead of the
constant demand. This lead to a slightly lag between the orders an with this kind of demand lead to
an increase in the inventory ( since beta is zero and didn’t allow to stop the orders and consume
the inventory.) It could also represent the reactivity of the supply chain to the changes.
Adding the visibility of the order to the whole supply chain reduce the lag between costumer order
and the other others. Also it is interesting to note that in this case the inventory doesn’t incur in
scarcity period(inventory graph).
12. Q
Q represent a fixed quantity that it is added to the orders. As per the case of beta it is needed to
have the alpha value set different from zero. In this way can be seen that at each order a fix quota
is added, this increase the more upstream the information travel, and therefore the factory takes
more time to come up the orders. This effect add another phase lag to the system.
Again the visibility allow the supply chain to be more immediate in the response and to limit the
increase in the effect of the impulsive change from the customer, which is to say that increase the
damping of the system.
Here the results with visibility on.
13. Real case model
Now it is possible try to simulate a real case, defining first of all the characteristics of the Supply
chain.
In order to represent a real situation the following values are applied:
Alpha = 0.25 a low level of increase the changes
Beta = 1 strong influence of the pending order
Theta=0.1 low level of reactiveness
Q= 6 medium value of influence in the order
We will consider a sine demand and a random demand, always with visibility off.
For a sine demand the result is the following:
It is interesting to note that increasing theta the cost decrease because the factory is more reactive
in providing the good, then reducing the period of backlog , more costly. This is an obvious
conclusion that with a more reactive supply chain cost should generally decrease.
14. Adding the visibility , as expected the reduce the maximum unfilled orders in all players inventory.
Before analyzing the final case, the random demand it have to be clarify that for this type of
demand it is not possible to compare easily the quantitative results obtained between one case
and another because each pattern of order is different from the previous. As indication, what has
been obtained from the sine model should be followed as example of optimization, since a random
pattern could be decomposed in a series of sine and cosine demand.
One thing that it is interesting to note is that under the random demand it is the retail inventory is
more correlated with the oscillation of the wholesaler. At the same time with no visibility and low
level of theta the orders don’t follow the order of customer.
15. Also in this case increasing the theta help the orders to be more attached to the order of the
costumer.
It is interesting to note that, with the visibility, repeating the simulation for 10 times, the average
cost of the inventory it is slightly less than the sine one. This is probably due to the chance to
empty the inventory less frequently due to the period of 0 order.
16. Conclusions
The paper has tried to illustrate the bullwhip effect bot from the theoretical point of view and from a
real case study. In the third section a code is analyzed and explained in order to show a way to
model possible behaviors that could be encountered in the supply chain. The intent is not to
simulate every time a real supply chain, which due to the complexity and the number of variable is
probably almost impossible, but to provide an easy tool to test possible scenario.
It is important as a tool also because it allows to see if between theoretical data and real data there
are some possible trend unseen, such as in the case of Cisco. Since the variable are a lot not anly
a combination of parameters exists, and then having the chance to test the all could help to study
better a real time situation, testing in a quick way possible solution.
In any case, the model proof empirically the fundamental importance of communication between
the actor or player of the supply chain.
This is because a supply chain is not a fix entity but something that evolves with time, and it is then
fundamental to continually monitor it and all conclusion that one could find in a supply chain are
temporary and have to be continually tested.
17. References
Global Operations Strategy: Fundamentals and Practice, Yeming Gong, 2013
Operations Strategy, Slack,Lewis, 2011
Cisco Unauthorized, Jeffrey Young ,Prima Publishing, 2001
Lee, H.L., Padmanabhan, V. and Whang, S. The Bullwhip Effect in Supply Chains. Sloan
Management Review
Modeling Managerial Behavior: Misperceptions of Feedback in a Dynamic Decision Making
Experiment, Sterman J.D., Management Science 35(3), 321-339, 1988.