IONS Seminar 2014 - Session 2 - Seaborne Trade in the Indian Ocean
•Als PPTX, PDF herunterladen•
4 gefällt mir•1,793 views

Speaker: Dr Probal Ghosh, Observer Research Foundation

Empfohlen
Empfohlen
Weitere ähnliche Inhalte
Was ist angesagt?
Was ist angesagt? (20)
Ähnlich wie IONS Seminar 2014 - Session 2 - Seaborne Trade in the Indian Ocean
Ähnlich wie IONS Seminar 2014 - Session 2 - Seaborne Trade in the Indian Ocean (20)
Mehr von Navy Webmaster
Mehr von Navy Webmaster (20)
Kürzlich hochgeladen
Kürzlich hochgeladen (20)
IONS Seminar 2014 - Session 2 - Seaborne Trade in the Indian Ocean
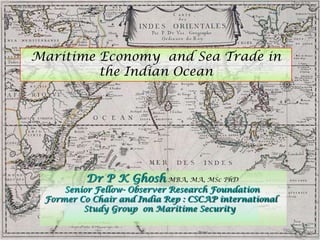
- 1. Dr P K Ghosh MBA, MA, MSc PhD Senior Fellow- Observer Research Foundation Former Co Chair and India Rep : CSCAP international Study Group on Maritime Security Maritime Economy and Sea Trade in the Indian Ocean
- 2. The Indian Ocean is a particularly heightened and concentrated form of the global reality embodied in maritime commerce - ―Maritime Commerce and Security,‖ A Stimsons Report
- 3. Indian Ocean is an ―active‖ ocean hosting a spectrum of activities ranging from extensive trade, transportation of energy to political turmoil and asymmetric challenges
- 4. Some Aspects of Maritime Commerce in IOR • Unfortunately, in modern days maritime commerce is often opaque and incomprehensible to those unfamiliar with it. The shipping industry often feels neglected and misunderstood by outsiders • Maximum trade with the Indian Ocean littorals is sea borne, They effectively form the lifelines for these states. • Economic globalization is founded on the bulwark of SLOC safety and security. • There are enough instances of incidents of interdiction of SLOCs in IOR with disastrous effects on some of the economies.
- 5. • Global sea-borne trade that was around 21,480 billion ton-miles in 1999 by linear projection methodology was expected to rise to 41,800 billion ton-miles by 2014 but 2008 happened … • In 2010 a 2% led to a 8.6per cent growth in the world fleet. seaborne trade grew by 4 per cent in 2011.
- 6. Shipping Industry and associated aspects • The lag time between capital investment in procurement / construction of ships. • In 2008 decline in trade volumes led to a decline in freight revenues, and in valuation of vessels – with over-exposure on mortgages, and a crisis in the shipbuilding markets. • Shipping trade the increase in size and specialization of vessels has been accompanied by a high degree of automation in both port handling and navigation.
- 7. • The rise of new and emerging shipping conglomerates and port super- corporations, many with Chinese origins have created new dynamics in maritime commerce economy. • Smaller powers such Singapore and some Gulf countries all wield influence disproportionate to size.
- 8. Increasing Size of Ships • Have been steadily increasing over the years as the sizes of containerships has jumped in two steps since the 1990s. First step the size increased from 4,000 to 8,000 TEUs, to move beyond the Panamax threshold. Next step it reached the 12,500 TEU level and beyond which would make these ships reach the Suezmax size and new Panamax. • This places intense pressures on infrastructure investments . Port capacities determine the type of ships that can visit that port.
- 9. • Benefits of scale achieved at sea may be lost through higher terminal and hinterland transportation costs. • Development of exceptionally large container vessels has led to the replacement of previous point to point cargo system.
- 10. Evolution of Shipping Hubs • Containerized cargo trade has encouraged the growth of direct oceanic distances has led to the evolution of intermediate hubs. • Most of these intermediate hubs are located near the equatorial maritime route. • Large vessels that are used for long-distance, high capacity routes while smaller associated ports could be used for lower capacity ships. • There is a limit to the hub-and-spoke network configuration and also to the large sizes the ships.
- 12. Liner Shipping Connectivity Index LSCI • Measure of a country’s connectivity to maritime shipping and is a measure of trade facilitation. • Country’s level of integration into the existing liner shipping network by measuring liner shipping connectivity. • The countries that have the highest LSCI values are export-oriented economies of China and Hong Kong and Singapore as a transshipment hub.
- 13. The Baltic Dry Exchange Index BDI • Is a fundamental barometer of the state of global trade it measures the demand for shipping vis-a-vis the supply of bulk carriers available to meet that demand.
- 14. Privatization of Ports • Many countries are realizing that their nationalized ports (main as well as subsidiary ones) cannot compete with the efficiencies offered by the private operators. • Today, the industry is generating more than US$ 50 billion global business with several distinct specialized segments.
- 15. Security Issues • Rise in maritime trade and shipping has led to attendant rise in maritime crime and transnational threats in the region. • Issues like Piracy ,Terrorism, illegal arms transfers, drug running etc have come to the fore. • Already become clear in the case of Somali piracy how such localized conflicts can do significant damage to the security and costs of global seaborne commerce.
- 16. • Countering these threats requires cooperative approaches between the littorals and assistance of more capable countries in capacity building the other less capable maritime agencies. • Initiatives like Indian Ocean Naval Symposium (IONS) (started by India) and those like IORA (Indian Ocean Rim Association) ARF, ADMM Plus etc can be used for cooperative approaches.
- 18. Types of Trade • Modern concept of containerized sea transport, is the dominant mode of transporting goods. • Overall seaborne trade consists of ―bulk cargo‖ or ―general cargo‖. The bulk cargo category includes liquid bulk, dry bulk and specialist bulk. • Four main vessel types service the bulk trades – tankers, bulk carriers, combined carriers and specialist bulk carriers.
- 19. Containerization • Roughly 20 million containers moving around the world today containers have become the most fundamental and essential element of modern shipping. It has "made globalization possible.― • Over the last two decades, it has increased an average of about rate of 9.8 % annually • Over 80 % of the value of world international seaborne trade is containerized.
- 20. • Due low level of industrialization in IOR, containerization levels rarely tend to cross above the 25 % mark. • As a consequence , littorals are faced with little option but to invest in numerous ports, inland depots. • P 3- Marsek Line, CMA CGM, Mediterranean Shipping to form shipping cargo Alliance to jointly deploy 255 vessels and 2.6 million containers. • Freight rates fallen by 50% this year. • Hapag Loyd and CSAV to challenge P3.
- 21. Tankers trade • Oil tanker tonnage reached half a billion dwt in January 2012. • There will be consolidation amongst oil tanker fleets with large corporations gaining. • With high oil prices and lack of onshore storage capacity many major producers notably Iran had at one time stored unsold crude in VLCCs and ULCCs. • Oil price contango occurred. • Overall the tanker market is quite resilient, flexible and dynamic in the short term.
- 22. Liquid Bulk • With the world usage of petroleum and other liquid fuels growing from 87 million barrels per day in 2010 to 97 million barrels per day in 2020 and 115 million barrels per day in 2040. • Resource heartland of the Persian Gulf to the energy deficient "energy demand heartland‖ of Asia comprising of states like India, China and Japan.
- 25. LNG and LPG • Liquefied Gas trades sector has been comparatively resilient • In 2009 there was a slump due to Japan the largest importer reducing imports. • This was since majority of LNG carriers are contracted for up to 20 years at rates that are relatively fixed for the contact period. Hence, owners continued to enjoy the best earnings.
- 27. Dry Bulk • Major bulk trades – iron ore, grain and soy, coal, phosphate rock and bauxite, and alumina mainly so in IOR. • About 50% of major bulk trade consists of material for the steel industry—coal and iron ore. • Trade in coal. South Africa, Indonesia and Australia between them account for more than half of the world’s exports of thermal coal. China and India are the top importers.
- 30. India • Even though India is not as significant in the global shipping industry as China, Korea or Japan, its growing role in global trade and its location makes it an important player in maritime commerce. • India’s share in world merchandise exports is just over 1 %. India is way behind China which constituted 12.4% of Chinese exports in 2008.
- 31. • Export and Import Composition • India has diversified its export base as well. • Manufactured products comprise about 70 % of the exports. • It is moving towards a services dominated GDP growth. • Most of India’s imports consist of intermediate goods followed by capital goods. • From 83.5 % in 2001 to just over 75 % in 2007. Capital goods is 15 %. Consumer goods which is also low, hovers around 3 to 4 % currently. fuel imports is about 34 % while the share of fertilizers and food items is about 3 % .
- 32. Future Projections • India’s shipping predict the highest growth in Container movements as more and more bulk cargoes are shipped in containers along with the improvement of India’s infrastructure • More than 50 % of India’s containers end up at the JNPT near Mumbai
- 33. Commodity Annual Growth (%) POL 8.02 Iron Ore 4.36 Coal 15.09 Container Tonnage 23.61 Container in Million TEUs 27.72 Other Cargo 8.90 Table: India - Annual Trade Growth Projections
- 34. China • The most significant driver of trade and shipping in the world today. • Increase in China’s share of world exports is around 39 per cent of the total increase in the share of emerging and developing countries • To secure its energy security -Diversification of sources -Shorten shipping routes by building transnational pipelines 中国
- 35. • Earlier China required 25 VLCCs for its oil from Africa and 24 VLCCs from Gulf to China for its oil needs • By 2020, the requirement will grow to require 58 VLCCs from Gulf and another 53 VLCCs from Africa to carry a total of 4.8 million bpd of crude.
- 36. The African Continent • Spectacular increase in trade & shipping. Africa’s total merchandise trade increased from $217 billion in 1995 to $986 billion in 2008. • Energy accounts for a large proportion of Africa’s primary exports. • From 2010, 16 of the 54 countries in Africa are exporters of oil. In 2010, Africa’s oil production represented 12.4% of the world’s total crude oil output. • A marked shift in trade being directed towards developing countries rather than West Europe and US.
- 37. Analytical Pointers The increasing dependence on energy from Western Asia as production from other regions is already tending to plateau. Hence, the energy traffic to dependent countries to increase significantly with more pressure on the choke points and the existing shipping lanes. Containerization levels rarely tend to cross above the 25 per cent mark making it inevitable for those littorals to invest in ports, inland depots. This in turn, will increase coastal traffic across the region arising from transshipment and coastal connectivity needs. Ship sizes are likely increase in the near future to a certain maximum level.
- 38. Larger container ships currently operate on the main global networks along the equator. While medium and smaller sized ships are forced to operate on feeder routes. P3 Alliance monopoly, with 50% fall in freight rates. Dry bulk and container shipping to and from developing countries are likely to continue to grow. South-South trade is growing while trade with developed countries is declining in importance. More countries will actively try to increase privatization and infusion of foreign companies in the ports building infrastructure.
- 39. Conclusion • Primarily sea borne trade in Indian Ocean is likely to remain diverse and vibrant in the foreseeable future. The emerging patterns of vessel trade across the ocean will be shaped by their economic efficiencies.