Supermarket pricing-strategies4995 (1)
•
0 gefällt mir•523 views

PAZARLAMA YÖNETİMİ 1. GRUP MAKALESİ

Empfohlen
Weitere ähnliche Inhalte
Was ist angesagt?
Was ist angesagt? (19)
Ähnlich wie Supermarket pricing-strategies4995 (1)
Ähnlich wie Supermarket pricing-strategies4995 (1) (20)
Mehr von Mahir İstanbullu
Mehr von Mahir İstanbullu (20)
Kürzlich hochgeladen
Kürzlich hochgeladen (20)
Supermarket pricing-strategies4995 (1)
- 1. informs ® Vol. 27, No. 5, September–October 2008, pp. 811–828 issn 0732-2399 eissn 1526-548X 08 2705 0811 doi 10.1287/mksc.1080.0398 © 2008 INFORMS Supermarket Pricing Strategies Paul B. Ellickson Department of Economics, Duke University, Durham, North Carolina 27708, paul.ellickson@duke.edu Sanjog Misra William E. Simon School of Business Administration, University of Rochester, Rochester, New York 14627, misra@simon.rochester.edu M ost supermarket firms choose to position themselves by offering either everyday low prices (EDLP) across several items or offering temporary price reductions (promotions) on a limited range of items. While this choice has been addressed from a theoretical perspective in both the marketing and economic literature, relatively little is known about how these decisions are made in practice, especially within a competitive envi- ronment. This paper exploits a unique store level data set consisting of every supermarket operating in the United States in 1998. For each of these stores, we observe the pricing strategy the firm has chosen to follow, as reported by the firm itself. Using a system of simultaneous discrete choice models, we estimate each store’s choice of pricing strategy as a static discrete game of incomplete information. In contrast to the predictions of the theoretical literature, we find strong evidence that firms cluster by strategy by choosing actions that agree with those of its rivals. We also find a significant impact of various demographic and store/chain characteristics, providing some qualified support for several specific predictions from marketing theory. Key words: EDLP; promotional pricing; positioning strategies; supermarkets; discrete games History: Received: March 22, 2006; accepted: February 27, 2008; processed by David Bell. 1. Introduction is likely to shop, we know relatively little about how While firms compete along many dimensions, pricing pricing strategies are chosen by retailers. There are strategy is clearly one of the most important. In many two primary reasons for this. First, these decisions retail industries, pricing strategy can be characterized are quite complex: managers must balance the pref- as a choice between offering relatively stable prices erences of their customers and their firm’s own capa- across a wide range of products (often called every- bilities against the expected actions of their rivals. day low pricing) or emphasizing deep and frequent Empirically modeling these actions (and reactions) discounts on a smaller set of goods (referred to as requires formulating and then estimating a complex promotional or PROMO pricing). Although Wal-Mart discrete game, an exercise which has only recently did not invent the concept of everyday low pricing, become computationally feasible. The second is the the successful use of everyday low pricing (EDLP) lack of appropriate data. While scanner data sets was a primary factor in their rapid rise to the top have proven useful for analyzing consumer behavior, of the Fortune 500, spawning a legion of followers they typically lack the breadth necessary for tack- selling everything from toys (Toys R Us) to building ling the complex mechanics of inter-store competi- supplies (Home Depot). In the 1980s, it appeared that tion.1 The goal of this paper is to combine newly the success and rapid diffusion of the EDLP strategy developed methods for estimating static games with could spell the end of promotions throughout much a rich, national data set on store level pricing poli- of retail. However, by the late 1990s, the penetration cies to identify the primary factors that drive pricing of EDLP had slowed, leaving a healthy mix of firms behavior in the supermarket industry. following both strategies, and several others employ- Exploiting the game theoretic structure of our ing a mixture of the two. approach, we aim to answer three questions that Not surprisingly, pricing strategy has proven to be have not been fully addressed in the existing liter- a fruitful area of research for marketers. Marketing ature. First, to what extent do supermarket chains scientists have provided both theoretical predictions tailor their pricing strategies to local market condi- and empirical evidence concerning the types of con- tions? Second, do certain types of chains or stores sumers that different pricing policies are likely to attract (e.g. Lal and Rao 1997, Bell and Lattin 1998). 1 Typical scanner data usually reflect decisions made by only a few While we now know quite a bit about where a person stores in a limited number of markets. 811
- 2. Ellickson and Misra: Supermarket Pricing Strategies 812 Marketing Science 27(5), pp. 811–828, © 2008 INFORMS have advantages when it comes to particular pricing from their rivals, stores choose strategies that match. strategies? Finally, how do firms react to the expected This finding is in direct contrast to existing theoretical actions of their rivals? We address each of these ques- models that view pricing strategy as a form of dif- tions in detail. ferentiation, providing a clear comparative static that The first question naturally invites a market pull future pricing models must address. driven explanation in which consumer demographics Our paper makes both substantive and method- play a key role in determining which pricing strategy ological contributions to the marketing literature. On firms choose. In answering this question, we also the substantive front, our results offer an in-depth aim to provide additional empirical evidence that will look at the supermarket industry’s pricing practices, inform the growing theoretical literature on pricing delineating the role of three key factors (demand, related games. Since we are able to assess the impact supply, and competition) on the choice of pricing of local demographics at a much broader level than strategy. We provide novel, producer-side empiri- previous studies, our results provide more conclusive cal evidence that complements various consumer-side evidence regarding their empirical relevance. models of pricing strategy. In particular, we find qual- The second question concerns the match between ified support for several claims from the literature a firm’s strategy and its chain-specific capabilities. on pricing demographics, including Bell and Lattin’s In particular, we examine whether particular pricing (1998) model of basket size and Lal and Rao’s (1997) strategies (e.g., EDLP) are more profitable when firms positioning framework, while at the same time high- make complementary investments (e.g. larger stores lighting the advantages of chain level investment. and more sophisticated distribution systems). The Our focus on competition also provides a structural empirical evidence on this matter is scant—this is the complement to Shankar and Bolton’s (2004) descrip- first paper to address this issue on a broad scale. Fur- tive study of price variation in supermarket scanner thermore, because our data set includes all existing data, which emphasized the role of rival actions. Our supermarkets, we are able to exploit variation both most significant contribution, however, is demonstrat- within and across chains to assess the impact of store ing that stores in a particular market do not use pric- and chain level differences on the choice of pricing ing strategy as a differentiation device but instead strategy. coordinate their actions. This result provides a direct Finally, we address the role of competition posed challenge to the conventional view of retail compe- in our third question by analyzing firms’ reactions tition, opening up new and intriguing avenues for to the expected choices of their rivals. In particular, future theoretical research. Our econometric imple- we ask whether firms face incentives to distinguish mentation also contributes to the growing literature in themselves from their competitors (as in most models marketing and economics on the estimation of static of product differentiation) or instead face pressures discrete games, as well as the growing literature on to conform (as in network or switching cost mod- social interactions.2 In particular, our incorporation of els)? This question is the primary focus of our paper multiple sources of private information and our con- and the feature that most distinguishes it from earlier struction of competitive beliefs are novel additions to work. these emerging literatures. Our results shed light on all three questions. First, The rest of the paper is organized as follows. Sec- we find that consumer demographics play a signifi- tion 2 provides an overview of the pricing landscape, cant role in the choice of local pricing strategies: firms explicitly defining each strategy and illustrating the choose the policy that their consumers demand. Fur- importance of local factors in determining store level thermore, the impact of these demographic factors decisions. Section 3 introduces our formal model of is consistent with both the existing marketing liter- pricing strategy and briefly outlines our estimation ature and conventional wisdom. For example, EDLP approach. Section 4 describes the data set. Section 5 is favored in low income, racially diverse markets, provides the details of how we implement the model, while PROMO clearly targets the rich. However, a key including the construction of distinct geographic mar- implication of our analysis is that these demographic kets, the selection of covariates, our two-step estima- factors act as a coordinating device for rival firms, tion method, and our identification strategy. Section 6 helping shape the pricing landscape by defining an equilibrium correspondence. Second, we find that 2 Recent applications of static games include technology adop- complementary investments are key: larger stores tion by internet service providers (Augereau et al. 2006), prod- and vertically integrated chains are significantly more uct variety in retail eyewear (Watson 2005), location of ATM likely to adopt EDLP. Finally, and most surprisingly, branches (Gowrisankaran and Krainer 2004), and spatial differenti- ation among supermarkets (Orhun 2005), discount stores (Zhu et al. we find that stores competing in a given market have 2005), and video stores (Seim 2006). Structural estimation of social incentives to coordinate their actions. Rather than interactions is the focus of papers by Brock and Durlauf (2002), choosing a pricing strategy that distinguishes them Bayer and Timmins (2006), and Bajari et al. (2005).
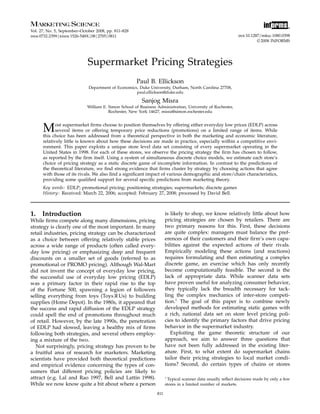
- 3. Ellickson and Misra: Supermarket Pricing Strategies Marketing Science 27(5), pp. 811–828, © 2008 INFORMS 813 provides our main empirical results and discusses Table 1 Descriptive Statistics their implications. Section 7 concludes with directions Variable Obs Mean Std. dev. Min. Max for future research. Strategy EDLP 17 388 0 28 0 45 0 1 2. The Supermarket Pricing HYBRID PROMO 17 388 17 388 0 38 0 34 0 48 0 47 0 0 1 1 Landscape MSA characteristics Size (sq. miles) 333 1 868 31 1 943 99 46 40 11 229 6 2.1. Pricing Strategy Choices Density (pop ’000 333 10 42 9 62 0 91 49 06 Competition in the supermarket industry is a complex per sq. mile) phenomenon. Firms compete across the entire retail Avg. food expenditure 333 663 64 1 201 37 16 04 9 582 09 and marketing mix, enticing customers with an attrac- ($ ’000) tive set of products, competitive prices, convenient Market variables Median household size 8 000 2 66 0 35 1 32 5 69 locations, and a host of other services, features, and Median HH income 8 000 35 255 59 9 753 95 18 109 60 81 954 60 promotional activities. In equilibrium, firms choose Proportion Black 8 000 0 08 0 14 0 00 0 97 the bundle of services and features that maximize Proportion Hispanic 8 000 0 06 0 13 0 00 0 98 Median vehicles in HH 8 000 2 12 0 33 0 56 3 37 profits, conditional on the types of consumers they expect to serve and their beliefs about the actions of Chain/store characteristics Vertically integrated 17 388 0 51 0 50 0 00 1 00 their rivals. A supermarket’s pricing strategy is a key Store size (sqft ’000) 17 388 28 99 16 34 2 00 250 00 element in this multidimensional bundle. Independent store 17 388 0 23 0 42 0 00 1 00 The majority of both marketers and practitioners Number of stores 804 390 15 478 45 1 00 1 399 00 in chain frame a store’s pricing decision as a choice between offering everyday low prices or deep but tempo- rary discounts, labeling the first strategy EDLP and which asked individual store managers to choose the second PROMO (Table 1).3 4 Not surprisingly, which of the following categories best described their the simple EDLP-PROMO dichotomy is too narrow store’s pricing policy: to adequately capture the full range of firm behav- • Everyday Low Price (EDLP): Little reliance on ior. In practice, firms can choose a mixture of EDLP promotional pricing strategies such as temporary and PROMO, varying either the number of categories price cuts. Prices are consistently low across the they put on sale or changing the frequency of sales board, throughout all packaged food departments. across some or all categories of products. Practitioners • Promotional (Hi-Lo) Pricing: Heavy use of spe- have coined a term for these practices—hybrid pric- cials, usually through manufacturer price breaks or ing. What constitutes HYBRID pricing is necessarily special deals. subjective, depending on an individual’s own beliefs • Hybrid EDLP/Hi-Lo: Combination of EDLP and regarding how much price variation constitutes a Hi-Lo pricing strategies. departure from pure EDLP. Both the data and defini- According to Trade Dimensions, the survey was tions used in this paper are based on a specific store designed to allow for a broad interpretation of the level survey conducted by Trade Dimensions in 1998, HYBRID strategy, as they wanted it to capture devia- tions along either the temporal (i.e., number of sales 3 This is clearly a simplification—a supermarket’s pricing policy per year) or category based dimensions (i.e., number is closely tied to its overall positioning strategy. Pricing strategies of categories on deal). We believe that pricing strat- are typically chosen to leverage particular operational advantages egy is best viewed as a continuum, with pure EDLP and often have implications for other aspects of the retail mix. For example, successful implementation of EDLP may involve offering (i.e., constant margins across all categories) on one a deeper and narrower product line than PROMO, allowing firms end and pure PROMO (i.e. frequent sales on all cate- to exploit scale economies (in particular categories), reduce their gories) at the other. This data set represents a coarse inventory carrying costs, and lower their advertising expenses. On discretization of that continuum. the other hand, PROMO pricing gives firms greater flexibility in clearing overstock, allows them to quickly capitalize on deep man- ufacturer discounts, and facilitates the use of consumer loyalty pro- 2.2. Supermarket Pricing: A Closer Look grams (e.g. frequent shopper cards). In other words, the choice of Without observing data on individual stores, it might pricing strategy is more than just how prices are set: it reflects the be tempting to conclude that all pricing strategies are overall positioning of the store. This paper focuses on the pricing determined at the level of the chain. While there are dimension alone, taking the other aspects of the retail mix as given. certainly incentives to choose a consistent policy, the While this is limiting, modeling the entire retail mix is beyond the scope of this paper. data reveals a remarkable degree of local heterogene- 4 Note that we focus on the choice of pricing strategy and abstract ity. To examine the issue more closely, we focus in on away from issues related to more tactical decisions about how prices a single chain in a single market: the Pathmark chain are (or should be) set (see e.g., Kumar and Rao 2006). in New Jersey. Figure 1 shows the spatial locations of
- 4. Ellickson and Misra: Supermarket Pricing Strategies 814 Marketing Science 27(5), pp. 811–828, © 2008 INFORMS Figure 1 Pathmark Stores in New Jersey Table 3 Pricing Strategy by Firm Type % EDLP % HYBRID % PROMO “Large” firms: 41.0 Chain 33 37 30 Vertically integrated 35 36 29 Large store size 32 38 30 Many checkouts 31 39 30 40.5 “Small” firms: Independent 22 28 50 Not vertically integrated 21 32 47 Small store size 23 26 52 40.0 Few checkouts 22 26 52 small chains, using four alternative definitions of 39.5 “large” and small.5 While large chains seem evenly EDLP distributed across the strategies and “small” chains HYBRID seem to favor PROMO, firm size is not the primary PROMO 39.0 determinant of pricing strategy. –75.5 –75.0 –74.5 –74.0 The second noteworthy feature of the Pathmark data is that even geographically proximate stores adopt quite different pricing strategies. While there is every Pathmark store in New Jersey, along with its some clustering at the broader spatial level (e.g. north pricing strategy. Two features of the data are worth versus south New Jersey), the extent to which these emphasizing. We address them in sequence. strategies are interlaced is striking. Again, looking First, Pathmark does not follow a single strategy beyond Pathmark and New Jersey confirms that this across its stores: 42% of the stores use PROMO pric- within-chain spatial heterogeneity is not unique to ing, 33% follow EDLP, and the remaining 25% use this particular example: while some chains clearly HYBRID. The heterogeneity in pricing strategy favor a consistent strategy, others appear quite observed in the Pathmark case is not specific to this responsive to local factors. Broadly speaking, the particular chain. Table 2 shows the store level strate- data reveal only a weak relationship between geog- gies chosen by the top 15 U.S. supermarkets (by raphy and pricing strategy. While southern chains total volume) along with their total store counts. As with Pathmark, the major chains are also surprisingly such as Food Lion are widely perceived to favor heterogeneous. While some firms do have a clear EDLP and Northeastern chains like Stop & Shop are focus (e.g. Wal-Mart, H.E. Butt, Stop & Shop), oth- thought to prefer PROMO, regional variation does ers are more evenly split (e.g. Lucky, Cub Foods). not capture the full story. Table 4 shows the per- This pattern extends to the full set of firms. Table 3 cent of stores that choose either EDLP, HYBRID, or shows the pricing strategies chosen by large and PROMO pricing in eight geographic regions of the United States. While PROMO pricing is most popular in the Northeast, Great Lakes, and central Southern Table 2 Pricing Strategies of the Top 15 Supermarkets regions, it is far from dominant, as both the EDLP and Firm Stores % PROMO % HYBRID % EDLP HYBRID strategies enjoy healthy shares there as well. EDLP is certainly favored in the South and Southeast, Kroger 1 399 47 40 13 Safeway 1 165 52 43 5 but PROMO still draws double digit shares in both Albertson’s 922 11 41 48 regions. This heterogeneity in pricing strategy can Winn-Dixie 1 174 3 30 67 be illustrated using the spatial structure of our data Lucky 813 35 38 27 set. Figure 2 plots the geographic location of every Giant 711 29 60 11 store in the United States, along with their pricing Fred Meyer 821 22 60 18 Wal-Mart 487 1 26 73 Publix 581 13 71 16 5 The four definitions of firm size are: chain/independent, vertically Food Lion 1 186 2 12 86 integrated and not, large/small store, and many/few checkouts. A&P 698 55 30 15 A chain is defined as having 11 or more stores, while an indepen- H.E. Butt 250 1 3 96 dent has 10 of fewer. Vertically integrated means the firm operates Stop & Shop 189 50 43 7 its own distribution centers. Large versus small store size and many Cub foods 375 26 34 40 versus few checkouts are defined by the upper and lower quartiles Pathmark 135 42 25 33 of the full store level census.
- 5. Ellickson and Misra: Supermarket Pricing Strategies Marketing Science 27(5), pp. 811–828, © 2008 INFORMS 815 Table 4 Pricing Strategies by Region Table 5 Local Factors Region % PROMO % HYBRID % EDLP EDLP HYBRID PROMO West Coast 39 39 22 Local demographics Northwest 32 51 17 Median household 2 84 (0.331) 2 81 (0.337) 2 80 (0.329) South West 20 48 32 size South 32 25 43 Median household 34,247 (14,121) 36,194 (15,121) 36,560 (16,401) income Southern Central 45 27 28 Median vehicles 2 12 (0.302) 2 13 (0.303) 2 09 (0.373) Great Lakes 54 29 17 in HH North East 40 37 23 Median age 35 4 (4.59) 35 8 (4.98) 35 7 (4.25) South East 23 37 40 Proportion Black 0 128 (0.182) 0 092 (0.158) 0 110 (0.185) Proportion Hispanic 0 078 (0.159) 0 073 (0.137) 0 070 (0.135) Strategies of rivals strategy. As is clear from the three panels correspond- Percent of rivals using 49 (31) 49 (25) 52 (23) ing to each pricing strategy, there is no obvious pat- same strategy tern: all three strategies exhibit quite uniform cover- Note. The main numbers in each cell are means, standard deviations are in age. Taken together, these observations suggest look- parentheses. ing elsewhere for the primary determinants of pricing strategy. We turn next to the role of market demo- graphics and then to the nature and degree of com- Figure 2 Spatial Distribution of Store Pricing Strategy petition. Table 5 contains the average demographic char- EDLP stores acteristics of the local market served by stores of each type.6 PROMO pricing is associated with smaller households, higher income, fewer automobiles per capita, and less racial diversity, providing some ini- tial support for Bell and Lattin’s (1998) influen- tial model of basket size.7 However, the differences in demography, while intuitive, are not especially strong. This does not mean that demographics are irrelevant, but rather that the aggregate level patterns linking pricing strategy and demographics are not overwhelming. Isolating the pure impact of demo- graphic factors will require a formal model, which we HYBRID stores provide below. The final row of Table 5 contains the share of rival stores in the competing market that employ the same strategy as the store being analyzed. Here we find a striking result: 50% of a store’s rivals in a given loca- tion employ the same pricing strategy as the focal store. Competitor factors also played a lead role in the work of Shankar and Bolton (2004), which ana- lyzed pricing variability in supermarket scanner data. In particular, they note that “what is most striking, however, is that the competitor factors are the most dominant determinants of retailer pricing in a broad PROMO stores framework that included several other factors” (p. 43). Even at this rather coarse level of analysis, the data 6 Roughly corresponding to areas the size of a ZipCode, these “local markets” are defined explicitly in §5.2. 7 Bell and Lattin (1998) find that the most important features of shopping behavior can be captured by two interrelated choices: basket size (how much you buy) and shopping frequency (how often you go). They suggest that large or fixed basket shoppers (i.e. those who buy more and shop less) will more sensitive to the overall basket price than those who shop frequently and will therefore prefer EDLP pricing to PROMO. They present empirical evidence that is consistent with this prediction.
- 6. Ellickson and Misra: Supermarket Pricing Strategies 816 Marketing Science 27(5), pp. 811–828, © 2008 INFORMS reveal that most stores choose similar pricing strate- MSA). Before proceeding further, we must introduce gies to their rivals. This pattern clearly warrants a some additional notation. Stores belonging to a given more detailed investigation and is the focus of our chain c = 1 C, that are located in a local mar- structural model. ket lm = 1 Lm , in an MSA m = 1 M, will be l l Stepping back, three key findings emerge. First, su- indexed using icm = 1 Nc m . The total number permarket chains often adopt heterogeneous pricing of stores in a particular chain in a given MSA is Lm l strategies, suggesting that demand related forces can Ncm = lm =1 Nc m , while the total number of stores sometimes outweigh the advantages of chain level in that chain across all MSAs is Nc = M Ncm . In m=1 specialization. Second, local market factors play a key each local market, chains select a pricing strategy role in shaping demand characteristics. Finally, any (action) a from the three element set K = E H P , empirical analysis of pricing strategy must address where E ≡ EDLP, H ≡ HYBRID, and P ≡ PROMO. the role of competition. While investigating the role If we observe a market lm containing N lm = C Nc m l c=1 of market demographics and firm characteristics is players for example, the set of possible action pro- not conceptually difficult, quantifying the structural lm files is then Alm = E H P Nc with generic element impact of rival pricing strategies on firm behavior alm = a1 a2 aicm l aNclm . The vector of actions of requires a formal game theoretic model of pricing l behavior that accounts for the simultaneity of choices. store icm ’s competitors is denoted a−icm = a1l aicm −1 l In the following section, we embed pricing strategy aic +1 lm aNc lm . in a discrete game that accommodates both local In a given market, a particular chain’s state vec- m m demographics and the strategies of rival firms. We tor is denoted sc ∈ Sc , while the state vector for the m m Ncm m then estimate this model using the two-step approach market as a whole is s m = s1 sNc ∈ c=1 Sc . The developed by Bajari et al. (2005). state vector s m is known to all firms and observed by the econometrician. It describes features of the mar- ket and characteristics of the firms that we assume 3. A Strategic Model of are determined exogenously. For each firm, there are Supermarket Pricing also three unobserved state variables (corresponding A supermarket’s choice of pricing strategy is natu- to the three pricing strategies) that are treated as rally framed as a discrete game between a finite set private information of the firm. These unobserved of players. Each firm’s optimal choice is determined state variables are denoted icm aicm , or more com- l l by the underlying market conditions, its own charac- pactly icm , and represent firm specific shocks to the l teristics and relative strengths, as well as its expecta- profitability of each strategy. The private informa- tions regarding the actions of its rivals. Ignoring strate- tion assumption makes this a game of incomplete gic expectations, pricing strategy could be modeled as or asymmetric information (e.g. Harsanyi 1973) and a straightforward discrete choice problem. However, the appropriate equilibrium concept one of Bayesian since firms condition their strategies on their beliefs Nash Equilibrium (BNE). For any given market, the regarding rivals’ actions, this discrete choice must be l ’s are assumed to be i.i.d. across firms and actions, icm modeled as a system of simultaneous equations. In and drawn from a distribution f icm that is known l our framework, firms (i.e., supermarket chains8 ) make to everyone, including the econometrician. a discrete choice of pricing strategy, selecting among Firms maximize store-level profits, choose pricing three alternatives: everyday low pricing, promotional strategies independently across stores. In market lm , pricing, and a hybrid strategy. While there is clearly the profit earned by store ic is given by a role for dynamics in determining an optimal pric- ing policy, we assume that firms act simultaneously in l icm = l icm s m aicm a−icm + l l l icm (1) a static environment, taking entry decisions as given. where icm is a known and deterministic function of l This static treatment of competition is not altogether states and actions (both own and rival’s). Since the unrealistic since these pricing strategies involve sub- ’s are private information, each firm’s decision rule stantial store level investments in communication and aicm = dicm s m icm is a function of the common state l l l positioning related costs that are not easily reversed.9 vector and its own , but not the private information We assume that competition takes place in “local” of its rivals. From the perspective of both its rivals markets, each contained in a global market (here, an and the econometrician, the probability that a given 8 firm chooses action k conditional on the common state Henceforth, we will use chains and firms interchangeably. 9 vector is then given by As discussed above, pricing decisions are relatively sunk, due to the positioning costs associated with conveying a consistent store- Picm aicm = k = l l 1 dicm s m l l =k f l d l (2) level message to a group of repeat customers. Furthermore, since icm icm icm this is not an entry game, we are not particularly concerned about the possibility of ex post regret that can sometimes arise in static where 1 dicm s icm = k is an indicator function equal l l lm games (Einav 2003). to 1 if store ic chooses action k and 0 otherwise.
- 7. Ellickson and Misra: Supermarket Pricing Strategies Marketing Science 27(5), pp. 811–828, © 2008 INFORMS 817 We let Plm denote the set of these probabilities for a of three assumptions required for identification (we given local market. Since the firm does not observe its discuss our identification strategy in detail in §5.7). competitors actions prior to choosing its own action, In addition, we have assumed that the private infor- l it makes decisions based on its expectations. The mation available to store icm (i.e. icm ) can be decom- l l expected profit for firm icm from choosing action aicm l posed into three additive stochastic components is then m l icm k = c k + c k + l icm k (7) m l icm aicm s l i Plm where icm k represents local market level private l = l aicm s m + l l (3) m icm icm information, c k is the private information that = l s m aicm a−icm P−icm + l l l l (4) a chain possesses about a particular global market icm icm a l −icm (MSA), and c k is a nonspatial component of pri- vate information that is chain specific. Following our where P−icm = j=icm Pj aj s m . Given these expected l l earlier discussion, we assume that icm k is an i.i.d. l profits, the optimal action for a store is then Gumbel error. We further assume that the two remain- ing components are jointly distributed with distribu- l icm = Pr icm l aicm s m + l l icm aicm l m tion function F c k c k , where is a set of parameters associated with F . Denoting the parameter > l ailm s m + l ailm ∀ ailm = aicm l (5) icm c icm c c vector = and letting icm k be an indicator l function such that which is the system of equations that define the (pure strategy) BNE of the game. Because a firm’s optimal 1 if aicm = k l action is unique by construction, there is no need to l k = (8) icm consider mixed strategies. 0 if aicm = k l If the ’s are drawn from a Type I Extreme Value distribution, this BNE must satisfy a system of logit the optimal choice probabilities (conditional on equations (i.e. best response probability functions). m c k c k ) for a given store can be written as The general framework described above has been applied in several economic settings and its properties l icm aicm = k l Plm X m c k c k are well understood. Existence of equilibrium follows E P exp s m k + −ilm m k1 + −ilm k2 + c k + c k directly from Brouwer’s fixed point theorem. = c c To proceed further, we need to choose a particular k∈E H P exp s m k + E −icm k 1 l + P lm k 2 + c k + c −ic m k specification for the expected profit functions. We will l (9) assume that the profit that accrues to store icm from choosing strategy k in location lm is given by while the likelihood can be constructed as m m E P l icm aicm = k s l i Plm = s k+ l −icm k1 + l −icm k2 icm l aicm = k l Plm s m + c k + c k + l icm k (6) c∈C c k m∈M m c k lm ∈Lm ilm ∈N lm c c k where s m is the common state vector of both market m k c k l icm dF m k c k c c (local and MSA) and firm characteristics (chain and store level). The E lm and P lm terms represent the s.t. Plm = lm Plm s m k c k (10) −ic −ic c expected proportion of a store’s competitors in mar- ket lm that choose EDLP and PROMO strategies, Note that the construction of the likelihood involves respectively a system of discrete choice equations that must sat- isfy a fixed point constraint Plm = lm . There are two k 1 main approaches for dealing with the recursive struc- l = Pj aj = k −icm N lm l ture of this system, both based on methods originally j=icm applied to dynamic discrete choice problems. The first, Note that we have assumed that payoffs are a lin- based on Rust’s (1987) Nested Fixed Point (NFXP) ear function of the share of stores that choose EDLP algorithm, involves solving for the fixed point of the and PROMO, which simplifies the estimation prob- system at every candidate parameter vector and then lem and eliminates the need to consider the share using these fixed point probabilities to evaluate the who choose HYBRID H . We further normalize the likelihood. However, the NFXP approach is both com- average profit from the PROMO strategy to zero, one putationally demanding and straightforward to apply
- 8. Ellickson and Misra: Supermarket Pricing Strategies 818 Marketing Science 27(5), pp. 811–828, © 2008 INFORMS only when the equilibrium of the system is unique.10 a general basis: either EDLP, PROMO or HYBRID. An alternate method, based on Hotz and Miller’s The HYBRID strategy is included to account for the (1993) Conditional Choice Probability (CCP) estimator, fact that many practitioners and marketing theorists involves using a two-step approach that is both com- view the spectrum of pricing strategies as more a putationally light and more robust to multiplicity.11 continuum than a simple EDLP-PROMO dichotomy The first step of this procedure involves obtaining con- (Shankar and Bolton 2004). The fact that just over a sistent estimates of each firm’s beliefs regarding the third of the respondents chose the HYBRID option is strategic actions of its rivals. These “expectations” are consistent with this perception. then used in a second stage optimization procedure to obtain the structural parameters of interest. Given the 5. Empirical Implementation complexity of our problem, we chose to adopt a two- The empirical implementation of our framework step approach based on Bajari et al. (2005), who were requires three primary inputs. First, we need to the first to apply these methods to static games. choose an appropriate set of state variables. These will be the market, store and chain characteristics 4. Data Set that are most relevant to pricing strategy. To deter- The data for the supermarket industry are drawn mine which specific variables to include, we draw from Trade Dimension’s 1998 Supermarkets Plus heavily on the existing marketing literature. Second, Database, while corresponding consumer demograph- we will need to define what we mean by a “mar- ics are taken from the decennial Census of the United ket.” Finally, we need to estimate beliefs and con- States. Descriptive statistics are presented in Table 1. struct the empirical likelihood. We outline each of Trade Dimensions collects store level data from every these steps in the following subsections, concluding supermarket operating in the United States for use in with a discussion of unobserved heterogeneity and their Marketing Guidebook and Market Scope publica- our strategy for identification. tions, as well as selected issues of Progressive Grocer 5.1. Determinants of Pricing Strategy magazine. The data are also sold to marketing firms The focus of this paper is the impact of rival pricing and food manufacturers for marketing purposes. The policies on a firm’s own pricing strategy. However, (establishment level) definition of a supermarket used there are clearly many other factors that influence by Trade Dimensions is the government and industry pricing behavior. Researchers in both marketing and standard: a store selling a full line of food products economics have identified several, including con- and generating at least $2 million in yearly revenues. sumer demographics, rival pricing behavior, and mar- Foodstores with less than $2 million in revenues are ket, chain, and store characteristics (Shankar and classified as convenience stores and are not included Bolton 2004). Since we have already discussed the role in the data set.12 of rival firms, we now focus on the additional deter- Information on pricing strategy, average weekly minants of pricing strategy. volume, store size, number of checkouts, and addi- Several marketing papers highlight the impact of tional store and chain level characteristics was gath- demographics on pricing strategy (Ortmeyer et al. ered using a survey of each store manager, conducted 1991, Hoch et al. 1994, Lal and Rao 1997, Bell and by their principal food broker. With regard to pric- Lattin 1998). Of particular importance are consumer ing strategy, managers are asked to choose the strat- factors such as income, family size, age, and access egy that is closest to what their store practices on to automobiles. In most strategic pricing models, the PROMO strategy is motivated by some form of spa- 10 It is relatively simple to construct the likelihood function when tial or temporal price discrimination. In the spatial there is a unique equilibrium, although solving for the fixed point models (e.g. Lal and Rao 1997, Varian 1980), PROMO at each iteration can be computationally taxing. However, con- pricing is aimed at consumers who are either will- structing a proper likelihood (for the NFXP) is generally intractable in the event of multiplicity, since it involves both solving for all ing or able to visit more than one store (i.e. those the equilibria and specifying an appropriate selection mechanism. with low travel costs) or, more generally, those who Simply using the first equilibrium you find will result in mispec- are more informed about prices. The EDLP strategy ification. A version of the NFXP that is robust to multiplicity has instead targets consumers who have higher travel yet to be developed. costs or are less informed (perhaps due to hetero- 11 Instead of requiring a unique equilibrium to the whole game, geneity in the cost of acquiring price information). In two-step estimators simply require a unique equilibrium be played the case of temporal discrimination (Bell and Lattin in the data. Futhermore, if the data can be partioned into distinct markets with sufficient observations (as is the case in our applica- 1998, Bliss 1988), PROMO pricing targets customers tion), this requirement can be weakened further. who are willing to either delay purchase or stockpile 12 Firms in this segment operate very small stores and compete only products, while EDLP targets customers that prefer with the smallest supermarkets (Ellickson 2006, Smith 2006). to purchase their entire basket in a single trip or at a
- 9. Ellickson and Misra: Supermarket Pricing Strategies Marketing Science 27(5), pp. 811–828, © 2008 INFORMS 819 single store. Clearly, the ability to substitute over time competing stores. Intuitively, markets are groups of or across stores will depend on consumer characteris- stores that are located close to one another. To con- tics. To account for these factors, we include measures struct these markets, we used a statistical clustering of family size, household income, median vehicle method (K-means) based on latitude, longitude, and ownership, and racial composition in our empirical ZipCode information.14 Our clustering approach pro- analysis. duced a large set of distinct clusters that we believe Since alternative pricing strategies will require dif- to be a good approximation of the actual markets in fering levels of fixed investment (Lattin and Ortmeyer which supermarkets compete. These store clusters are 1991), it is important to control for both store and somewhat larger than a typical ZipCode, but signifi- chain level characteristics. For example, large and cantly smaller than the average county. As robustness small chains may differ in their ability to effi- checks, we experimented with the number of clus- ciently implement particular pricing strategies (Dhar ters, broader and narrower definitions of the market and Hoch 1997). Store level factors also play a (e.g. ZipCodes and MSAs), as well as nearest neigh- role (Messinger and Narasimhan 1997). For example, bor methods and found qualitatively similar results EDLP stores may need to carry a larger inventory (to (see Appendix B.1). satisfy large basket shoppers), while PROMO stores might need to advertise more heavily. Therefore, we 5.3. Estimation Strategy include a measure of store size and an indicator As noted above, the system of discrete choice equa- variable for whether the store is part of a vertically tions presents a challenge for estimation. We adopt a integrated chain. Finally, since the effectiveness of two stage approach based on Bajari et al. (2005). The pricing strategies might vary by market size (e.g. first step is to obtain a consistent estimate of Plm , the urban versus rural), we include measures of geo- probabilities that appear (implicitly) on the right hand graphic size, population density, and average expen- side of Equation (9).15 These estimates Plm are used ditures on food. to construct the −icm ’s, which are then plugged into l the likelihood function. Maximization of this (pseudo) 5.2. Market Definition likelihood constitutes the second stage of the proce- The supermarket industry is composed of a large dure. Consistency and asymptotic normality has been number of firms operating anywhere from 1 to established for a broad class of two-step estimators 1,200 outlets. We focus on the choice of pricing strat- by Newey and McFadden (1994), while Bajari et al. egy at an individual store, abstracting away from the (2005) provide formal results for the model estimated more complex issue of how decisions are made at here. We note in passing that consistency of the esti- the level of the chain. This requires identifying the mator is maintained even with the inclusion of the primary trading area from which each store draws two random effect terms and , since these vari- potential customers. Without disaggregate, consumer- ables are treated as private information of each store. level information, the task of defining local markets A final comment relates to the construction of stan- requires some simplifying assumptions. In particular, dard errors. Because the two-step approach precludes we assume markets can be defined by spatial prox- using the inverse information matrix, we use a boot- imity alone, a strong assumption in some circum- strap approach instead.16 stances (Bell et al. 1998). However, absent detailed consumer level purchase information, we cannot relax 5.4. The Likelihood this assumption further. Therefore, we will try to be In our econometric implementation, we will assume as flexible as possible in defining spatial markets. that and are independent, mean zero normal Although there are many ways to group firms errors, so that using existing geographic boundaries (e.g. ZipCodes or Counties), these pre-specified regions all share the m F k c k same drawback: they increase dramatically in size c m from east to west, reflecting established patterns of =F c k k ×F c k k (11) population density.13 Rather than imposing this struc- ture exogenously, we allow the data to sort itself by 14 ZipCodes are required to ensure contiguity: without ZipCode using cluster analysis. In particular, we assume that information, stores in Manhattan would be included in the same a market is a contiguous geographic area, measur- market as stores in New Jersey. able by geodesic distance and containing a set of 15 The l ’s are functions of Plm . −icm 16 In particular, we bootstrapped across markets (not individ- 13 One exception is Census block groups, which are about half the ual stores) and held the pseudorandom draws in the simulated size of a typical ZipCode. However, we feel that these areas are too likelihood fixed across bootstrap iterations. To save time we used small to constitute reasonably distinct supermarket trading areas. the full data estimates as starting values in each bootstrap iteration.
- 10. Ellickson and Misra: Supermarket Pricing Strategies 820 Marketing Science 27(5), pp. 811–828, © 2008 INFORMS where both F and F are mean zero normal dis- obtain ˆ 1 , the SML estimate of 1 . Given these esti- tribution functions with finite covariance matrices. mates, and applying Bayes’ rule, the posterior expec- For simplicity, we also assume that the covariance m tation of P aicm = k s c k c k can be obtained via l matrices are diagonal with elements 2 k and 2 k . the following computation For identification, consistent with our earlier inde- pendence and normalization assumptions, we assume l icm aicm = k ˆ l m c k c k m that c P = c P = 0 ∀ c ∈ C m ∈ M. We can then use a simulated maximum likelihood procedure that ˆ m m · l icm c k c k dF c k c k 1 k replaces (10) with its sample analog −1 R R · l ˆ m k c k dF m k c k 1 k icm c c = R−1 R−1 l icm aicm = k l c∈C r =1 m∈M r =1 lm ∈Lm ilm ∈N lm c c (13) m l k Plm s c k c k icm (12) While this expression is difficult to evaluate analyt- ically, the vector of beliefs defined by m In the simulation procedure, c k r and c k r Picm aicm = k = l l l aicm = k ˆ l m k k (14) icm c c are drawn from mean zero normal densities with vari- ances 2 k and 2 k respectively. We use R = R = can be approximated by its simulation analog 500 and maximize (12) to obtain estimates of the struc- tural parameters. Note that the fixed point restriction, Picm aicm = k l l Plm = lm , no longer appears since we have replaced R l aicm = k ˆ l m k k l ˆ m k k r=1 icm c c r icm c c r Plm with Plm in the formulae for E lm and P lm , which R ˆ −ic −ic r=1 l icm m c k c k r are used in constructing icm (see (9)). We now turn l to estimating beliefs. (15) m in which c k c k r are draws from a distribution 5.5. Estimating Beliefs m F c k c k with similar properties to those de- In an ideal setting, we could recover estimates of scribed in §5.4. Again, we use R = 500 simulation each store’s beliefs regarding the conditional choice draws. Recalling that k ∈ K = E H P , we can now probabilities of its competitors using fully flexible k define a consistent estimator of lm as −ic nonparametric methods (e.g. kernel regressions or sieves). Unfortunately, our large state vector makes k −1 l this infeasible. Instead, we employ a parametric ˆ l = Nvm Pj aicm = k l (16) −icm v=c l approach for estimating ˆ −icm , using a mixed multi- l j=icm nomial logit (MNL) specification to recover these first 5.6. Common Unobservables stage choice probabilities (Appendix B.4 provides a While our data set is rich enough to include a large semi-parametric robustness analysis). This is essen- number of covariates upon which firms may condi- tially the same specification employed in the sec- tion their actions, the strong emphasis we have placed ond stage procedure (outlined above), only the store’s on strategic interaction may raise concerns regarding beliefs regarding rivals’ actions are excluded from this the role of unobserved heterogeneity. In particular, reduced form. Note that we do not require an explicit how can we be sure that firms are actually reacting to exclusion restriction, since our specification already the actions of their rivals, rather than simply optimiz- contains natural exclusion restrictions due to the pres- ing over some common features of the local market ence of state variables that vary across stores and that we do not observe? Manski (1993) frames this as chains. the problem of distinguishing between endogenous We implement an estimator similar to (12), but with and correlated effects. Although the presence of both the coefficients on the −icm ’s (i.e. ’s) set to zero. l effects yields collinearity in the linear in means model Let the parameters in the first stage be denoted by that Manski analyzes (i.e. the reflection problem), the 1 = 1 1 17 and the first stage likelihood for a nonlinearity of the discrete choice framework elimi- given store be denoted by icm m nates this stark nonidentification result in our setting. l c k c k . Using a simulated maximum likelihood (SML) approach, we However, the presence of correlated unobservables remains a concern. In what follows, we outline two strategies for handling this problem. The first incorpo- 17 The subscript 1 indicates that these are first stage estimates. rates a fixed effect at the MSA level, while the second