SEO Case Study: How I Increased SEO Traffic & Ranking by 50-60% in 6 Months
2013 AESC Compensation Survey Summary Final
1. 2013 SURVEY OF EQUITY STRUCTURES AND COMPENSATION
AT MEMBER FIRMS
ABOUT THE SURVEY
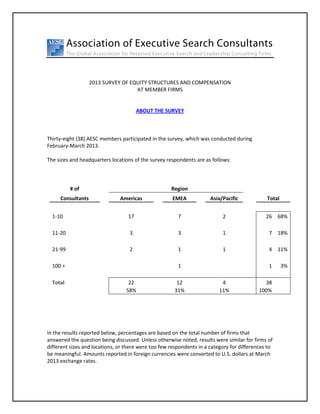
Thirty-eight (38) AESC members participated in the survey, which was conducted during
February-March 2013.
The sizes and headquarters locations of the survey respondents are as follows:
# of Region
Consultants Americas EMEA Asia/Pacific Total
1-10 17 7 2 26 68%
11-20 3 3 1 7 18%
21-99 2 1 1 4 11%
100 + 1 1 3%
Total 22 12 4 38
58% 31% 11% 100%
In the results reported below, percentages are based on the total number of firms that
answered the question being discussed. Unless otherwise noted, results were similar for firms of
different sizes and locations, or there were too few respondents in a category for differences to
be meaningful. Amounts reported in foreign currencies were converted to U.S. dollars at March
2013 exchange rates.
2. 2
EQUITY OWNERSHIP
Current Ownership
45% of the firms are 100% owned by founders; 28% of the firms expect to add other owners
over time.
5% of the firms are 100% owned by consultants other than the founder(s).
55% of the firms are owned by a mix of founders and others. In 38% of these cases, the
founder(s) own 60% or more of the firm. Only 13% firms reported having outside investors who
are not consultants in the firm.
Factors Considered in Inviting a Colleague into Ownership
Respondents rated six factors their firm has considered, or would consider, in deciding to invite
a fellow search professional to become an equity owner. The factors, in order of “Extremely
Important” ratings, were as follows:
Not Considered or Moderately Extremely
Factor Slightly Important Important Important
Revenue generation 5% 11% 84%
Collegiality & attitude 8% 8% 84%
Quality of execution 6% 11% 83%
Industry reputation 17% 25% 58%
Contributions to firm mgmt. 19% 46% 35%
Tenure with the firm 27% 38% 35%
3. 3
Process of Becoming an Equity Owner
How Ownership Passes (see chart below):
53%: Ownership is purchased from individual owners
34%: Ownership is purchased from the firm
13%: Ownership is granted, i.e., no cost to acquire
4. 4
If Ownership is Purchased, How Payment is Made (see chart below):
65%: Individual is responsible for arranging financing
29%: Loan from firm, with repayment tied to future bonuses
10%: Loan from firm, with repayment not tied to future bonuses
13%: loan from bank, co=signed by firm
5. 5
If Ownership is Purchased, When this Occurs:
34% require purchase all at once, and 66% spread it over time, as follows:
18% 12 months
46% 1-3 years
32% 3-5 years
4% 5-7 years
Revenue Generation Required to Share in Ownership
65% of respondents have a minimum revenue generation requirement for becoming an owner,
while 35% do not. The minimum revenue required ranges from $300,000 to $1,000,000, with a
median of $600,000.
While there is overlap, the larger firms tend to have higher revenue generation requirements for
becoming an owner:
Firms with 1-10 consultants: Required revenue ranges from $300,000 to
$1,000,000, median $600,000.
Firms with 11 or more consultants: Required revenue ranges from $300,000 to
$1,125,000, median $600,000.
Process of Selling Equity Interest When Leaving the Firm
71% of respondents said their firms require an owner to sell his or her equity interest when
leaving the firm, 6% do not, and 23% said it depends. “Depends” factors include whether the
individual was a founder, the reason for leaving (termination vs. going to a competitor vs.
retiring), and ongoing connection with the firm. See the chart below.
6. 6
When a selling owner leaves, the legal transfer of shares and payment take place as follows:
Transfer Payment
As soon as possible upon departure 80% 46%
Within 12 months 7% 19%
Within two years 10% 12%
Within three years 3% 12%
Longer than three years 0% 11%
One firm reports that the repayment period mirrors the loan pay down period; i.e., if a partner
took three years to pay for her shares, the firm will pay her back similarly. Another response
stated that the seller gets a check each of four years for 25% of the value at leaving.
7. 7
Some firms treat selling owners/shareholders differently if they leave to join a competitor, with
the following reported:
They forfeit the value of their ownership or suffer some penalty.
The must sell back for $1.00.
Several have noncompete clauses valid for six months to 12 months.
One firm has a two year noncompete covenant. The parting owner gets a note payable
over four years. If that person joins a competitor and services the previous firm’s client,
they would forfeit the remaining payments.
How Ownership is Valued for Buy/Sell Purposes
See the chart below:
8. 8
Revenue as a Basis for Valuation
The most common measure used for valuation purposes is revenue, which is used alone or in
combination with one or more other measures by 44% of the firms. Revenue averaged over
several years is used more often than revenue for a single year, and the average is generally
based on the prior three years.
The lowest multiple of revenue reported was 1.0 and the highest was 5.0; the others ranged
from 1.5 to 3.0 times average revenue.
Book Value as a Basis for Valuation
22% of the firms use book value, either alone or in combination with other measures. Those
who described the formula all said they use a multiple of 1 times book value.
Third-party Valuation
42% of the firms use third-party valuation. Only a few stated that they solely use this approach.
Other Measures
Other measures reported by only a few survey participants include: a range of 3.0 to 6.5 times
EBITDA; EBIT; net asset value; fairness value; and the market value of public companies in the
industry.
9. 9
COMPENSATION
Factors in Determining Performance-Based Annual Compensation
Respondents rated six factors for their importance in determining performance-based annual
compensation at their firm. The results, in order of “Extremely Important” ratings, were as
follows:
Not Considered or Moderately Extremely
Factor Slightly Important Important Important
Revenue generated (individual has 5% 14% 81%
primary responsibility)
Revenue generated (individual plays 18% 38% 44%
support role, part of team)
Number of searches completed 34% 28% 38%
Number of searches executed
(individual has primary responsibility) 33% 35% 32%
Contribution to firm projects 40% 36% 21%
(marketing, administration, etc.)
Number of searches executed 41% 47% 12%
(individual plays support role,
part of team)
Other factors mentioned as important were: the individual’s contribution to profitability; overall
firm financial performance; and performance of the individual as a trusted advisor to the client.
Number of Searches Executed and Revenue Achieved
Two new questions were added for the 2013 survey that were not in previous surveys: the
number of searches executed and the total revenue for these searches.
At the execution level (the level of employees below owner and with no business development
responsibility), how many searches do they complete per year? Most respondents could be
10. 10
grouped around 9-15 searches per year, with most averaging 12 searches per year. However,
about 23% of the respondents said they could expect these employees to complete up to 20
searches per year.
In terms of the revenue generated at this level, after removing the outliers at the top and
bottom, most respondents would be grouped between $500,000 and $1 million in revenue
generated by these employees.
When calculated, it appears that the average fee per search at this level is $50,000, and the
median is $50,000.
Approach for Determining the Performance-Based Component of Annual Compensation
22%: Exclusively quantitative
56%: Largely quantitative, adjusted for qualitative factors
22%: Largely qualitative, adjusted for quantitative factors
No firms reported using an exclusively qualitative approach.
Percentage of Annual Compensation Tied to Performance in a Given Year
This question asked about the percentage of a colleague’s total annual compensation that is tied
to that colleague’s performance in a given year (i.e., the bonus divided by the sum of the annual
salary plus bonus) for four types of colleagues: new performers, modest performers, average
performers, and the firm’s best performers.
A few respondents said that 100% of compensation is performance-based for all levels of
consultants. For others, the performance component generally increased across levels:
New employees: 0% to 100% performance-based in most cases (median 15%)
Modest and average performers: 7.5% to 100% performance-based in most
cases (median 30%)
Best performers: 17.5% to 100% or more performance-based in most cases
(median 60%)
Additional Compensation for Owners
50% of respondents said that ownership makes no difference in determining annual
compensation, 50% said owners make more, and none said owners make less.
In addition to annual compensation (salaries/draws and bonuses), 81% of the firms’ owners
receive other income as a result of their ownership interest, while 19% do not. For those
receiving extra, 54% receive dividends, and 46% receive profit sharing specifically reserved for
owners.
11. 11
Typical Annual Compensation for Consultants in Relation to Revenue Generated
The survey asked how much a consultant generating revenue of $250,000, $500,000,
$1,000,000, and $2,000,000 would earn in salary, bonus, and as a total. These amounts as a
percentage of revenue generated were calculated after the surveys were submitted.
Median consultant compensation is approximately 45% of revenue generated, across all four
revenue levels:
Compensation in Relation to Revenue Generated
Revenue Generated
$250,000 $500,000 $1,000,000 $2,000,000
Median Compensation
Amount $100,000 $200,000 $450,000 $1,000,000
As a % of Revenue 40% 40% 45% 50%
% from Salary 75% 54% 36% 28%
% from Bonus 25% 46% 64% 72%
Compensation Range*
Low $s $66,500 $130,000 $340,000 $490,000
High $s $150,000 $300,000 $600,000 $1,275,000
Low % of Revenue 27% 27% 34% 25%
High % of Revenue 60% 60% 60% 64%
* Excludes single lowest and highest in each group.
12. 12
Median payouts tend to be higher for the larger firms than the smaller firms:
Revenue Generated
Salaries for Associates and Researchers
Respondents were asked to indicate the lowest and highest salaries paid to associates and
researchers at their firm. For associates, these are:
Salaries for Associates
____________________________________________
Lowest Highest
Median $60,000 $120,000
Range*
Low $5,000 $8,000
High $125,000 $250,000
*Excludes single lowest and highest in each group
Associates’ median pay levels do not vary significantly with firm size:
Salaries for Associates by Firm Size
____________________________________________________
Lowest Highest
1-10 Consultants $60,000 $105,000
11+ Consultants $65,000 $100,000
*Excludes single lowest and highest in each group
# of Consultants $250,000 $500,000 $1,000,000 $2,000,000
1-10 40% 40% 45% 37%
11 and up 40% 45% 50% 50%
13. 13
Salaries for Researchers are as follows:
Salaries for Researchers
____________________________________________________
Lowest Highest
Median $48,000 $65,000
Range*
Low $3,000 $7,000
High $80,000 $120,000
*Excludes single lowest and highest in each group
Researchers’ median pay levels do not vary significantly with firm size. They are:
Salaries for Researchers by Firm Size
____________________________________________________
Lowest Highest
1-10 Consultants $50,000 $60,000
11+ Consultants $40,000 $65,000
*Excludes single lowest and highest in each group
14. 14
COMMENTS AND ADVICE
At the end of the survey, respondents were asked what aspects of their ownership and annual
compensation program are the most effective, what aspects generate criticism, and what advice
they would give to the founders of a new firm on their approach to ownership and
compensation.
What Aspects Are the Most Effective?
A number of those responding said that their compensation system is effective because it is
performance-related and based on a clear formula. Some mentioned that the commission plan
focuses attention on individual performance, while others that their plan fosters teamwork
rather than competition. Other effective aspects mentioned include: based on quantitative
results; adequately rewards revenue generation and execution; consistency, targets, and clear
measurements; and incentives to deliver high client value for every position in the company.
Firms with the possibility to share ownership mentioned that as effective in rewarding loyalty
and long service.
What Generates Criticism?
Few of the respondents reported significant criticism, other than to note that everyone always
wants more, with one respondent saying their consultants want 100% of their billings. A few
mentioned complaints with not providing a salary and another that there are no guarantees.
One respondent noted that their firm’s compensation program discouraged collaboration
because it is so focused on the individual’s performance. Another firm said that they receive
complaints from consultants who bring in business but are not offered shares because they do
not have a collaborative work style.
Advice to Founders of a New Firm:
Performance-based pay:
“The more variable, the better.”
“Set up the ground rules early, and be clear on the different levels for each type of
employee.”
“Establish accelerators in the bonus structure.”
“Place more emphasis on business development and less on execution.”
“Create incentive plans that reward collaborative effort, pay a strong base to attract
high caliber individuals and hold them to a high standard to earn the base. The more "at
risk" comp the less likely you can attract performers with the appropriate balance of
15. 15
quality versus revenue generation. Bonus plans should reward group and individual
effort.”
“To really think this through even if they are not ready for it so as to have a plan in place
to reward and retain top talent - and to recruit talent that ultimately has an interest in
being the next generation of ownership.”
Ownership:
“Link ownership to consistent contribution to the growth of the firm and participation in
hits management.”
“Make sure the founders agree philosophically—use the best and worst years as
examples”
“Purchase buy out insurance when you start the firm. Bring partners in quickly as soon
as they establish themselves as good people to work with and reasonable revenue
generators on an established formula that reviews the value of the company (and
shares) on an annual basis.”
“Make the repayment conditions tighter for when someone leaves to work for a
competitor.”
“Make ownership a mutual expectation and a mutual obligation. Because we did not do
that at the outset, we created some hurdles—strategic, financial, collegial—that we
otherwise might have avoided. Ten years later it is still a struggle, and it has not gotten
any less complicated.”
“Not everyone thinks like you think. Not everyone wants to be an owner. Don't make
people buy stock who don't want to own or manage.”
Other comments:
“Many of these questions do not relate to our firm. Our compensation structure is 100%
dependent on which role(s) an individual plays with a search. There are no salaries or
discretionary components. Everyone knows exactly what they will earn based on the
aspects of work they perform for a specific search.”
“Given average fee levels appear to be falling, the achievement of revenue targets
become more difficult year on year.”
For questions about this survey, contact:
Brian J. Glade
AESC
bglade@aesc.org
212.398.9556 ext. 226