1. 1
Case Study in Applied Math
The forecasting of monthly exceedance probabilities of solar radiation in Arizona
Indiana University
Zizhao Li, Kang Feng
liziz@indiana.edu; kfeng@indiana.edu
1 Background
For decades, every country spent progressively more time and capital to find any
methods about renewable resources collection because the non-renewable resources,
like petroleum, were gradually exhausted. So in our project, we are trying to use the
information related to solar radiation in Arizona and to figure out some important
probabilities, such as exceedance probabilities, so that we can demonstrate to financial
backers how to consider the risks that arise from the uncertainty of weather when
deciding whether or not to build new renewable power stations in Arizona. For details,
we need to think what is the expected value of solar radiation in the coming year; how
the annual solar radiation distribution looks like; if there are any outliers in the data set;
what is the reason that causes those outliers; what is the probability of this reason
happened.
2 Abstract
We collect data from the website: http://ag.arizona.edu/azmet, which is the Arizona
Meteorological Network. And we pick five datasets from different stations which are
located at different positions in Arizona: North, South, East, West and Central. There are
several variables from our collected datasets. For simplicity, we just pick the date and
daily solar radiation as the independent and dependent variables for our testing. After
that, we separate one dataset by years into forecasting group and testing group. The
forecasting group is the data before 2011 and the testing group is the data from 2011 to
2014. Then, we build the monthly solar radiation distributions of forecasting group and
normalize them by cube the measurements so that we could assume our distributions
are “normal” distributions. We design three different levels of exceedance probabilities
for each monthly distribution and get the real exceedance probability from the testing
group by using the traditional way ---- relative frequency. Finally, we draw the simple
linear regression of the predicted exceedance probabilities and the real exceedance
probabilities and figure out the residuals and the R-squared to evaluate if they are good
fit enough. We use same steps for other four datasets and get the relative results so
that to compare them to get the conclusion if it is good choice for the financial backers
to build power stations in Arizona.
2. 2
3 Discussion & Procedure
3.1 The definition of exceedance probability
The purpose of this case is to calculate some exceedance probabilities that would
demonstrate to financial backers how to consider the risks that arise from the
uncertainty of weather when deciding whether or not to build new solar power stations.
So the question how to define the EXCEEDANCE PROBABILITY should be solve first
before we start to analysis. From the website: http://ecan.govt.nz/, the definition of
exceedance probability is:
The Annual Exceedance Probability is the chance or probability of a natural hazard event
(usually a rainfall or flooding event) occurring annually and is usually expressed as a
percentage. Bigger rainfall events occur (are exceeded) less often and will therefore have
a lesser annual probability.
For example:
2% exceedance probability rainfall event: A 2% Annual Exceedance
Probability rainfall event has a 2% chance of occurring in a year, so once
in every 50 years.
20% exceedance probability rainfall event: A 20% Annual Exceedance
Probability rainfall event has a 20% chance of occurring in a year, so once
in every 5 years.
So in this case, the exceedance probability of solar radiation should be the probability of
daily radiation below an expected value which we defined by our case model in a given
period.
3.2 The preliminary design – data
In the Arizona Meteorological Network, there are 27 meteorological stations around the
Arizona. It is unnecessary and useless to compute all stations because some stations are
really closed to each other and the difference between radiations would be very tiny.
The main reason of the difference of solar radiations between stations is the geography
since it is mountainous area in the central and north of Arizona and is plain in the other
direction area. On the other hand, the stations were built at different times. So the
historical data would also be another factor for choosing stations in our testing. Finally,
we choose five main stations in different positions: Coolidge (central), Safford (east),
Phoenix Encanto (north), Maricopa (west), and Tucson (south). The data from each
station are separated to hourly data and daily data, and the hourly data has 18 variables
and daily data has 28 variables. We choose daily data since it would be more fit to our
analysis model. The variables of daily data are YEAR, DAY OF YEAR (DOY), STATION
NUMBER, AIR TEMP-MAX, WIND SPEED, and so on. We used the DOY, SOLAR RAD-
TOTAL, AIR TEMP-MEAN, 4” SOIL TEMP-MEAN and WIND SPEED variables to build our
model at the beginning. However, the relationship between SOLAR RAD-TOTAL and
other variables excepted DOY are very weak. For simplicity, we delete other variables
3. 3
and only use the DOY (day) and SOLAR RAD-TOTAL (MJ/m2) in our model. While we
were collecting the data from website, we found that there are many data with value
999 which is meant missing value in the two variables. So another job for us is to clear
those missing value data in order to clear the error data in the database.
3.3 The preliminary design – Time series
In general, people prefer to use the time series model to forecast the exceedance
probability in our case. Unfortunately, we rejected the time series model for our case by
several reasons.
First, the time series is too advanced topic for us and outside our team’s
knowledge. We tried to use the time series in our case and learned it from
Google and YouTube. Even though we learned for a long time, we still could not
get a good enough model for computing the exceedance probability.
Second, the difficulty with time series is that the data is overfitting in the model.
We used the daily data in the time series so there are about 10,000
measurements which is overfitting and leading the result to a wrong answer.
Third, we are not sure about math used in modeling via time series.
3.4 The preliminary design – normalized distribution & simple linear regression
After we rejected the time series, we decided to use the normalized distribution &
simple linear regression to design our analysis model. Often, we use the historical
dataset to predict the data in coming year and we could test the result by compare the
predication and the data in latest year, for instance, as we use the data which are before
2014 to predict the data in 2014. On the other hand, the daily data is overfitting for our
model, so we transfer the daily data to monthly data and use the monthly data into our
testing. We compute the real exceedance probability by using relative frequency
method. However, there are only about 30 measurements in each month and the
exceedance probability is really small in general. The size of real dataset is too small to
get a good enough result to compare the predicted exceedance probability. For
example, if we get the predicted exceedance probability for May is 1% and there are 31
measurements in May, we assume the first situation is the exceedance measurement is
one in May and the second situation is the exceedance measurement is zero. The real
exceedance probability of first situation would be about 3.23% and the probability of
second situation would be 0%. Both results would have relative large error for here. So
we change the rule that use the data which are before 2011 as the forecasting group
and use the data which are from 2011 to 2014 as the testing group to figure out the real
exceedance probability. We use the normalized distribution to forecast the predicted
exceedance probability because we assume the measurements are i.i.d. and random. So
we could use the CDF of Normal Distribution to predict the exceedance probability by
given exceedance bound into the distribution. After that, we use the Excel to build the
simple linear regression between the predicted exceedance probability and the real
exceedance probability in order to evaluate if the result is good.
4. 4
3.5 Normalized distribution
As I mentioned above, we collect the five datasets from the stations which located
different positions. We pick the Coolidge station as the simple station because Coolidge
is located in the central of Arizona and the station has abundant data from 1987 to
present. Based on the data set, we set that:
Let Xi = a random variable which is the daily solar radiation (MJ/m2
) in one year
i = 1, 2, … , 365; Range(X) є [0, 50]
First of all, we need to see the general trend of the solar radiation failing on the
Coolidge in one year so that we could get the initiatory analysis.
Take the sample data, data of Coolidge from 1987 to 2010 in April, and assume that:
Our data is a simple random sample X1, X2, … Xn i.i.d. ~ X with n = 30×24(years between 1987 and 2010)
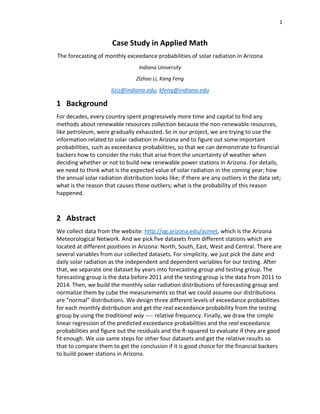
We use the Excel to draw a Monthly average daily solar radiation of the forecasting
group of Coolidge:
Figure 3.5.1
The format of sample month, April, is:
average daily solar radiation in April: µ =
∑ 𝑥𝑖
𝑛
𝑖=1
𝑛
, 𝑖 = 1, 2, … , 𝑛
X-axis is month; Y-axis is the monthly average daily solar radiation (MJ/m2
)
As the Figure 3.5.1 showing, we use same format to compute the average daily solar
radiation in other months and the solar radiation is seasonal which it is maximized in
June and minimized in December. This graph is reasonable to show the daily solar
radiation in the real world. However, since the difference of solar radiation in June and
December is too large for our testing, it is hard to set same exceedance boundary for
0
5
10
15
20
25
30
35
1 2 3 4 5 6 7 8 9 10 11 12
solarradiationMJ/m^2
month
Monthly solar radiation data of Coolidge
monthly average daily solar radiation
5. 5
every month in the figure 3.5.1. For instance, as the green line in the figure 3.5.1, if we
set the exceedance boundary is 10 MJ/m2, then we have large different exceedance
probabilities of each month: the probability of June is about 33% but the probability of
December would be almost 100%. This bound totally does not make any sense. So how
to make a reasonable common rule for the exceedance boundary in the test? As we
mention in abstract, we are going to cube the measurements in later experiment. So we
need to find a relative stable parameter as the base of our boundaries. Mean is unstable
and mode is relative unreasonable, so we decide to set up three different levels of
exceedance probability based on the median, which are 25% below the median, 50%
below the median, and the 75% below the median:
Let M denote the median of daily solar radiation in given month
b1 = (1-25%)×M ; b2 = (1-50%)×M ; b3 = (1-75%)×M
bi is the different level of exceedance probability in the real data
In other words, given the exceedance boundaries 75%M, 50%M and 25%M for each
month, if any measurement below the exceedance bound, we realize that the
measurement is an exceedance data and count it into the exceedance probability. Of
course, we will have more discussion about the median boundary in the later test.
After we defined our monthly exceedance boundaries, we need to think about how the
variable X distributed in each month. We move the data from Excel to SPSS which is
similar to Excel but is more powerful so that we could use the SPSS to create the
monthly distribution in details. For easier to see the distribution of solar radiation in
each month. We set the X-axis is the daily solar radiation and the Y-axis is the frequency
of each bar:
Figure 3.5.2 Figure 3.5.3
Figure 3.5.2 and figure 3.5.3 are the monthly distributions of Coolidge in January and
June. Since both figures are obvious left-skewed, we need to normalize the distribution
by ladder of powers (Applications, Basics, and Computing of Exploratory Data Analysis,
354 pp.). To use the ladder of powers, visualize the original, untransformed data as
6. 6
starting at θ=1. Then if the data are right-skewed (clustered at lower values) move
down the ladder of powers (that is, try square root, cube root, logarithmic, etc.
transformations). If the data are left-skewed (clustered at higher values) move up the
ladder of powers (cube, square, etc):
T: X'=Xθ
(where X' is the transformed X)
For here, we square and cube the measurements and rebuild the distributions to see if
the distributions are more normalized:
Figure 3.5.4 Figure 3.5.5
Based on figure 3.5.4 and figure 3.5.5, as Ɵ increasing, the distributions of data of June
become more normalized. For more convinced, we use the Excel to record the mean,
median, standard deviation of each powered distribution. Like:
Table 3.5.6
Pearson′
s 2nd Skewness Coefficient SK =
3 × (𝑚𝑒𝑎𝑛 − 𝑚𝑒𝑑𝑖𝑎𝑛)
𝑠𝑡𝑎𝑛𝑑𝑎𝑟𝑑 𝑑𝑒𝑣𝑖𝑎𝑡𝑖𝑜𝑛
; 𝑖𝑛 𝑢𝑛𝑖𝑡𝑠 (𝑀𝐽/𝑚2
)3
month mean median standard deviation Pearson's 2nd Skewness Coefficient Sk
1 1949.71 2092.24 998.72 0.43
2 4048.22 4177.17 2142.18 0.18
3 9313.77 9903.76 4212.86 0.42
4 17610.86 18378.84 5476.07 0.42
5 24335.04 25724.63 6253.95 0.67
6 27116.84 28484.40 6392.55 0.64
7 19506.54 20808.22 7197.31 0.54
8 14995.33 16079.34 5351.90 0.61
9 10399.65 10808.52 3436.68 0.36
10 6041.45 6290.64 2391.57 0.31
11 2725.97 2803.22 1208.05 0.19
12 1537.13 1672.45 760.24 0.53
Summary statistics of CUBE of solar radiation, shown by monthly
7. 7
The absolute of Person’s 2nd Skewness Coefficient Sk is the measurement which to
measure the skewness of distribution. As the absolute value decreasing, the distribution
would be more symmetrical. The absolute value of average Person’s 2nd Skewness
Coefficient Sk of square_rad distribution is 0.63 and the absolute value of cube_rad
distribution is 0.44. SCcube<SCsquare → the distribution of cube_rad is more symmetrical
compare with distribution of square_rad. But increasing power of the measurements
does not always be better. As the power increasing, the Relative Standard Deviation is
also increased which indicates that variability is increased in the data set.
%RSD =
𝑠
𝑥̅
× 100; 𝑤ℎ𝑒𝑟𝑒 𝑠 𝑖𝑠 𝑆𝑡𝑎𝑛𝑑𝑎𝑟𝑑 𝑑𝑒𝑣𝑖𝑎𝑡𝑖𝑜𝑛, 𝑥̅ 𝑖𝑠 𝑡ℎ𝑒 𝑚𝑒𝑎𝑛
So if the power is too large, instead, we would get a worse distribution for our testing.
This reason lead us to use the cube_rad distribution for forecasting rather than higher
power distribution.
In this step, we already get the transformed models (e.g. figure 3.5.5) from the statistics
models (e.g. figure 3.5.3 and figure 3.5.2). However, transformed model is not our final
goal in our case. We need to use the transformed model to predict what the real model
looks like. For simplify, we use the transformation map:
Xfrequency_distribution → Ytransformed_distribution; the measurement yi = xi
3
for i = 1, 2, …, n.
We give the assumption that:
The measurement yi is i.i.d to N(µy, δy
2
)
Where µy is the mean of and δy
2
is the variance of transformed distribution
which is the cube_rad distribution Y.
Then, we do:
Ytransformed_distribution → X’predicted_distribution; X’ is the distribution which we predict for real.
We state that the median is more stable parameter in mode, mean and median and we
use that as the base of the boundaries. Since Ytransformed_distribution is normal distribution,
so µy = My, and My = Mx’
3 where My is the median of Y and Mx’ is the median of predicted
distribution. The boundaries are:
b1 = 0.75×Mx’; b2 = 0.5×Mx’; b3 = Mx’; bi is the boundaries of predicted distribution→
B1 = b1
3
; B2 = b2
3
; B3 = b3
3
; Bi is the boundaries of transformed distribution
Then, we compute the exceedance probabilities by using CDF of Normal Distribution:
Pexceedance = ∫
1
√2𝜋𝛿 𝑦
𝐵 𝑖
−∞
∙ 𝑒
−
(𝑦−𝜇 𝑦)
2
2𝛿 𝑦
2
𝑑𝑦 ; 𝑤ℎ𝑒𝑟𝑒 𝐵𝑖 𝑖𝑠 𝑡ℎ𝑒 𝑏𝑜𝑢𝑛𝑑𝑎𝑟𝑖𝑒𝑠
By using this way, the table of the simple predicted exceedance probabilities is like:
8. 8
Table 3.5.7
Based on this table 3.5.7, the trend of each level of predicted exceedance probability is
keeping decreasing until June and return to higher during the rest period. But there are
still some complicated problems which we could not get the conclusion why those issue
here. For instance, the extent of decreasing from January to June is slow but it changes
to really large when the July coming; then the probability goes slightly lower after July
until September. In fact, this is not a special problem which only issues in the sample
model. It issues in all predicted exceedance probability tables from other stations. What
is the reason that cause this situation happens? If this reason is related to our testing
design? Those questions maybe the mystery in our case.
3.6 Simple linear regression
We use the CDF of the normalized distribution to predict the exceedance probabilities
based on the forecasting group and get the relative reasonable probabilities table 3.5.7.
On the other hand, how to compute the real exceedance probabilities become our next
problem. First of all, we cannot use the same way to figure out the real exceedance
probabilities because this will lead us to get an absurd conclusion – we will get a pretty
good R-squared but it doesn’t make any sense. Second, for more precise result,
redundant assumptions are unnecessary in here. We could just give the assumption that
the measurements are independent to each other. Third, the simpler the clearer.
Relative frequency would be the best way to compute the real exceedance probabilities
because it is the simplest way and it is more reasonable for figuring out the real
probabilities.
We separate the testing group to monthly and count the total measurements in each
month. As I mentioned above, we have some missing data in our original dataset so that
we have different number of effective measurements in each month. Of course, the real
total days in each month also are different. Since we already get the predicted
probabilities table 3.5.7, so the best way to compare the predicted result with the real
month 25%level 50%level 75%level
1 12.953% 4.380% 2.732%
2 13.730% 4.911% 3.143%
3 10.060% 2.653% 1.477%
4 3.150% 0.245% 0.077%
5 1.224% 0.033% 0.006%
6 0.710% 0.010% 0.001%
7 5.857% 0.886% 0.382%
8 5.263% 0.711% 0.291%
9 4.011% 0.405% 0.145%
10 7.209% 1.354% 0.645%
11 9.602% 2.417% 1.317%
12 12.122% 3.843% 2.328%
Simple predicted exceedance probability of cube_rad distribution
9. 9
set is also building a real monthly exceedance probabilities table by using the number of
total measurements and the boundaries of the predicted distribution.
Set the total number of measurements in given month is Ni, i = 1, 2,…, 12. Where i is the month
Let Yi, j = the daily solar radiation failing on Arizona in given month i; j = 1, 2, … , Ni
𝑃𝑒𝑥𝑐𝑒𝑒𝑑𝑎𝑛𝑐𝑒 =
𝑐𝑜𝑢𝑛𝑡 𝑚𝑒𝑎𝑠𝑢𝑟𝑒𝑚𝑛𝑡 𝑖𝑓 𝑌𝑖,𝑗 < 𝑏 𝑘
𝑁𝑖
, where i = 1, 2, … 12 & j = 1, 2, … 𝑁𝑖
bk is the boundary of un transformed data which we defined above; k = 1, 2, 3
The sample table of real exceedance probabilities:
Table 3.6.1
It is obvious that most real exceedance probabilities from the table 3.6.1 are higher than
the relative predicted exceedance probabilities. Be more visualized, we choose the
25%level probabilities from two tables, table 3.5.7 and table 3.6.1, and make a
histogram to compare those two results.
month 25%level 50%level 75%level
1 15.323% 6.452% 1.613%
2 16.964% 8.929% 1.786%
3 10.484% 4.032% 0.806%
4 7.500% 3.333% 0.000%
5 3.226% 0.806% 0.000%
6 6.667% 0.833% 0.000%
7 8.065% 2.419% 0.000%
8 8.871% 2.419% 0.806%
9 9.167% 1.667% 0.833%
10 15.323% 3.226% 1.613%
11 7.500% 3.333% 0.833%
12 17.600% 6.400% 1.600%
Simple real exceedance probability of cube_rad distribution
10. 10
Figure 3.6.2
The real probabilities are greater than the predicted probabilities except November. On
the other hand, the trend of real result is a little bit different to the predicted result.
Mostly, they have similar trend but the real bar decreases in November which must be
caused by some reasons. On the above discussion, we delete the missing value data
from our dataset and number of those data is not negligible. In fact, most of missing
value data are concentrate on several specific months. November is one of them. So
give an assumption, in general, we should count totally 120 measurements from
November and there are 12 missing value measurements which were deleted by data
cleaning. In these 12 measurements, there are precisely 10 of them exceeded the
boundary but we do not count that and this would lead our real exceedance probability
in that month to be very lower than the true probability. So the missing value may be
the factor that impact our computing of real probability. On the other hand, even after
transforming the data by cube, the distributions still have some skewness to the left. So
this means that our predictions are conservative.
In the end, based on table 3.5.7 and table 3.6.1, we make the predicted exceedance
probabilities as the independent variable and the real exceedance probabilities as the
dependent variable to build the simple linear regression. Since we have three different
levels, so we try to build the regressions separately. Take the 25% level dataset as an
example:
Let Xi = the 25% level predicted exceedance probabilities in given month i; i = 1, 2, … , 12
Let Ŷi = the 25% level real exceedance probabilities in given month i; i = 1, 2, … , 12
Xi from the table 3.5.7; Ŷi from the table 3.6.1
0.000%
2.000%
4.000%
6.000%
8.000%
10.000%
12.000%
14.000%
16.000%
18.000%
20.000%
1 2 3 4 5 6 7 8 9 10 11 12
probability
month
histogram of 25% level probabilities
predicted 25%level P real 25%level P
11. 11
𝑡ℎ𝑒 𝑠𝑖𝑚𝑝𝑙𝑒 𝑟𝑒𝑔𝑟𝑒𝑠𝑠𝑖𝑜𝑛 𝑓𝑢𝑛𝑐𝑡𝑖𝑜𝑛 𝑜𝑓 25% 𝑙𝑒𝑣𝑒𝑙: 𝑌𝑖
̂ = 𝛼̂ + 𝛽̂ ∙ 𝑋𝑖 →
𝑡ℎ𝑒 𝑒𝑠𝑡𝑖𝑚𝑎𝑡𝑒𝑑 𝑟𝑒𝑔𝑟𝑒𝑠𝑠𝑖𝑜𝑛 𝑚𝑜𝑑𝑒𝑙 𝑜𝑓 25% 𝑙𝑒𝑣𝑒𝑙: 𝑌𝑖 = 𝛼̂ + 𝛽̂ ∙ 𝑋𝑖 + 𝑒𝑖̂
Follow this steps, we use the Excel and get the regression models for each level of
exceedance probability:
Figure 3.6.3
Obviously, the R-squared of each level’s regression statistics is really complicated to
others. As the figure 3.6.3 showing, the R Square of 50% level is the highest in this three
levels and the R Square of 75% level is the lowest. We think the reason which cause this
situation could be explained by the shape of the distributions. Back to section 3.5 and
see the figures about the distributions, if we compare the figure 3.5.2 and figure 3.5.3,
we could see that the shape of distribution of solar radiation in June is narrow and the
shape of distribution of January is relative wide. Check all other months’ distributions,
the shape of distribution is narrower if period close to June and wider if the period close
to December. So we think that maybe the shape of the distributions is the reason.
Unfortunately, when we figure out other stations regressions, we find that the R square
of 50% level is the highest in the three levels is not the common rule. For Aguila station,
the level which has the highest R square is the 75% level. Dramatically, the R square of
50% level is the lowest value in these three R squares. So the shape reason is rejected.
For other possible reasons, we consider that maybe the simple size and the missing
measurements would be reasons which cause the complicated R square. For solving
this problem, we decide to use the combined probabilities to build single linear
regression. This is meant that we will use the 36 probabilities from predicted table 3.5.7
as independent variable and other 36 probabilities
from real table 3.6.1 as the dependent variable.
Then the regression statistics changes to this:
Figure 3.6.4
In this way, we get a more reasonable R square which is similar to most other stations’ R
square. We use this data set to build the linear regression:
Regression Statistics Regression Statistics Regression Statistics
Multiple R 0.82 Multiple R 0.95 Multiple R 0.80
R Square 0.68 R Square 0.89 R Square 0.64
Adjusted R Square 0.65 Adjusted R Square 0.88 Adjusted R Square 0.61
Standard Error 0.03 Standard Error 0.01 Standard Error 0.00
Observations 12 Observations 12 Observations 12
25%level 50%level 75%level
Regression Statistics
Multiple R 0.91
R Square 0.83
Adjusted R Square 0.82
Standard Error 0.02
Observations 36
combined probabilities
12. 12
Figure 3.6.5
The R square of the simple linear regression is 0.83, which means that the variation of
predicted exceedance probability around its mean explains about 83% of the variation
of real exceedance probability in the linear regression model. This is a good enough
result even though there still are some outliers in the figure 3.6.5.
4 Conclusion & Implication
As we explained above, we used three different levels to predict the exceedance
probability. We are looking forward to knowing the percent of the variation in the real
exceedance probability explained by the variation in the predicted exceedance
probability for these three different levels, which is the purpose to use R square. After
using R square, we found that some stations have a higher R square in the 25% level,
and some stations have a higher R square in the 50% level or 75% level. There are many
reasons leading the result happened. In our predicted model, many the predicted
exceedance probabilities are higher than the real exceedance probability at 25% lever or
50% level resulted from the monthly solar radiation distribution that is left-skewed. The
left-skewed distribution means that a high probability of its left tail, and the probability
of its left tail represents the real exceedance probability from the monthly solar
radiation distribution. Because the original distribution is left-skewed, we have
transformed it to normal distribution with using solar radiation cubed. The probability of
left tail of normal distribution that is predicted exceedance probability is smaller than
the probability of left tail of original distribution, so the real exceedance probability is
higher than the predicted exceedance probability.
0
0.02
0.04
0.06
0.08
0.1
0.12
0.14
0.16
0.18
0.2
0 0.05 0.1 0.15
realprobability
predicted probability
simple linear regression
real
Predicted real
Linear (Predicted real)
outliers
13. 13
In general, we use data of Coolidge from 1987 to 2010 for calculating the predicted
exceedance probability, and we use data of Coolidge from 2010 to 2014 for calculating
the real exceedance probability, but there are only twenty-four years to calculate the
real exceedance probability, so the sample size is not large enough. In addition, there
are about 50 “999” values which called missing value in solar radiation data, and most of
them concentrate at August and September. However, we use combined the predicted
exceedance probabilities of three different levels as the independent variable X, and the
real exceedance probabilities of three different levels as the dependent variable Y to
build the regression model of Coolidge. The R square between the real and predicted
exceedance probabilities is similar to other stations’ R squares which are calculus in the
same way. This means the percent of the variation in real exceedance probability
explained by the variation in predicted exceedance probability for each station is similar,
and our result is relative reasonable.
Obviously, R square is smaller than one that the variation in real exceedance probability
cannot be completely explained by the variation in predicted exceedance probability. In
other words, our model cannot explain certain proportion of variation in real
exceedance probability. The first reason is the monthly solar radiation distribution is
left-skewed, and the left-skewed is because median is higher than mean. Median is
higher than mean that shows the right side of the original distribution including most of
data, instead, the left side of the original distribution including a few data. A few data on
the left side represents the frequency of the lower solar radiation happened. Owing to
the most of data on right side of the original distribution, the number of the lower solar
radiation happened is abnormal that are resulted from some special reasons. After
doing researches, sunspot cycle, concentrations of ozone, even ocean current may
affect the solar radiation received. The missing values and small sample size are two
reasons for the unexplained, besides, some other variables influence the solar radiation,
and for example, if the wind speed is always similar for each year, and the wind speed is
not an important influential factor for predicting the exceedance probability, but the
environmental factor and the hurricane weather influence the wind speed that
influence our prediction model. Some other variables also may influence. In addition,
the measurement method may be controversial. These reasons cause the variation in
real exceedance probability that cannot be completely explained by the variation in
predicated exceedance probability.
14. 14
5 Citation
"AZMET." The Arizona Meteorological Network. The University of Arizona, n.d.
Web. 23 Apr. 2015. <http://cals.arizona.edu/azmet/>.
"Estimating the Uncertainty of Revenues and Investment Decisions." Exceedance
Probabilities. Green Rhino Energy, n.d. Web. 23 Apr. 2015.
<http://www.greenrhinoenergy.com/finance/modelling/revenue_uncertainties.p
hp>.
"Probability of Exceedance." Hydraulic Design Manual, n.d. Web. 23 Apr. 2015.
<http://onlinemanuals.txdot.gov/txdotmanuals/hyd/probability_of_exceedance.
htm>.
"What Does Annual Exceedance Probability or AEP Mean?" Environment
Canterbury. N.p., n.d. Web. 23 Apr. 2015. <http://ecan.govt.nz/quick-
answers/Pages/what-does-annual-exceedance-probability-or-aep-mean.aspx>.
Hildebrand, D. K. Statistical Thinking for Behavioral Scientists. Boston: Duxbury,
1986.
Kenney, J. F. and Keeping, E. S. Mathematics of Statistics, Pt. 1, 3rd ed. Princeton,
NJ: Van Nostrand, pp. 101-102, 1962.
P.F. Velleman and D.C. Hoaglin, Applications, Basics, and Computing of
Exploratory Data Analysis, 354 pp., Duxbury Press, 1981
Shumway, R. H. and Stoffer, D. S. Time Series Analysis and Its Applications, with R
Examples, 2nd ed. New York: Springer-Verlag, 2000.
Edwards, A. L. Multiple Regression and the Analysis of Variance and Covariance.
San Francisco, CA: W. H. Freeman, 1979.
Edwards, A. L. An Introduction to Linear Regression and Correlation. San
Francisco, CA: W. H. Freeman, 1976.