Customer Experience Study de Interactive Intelligence
•
1 like•552 views

Reporte completo del estudio de Interactive Intelligence sobre Customer Experience | #Clienting #CRM #CxEx

Recommended
Recommended
More Related Content
What's hot
What's hot (17)
Viewers also liked
Viewers also liked (20)
Similar to Customer Experience Study de Interactive Intelligence
Similar to Customer Experience Study de Interactive Intelligence (20)
More from Hugo A. Saenz
More from Hugo A. Saenz (20)
Recently uploaded
Recently uploaded (20)
Customer Experience Study de Interactive Intelligence
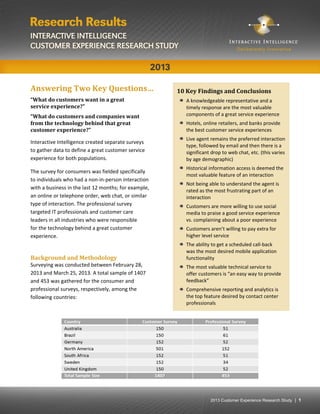
- 1. 2013 Customer Experience Research Study | 1 Answering Two Key Questions… “What do customers want in a great service experience?” “What do customers and companies want from the technology behind that great customer experience?” Interactive Intelligence created separate surveys to gather data to define a great customer service experience for both populations. The survey for consumers was fielded specifically to individuals who had a non‐in‐person interaction with a business in the last 12 months; for example, an online or telephone order, web chat, or similar type of interaction. The professional survey targeted IT professionals and customer care leaders in all industries who were responsible for the technology behind a great customer experience. Background and Methodology Surveying was conducted between February 28, 2013 and March 25, 2013. A total sample of 1407 and 453 was gathered for the consumer and professional surveys, respectively, among the following countries: 10 Key Findings and Conclusions A knowledgeable representative and a timely response are the most valuable components of a great service experience Hotels, online retailers, and banks provide the best customer service experiences Live agent remains the preferred interaction type, followed by email and then there is a significant drop to web chat, etc. (this varies by age demographic) Historical information access is deemed the most valuable feature of an interaction Not being able to understand the agent is rated as the most frustrating part of an interaction Customers are more willing to use social media to praise a good service experience vs. complaining about a poor experience Customers aren’t willing to pay extra for higher level service The ability to get a scheduled call‐back was the most desired mobile application functionality The most valuable technical service to offer customers is “an easy way to provide feedback” Comprehensive reporting and analytics is the top feature desired by contact center professionals
- 2. 2013 Customer Experience Research Study | 2 Summary of Findings – Consumer Survey Interaction Questions Which do you value most in a customer service interaction? (Results displayed on a scale of 1‐5 with lower numbers representing higher rankings.) Thinking about the things that frustrate you the most when interacting with a business or service provider, please rate the following items: (Results displayed include a response of ‘Very frustrating’ on a scale of 1‐5.) 4.2 3.1 3.0 2.4 2.2 0.0 1.0 2.0 3.0 4.0 5.0 Knowledgeable Representative/Agent Timely Response Professionalism Effective follow-up EfficiencyLeastvalued 75% 71% 69% 66% 66% 66% 56% 42% 9% 0% 10% 20% 30% 40% 50% 60% 70% 80% When speaking on the phone you can't understand the agent Agent is condescending / demeaning Lack of effort from the agent Initial long wait time Being transferred multiple times before finding the right person to help Agent doesn't have the knowledge to answer my question Need to repeat information at different points of interaction Being put on hold during your interaction *Other
- 3. 2013 Customer Experience Research Study | 3 Have you ever had an exceptional customer service experience that made you want to tell family or friends? In your opinion, what industries provide the best customer service experience? (Results displayed include a response of ‘Very best’ and ‘Somewhat best’ on a scale of 1‐5.) 59% 41% Yes No 61% 51% 45% 39% 35% 35% 35% 33% 32% 17% 0% 0% 10% 20% 30% 40% 50% 60% 70% Hotels Online Retail Stores Banks Healthcare Providers Insurance Companies Airlines Technology Providers (Cellular Phone, Cable TV, Satellite TV) Utility Providers (Gas, Power, Water) Credit Card Providers Government Agencies *Other
- 4. 2013 Customer Experience Research Study | 4 What methods do you prefer most when it comes to interacting with customer service or support? (Results displayed by average rank with lower numbers representing higher rankings.) What methods do you prefer most when it comes to interacting with customer service or support? (Results displayed by percent of most preferred.) 5.4 5.4 4.4 3.6 3.3 2.7 1.9 0.0 1.0 2.0 3.0 4.0 5.0 6.0 Live Agent via phone Email Live agent via web chat Website Self Service from a Smartphone or tablet Social Media Outlet *Other Leastvalued 59% 17% 12% 5% 4% 1% 0% 10% 20% 30% 40% 50% 60% 70% Live agent via phone Email Live agent via web chat Websites Self Service from a Smartphone or tablet Social Media Outlet
- 5. 2013 Customer Experience Research Study | 5 Now thinking of those businesses/services providers that you do repeat business with, how valuable are the following attributes to you when you have an interaction with customer service or support? (Results displayed include a response of ‘Extremely valuable’ on a scale of 1‐4.) What do you feel is the appropriate response time after submitting a question or request using each of the following methods? 65% 49% 27% 0% 10% 20% 30% 40% 50% 60% 70% Staff has access to my history and current activities with that company Having the same agent help you each time Being greeted by name 8% 20% 8% 2% 10% 26% 30% 15% 3% 7% 41% 29% 25% 8% 11% 19% 12% 20% 12% 12% 6% 4% 16% 16% 12% 0% 3% 12% 24% 19% 2% 5% 35% 29% 0% 5% 10% 15% 20% 25% 30% 35% 40% 45% Telephone Web Chat SMS/Text Email Website Expect immediate answer Less than 1 minute 1 to less than 3 minutes 3 to less than 5 minutes 5 to less than 10 minutes 10 minutes or over 24 hours
- 6. 2013 Customer Experience Research Study | 6 What percent of the time do you use the following customer service or support methods to interact with a business or service provider? Would you be willing to pay a fee to receive a higher level of service? 52% 21% 9% 8% 4% 3% 3% Phone Email Web chat Website SMS/Text Social Media Self-Service from a Smartphone or tablet Other (written, fax, etc.) 77% 14% 9% No, I expect good service as part of doing business Yes, if reasonable Yes, for certain service providers
- 7. 2013 Customer Experience Research Study | 7 Summary of Findings – Consumer Survey Technology Questions How valuable is having the following pieces of information available to an agent before you have an interaction? (Results displayed include a response of ‘Extremely valuable’ or ‘Valuable’ on a scale of 1‐4.) With regards to customer service or support interactions, how valuable is it to you that a vendor provides the following: (Results displayed include a response of ‘Extremely valuable’ or ‘Valuable’ on a scale of 1‐4.) 93% 90% 77% 64% 0% 10% 20% 30% 40% 50% 60% 70% 80% 90% 100% Account Information Past conversations / exchanges Past purchase history My location 94% 83% 56% 52% 0% 10% 20% 30% 40% 50% 60% 70% 80% 90% 100% No need to repeat information if transferred The ability to provide feedback on your interactions once completed Offer self-service via mobile applications Offer speech recognition as well as touch tone for self-service
- 8. 2013 Customer Experience Research Study | 8 Please rate the value of each of the following being available for you to use when you are interacting with that company’s customer service or support: (Results displayed include a response of ‘Extremely valuable’ or ‘Valuable’ on a scale of 1‐4.) Please rate the value of each of the following being available for you to use when you are interacting with that company’s customer service or support: (Results displayed include a response of ‘Extremely valuable’ or ‘Valuable’ on a scale of 1‐4.) 95% 91% 64% 50% 47% 38% 34% 0% 10% 20% 30% 40% 50% 60% 70% 80% 90% 100% Phone Email Web chat SMS/Text Self-Service from a Smartphone or tablet Interactive voice response (IVR) Social Media 0% 10% 20% 30% 40% 50% 60% 70% 80% 90% 100% 18-24 25-34 35-44 45-54 55-64 65+ Total Consumer Age Phone Email Web chat SMS/Text Self-Service from a Smartphone or tablet Interactive voice response (IVR) Social Media
- 9. 2013 Customer Experience Research Study | 9 What would prompt you to share a customer service or support experience on a social networking site? Have you ever shared a customer service or support experience on a social networking site? 54% 36% 34% 26% 26% 25% 1% 0% 10% 20% 30% 40% 50% 60% Great experience Horrendous experience Terrible experience Still looking for answers None of these Unanswered question *Other 35% 28% 35% 20% 17% 13% 27% 65% 62% 65% 80% 83% 87% 73% 0% 10% 20% 30% 40% 50% 60% 70% 80% 90% 100% 18-24 25-34 35-44 45-54 55-64 65+ Total Consumer Age Yes No
- 10. 2013 Customer Experience Research Study | 10 Which of the following best describes how you shared your experience? Did the company respond to your satisfaction? 73% 40% 21% 15% 8% 0% 10% 20% 30% 40% 50% 60% 70% 80% On my personal Facebook wall On the company's Facebook page Tweeted the experience through Twitter without mentioning the company's name Tweeted the experience through Twitter with the company's name on a hashtag *Shared the experience on a different social networking site 54% 46% Yes No
- 11. 2013 Customer Experience Research Study | 11 What frustrates you most about customer service or support interactions using a mobile device? Which of the following capabilities do you value most in a customer service interaction when using a mobile device? (Results displayed by average rank with lower numbers representing higher rankings.) 13% 23% 28% 36% No frustrations with customer service or support when using a mobile device Not having the ability to request a call back / call back at a set time Having to leave the app and manually dial a customer service number Sending an email then having to wait too long until you get a response 3.5 3.5 3.2 3 1.8 0 0.5 1 1.5 2 2.5 3 3.5 4 Ability for a call back when agent becomes available Phone self service Automated proactive reminders or notification Speech recognition Priority routing based on membership, status, importance Leastvalued
- 12. 2013 Customer Experience Research Study | 12 Summary of Findings – Professional Survey Interaction Questions What method of interaction with your customers does you organization most prefer? (Results displayed by percent of most preferred.) What method of interaction with your customers does you organization most prefer? (Results displayed by average rank with lower numbers representing higher rankings.) 52% 19% 12% 12% 11% 6% 0% 10% 20% 30% 40% 50% 60% Live agent via phone Email Website Self Service from a Smartphone or tablet Live agent via web chat Social Media Outlet Consumers preferred: Phone - 59% Email - 17% 4.0 3.4 3.4 3.0 2.8 2.0 0.0 1.0 2.0 3.0 4.0 5.0 Live agent via phone Email Live agent via web chat Self Service from a Smartphone or tablet Website Social Media Outlet Leastvalued
- 13. 2013 Customer Experience Research Study | 13 What percent of time does your customer support or service organization use each of the following channels with your customers? Through which of the following social networks do you interact with customers? 34% 20% 13% 11% 8% 8% 7% 0% 0% 5% 10% 15% 20% 25% 30% 35% 40% Phone Email Web chat Website SMS / Text Social Media Self Service from a Smartphone or tablet *Other 94% 62% 42% 4% 0% 10% 20% 30% 40% 50% 60% 70% 80% 90% 100% Facebook Twitter LinkedIn *Other
- 14. 2013 Customer Experience Research Study | 14 How valuable is it to you to be able to offer each of the following services to your customers? (Results displayed include a response of ‘Extremely valuable’ on a scale of 1‐4.) Please rate the value of the technology solution's ability to provide customer interaction via the following methods: (Results displayed include a response of ‘Extremely valuable’ on a scale of 1‐4.) 66% 60% 52% 44% 42% 42% 35% 34% 0% 10% 20% 30% 40% 50% 60% 70% An easy way to provide feedback on interactions once completed When transferred, the new agent has the customer's information and they don't have to start over Complete interaction history available to agents, no matter the channel Phone self service Customer being able to place their self in queue for a call back when agent becomes available Priority routing based on membership, status, importance Offer self service via mobile applications Offer speech recognition as well as touch tone in the interactive voice response (IVR) Consumers preferred: Info transfer - 94% Feedback ability - 83% 76% 60% 44% 33% 31% 31% 31% 0% 10% 20% 30% 40% 50% 60% 70% 80% Phone Email Web Chat Social Media Interactive voice response (IVR) SMS / Text Self Service from a Smartphone or tablet Consumers ranked email at a strong 91% Consumers ranked social media last, although the % was similar at 34%
- 15. 2013 Customer Experience Research Study | 15 How valuable are each of the following features to your ability to manage your customer service and support services' needs business: (Results displayed include a response of ‘Extremely valuable’ on a scale of 1‐4.) What do you feel is the appropriate response time after a customer submits a problem using the following methods: 63% 59% 49% 45% 44% 44% 43% 34% 0% 10% 20% 30% 40% 50% 60% 70% Comprehensive reporting Real time monitoring and alerting Screen pop customer information to an agent when an interaction is routed to them Management information available via portals / dashboards Single point of system administration Connecting customers on mobile devices directly to the contact center Real time keyword spotting Speech recognition 27% 15% 7% 6% 10% 26% 23% 16% 8% 9% 25% 28% 23% 11% 15% 9% 16% 21% 14% 13% 8% 9% 17% 20% 14% 3% 7% 11% 24% 19% 1% 2% 4% 17% 21% 0% 5% 10% 15% 20% 25% 30% Phone Web chat SMS / Text Email Website Expect immediate answer Less than 1 minute 1 to less than 3 minutes 3 to less than 5 minutes 5 to less than 10 minutes 10 minutes or over 24-hours Only 8% of consumers expected and immediate answer to a phone call
- 16. 2013 Customer Experience Research Study | 16 Does your organization allow customers to pay a fee for higher level of service? Do you think allowing customers to pay a fee for a higher level of service is a beneficial option for your organization and / or your customers? 53% 47% Yes No 77% of consumers won't pay for a higher level of service if offered 63% 18% 10% 9% No, would not be beneficial to my organization or customers Yes, it would be a beneficial option to both my organization and customers Yes, but only a beneficial option to my customers Yes, but only a beneficial option to my organization
- 17. 2013 Customer Experience Research Study | 17 Conclusions Based on consumer expectations, communications channels, and customer service outcomes, survey respondents (“consumers”) around the globe share many of the same views in what contributes to a great customer experience. Chief among those views is that a representative/agent who is knowledgeable, quick, and friendly in delivering an effective response to an issue is seen as the most valued aspect of a customer service interaction. At the same time, consumers consider their account information to be the most valuable piece of information an agent can have available before interacting with them. Equally important to consumers is not having to repeat information if transferred during an interaction. Regardless of their country of origin, consumers prefer to interact by phone with a live agent, followed by email and web chat, and consider an acceptable telephone wait time to be less than 3 minutes. Not being able to understand an agent when speaking on the phone, however, is a leading frustration. More consumers also have used a laptop and/or desktop computer for customer service vs. a smartphone or tablet, while 52% of consumers have used or would use Facebook to interact with a company for customer service. For mobile customer service, smartphone use is at present far higher than tablet use, with the most valuable mobile capability being the option to request a call back. Conversely, when interacting via email, mobile consumers dislike having to wait too long to get a response. By industry and service sector, consumers report that industries providing the best customer service experiences are hotels, online retail stores, and banks. Technology companies, utilities and government agencies are rated worst. Ultimately, consumers expect high levels of service to be the standard for customer service, and they are not willing to pay extra for service that must be otherwise optimized. Key findings of our Professional Survey mirror many of those from our Consumer Survey. Professionals, for instance, value a timely response most in a service or support interaction with their customers. Live agent phone interactions are also the preferred method by professionals’ organizations when interacting with customers, followed by email, and then web chat. (An exception is Germany, in which email is the most valuable communication method, followed by the phone.) Professionals additionally agree with consumers that wait times should be less than 3 minutes for phone calls, as well as for web chats. Somewhat different than consumers, professionals use social media at a higher rate, with their companies having used Facebook (94%) and Twitter (64%) to interact with customers. As reported by all professionals, the most valuable service to offer customers is an easy way for them to provide feedback once their interactions are completed. Similarly among professionals overall, comprehensive reporting is seen as the top feature in managing their organizations’ business needs for customer and support services. Technology‐wise, 87% of professionals indicate that their organization is satisfied with their communication software and services, although only 36% of professionals say they have had an exceptional experience with a company that provides communication software and services. (Professionals reporting an exceptional experience cite “quality of technologies” as well as “the (vendor) company’s ability to deliver an apt and effective response if an issue arises.”). Lastly, whereas 53% of professionals/organizations surveyed allow their customers to pay a fee for a higher level of service, more professionals in Germany, South Africa, and North America report that their organization does not. Overall, the quest for delivering a great customer experience is a top priority for companies. And consumers are making it clear that they have certain preference, likes, and dislikes. As this research shows, the more providers can align with the details of what consumers are looking for in a great customer experience, the more the service experience can become a great competitive differentiator for their business.
- 18. 2013 Customer Experience Research Study | 18 Interactive Intelligence offers unified business communications solutions for contact center automation, unified communications, and business process automation, based on our open standards, all-in-one software suite. More than 5,000 organizations worldwide currently benefit from our cloud-based Communications as a Service (CaaS) offerings and on-premises solutions, including value-added services for software, hardware, implementation, consulting, support, and education. At Interactive Intelligence, it’s what we do. www.inin.com © 2013 Interactive Intelligence, Inc. All rights reserved World Headquarters 7601 Interactive Way Indianapolis, IN 46278 USA +1 317 872 3000 voice and fax Toll Free: 800.267.1364 EMEA Headquarters Thames Central, Hatfield Road Slough, Berkshire, SL1 1QE United Kingdom +44 1753 418 800 Asia Pacific Headquarters 8 Jalan Sultan Ismail 50250 Kuala Lumpur Malaysia +60 3 2776-3333 voice +60 3 2776-3343 fax