Thermal cycling screen development
•
1 gefällt mir•1,134 views

Thermal cycling screens involve cycling hardware between high and low temperatures to induce failures. Method A for developing a thermal cycling profile uses a thermal survey to tailor cycle characteristics, equipment conditions, and number of cycles to the specific hardware. An ideal thermal survey involves computer modeling, constructing a test facility replica, instrumenting hardware, and performing experimental trials to establish screening parameters that achieve desired hardware temperature histories. Key parameters include temperature extremes and rates of change, dwell times at extremes, and whether hardware is powered during screening.

Empfohlen
Empfohlen
Weitere ähnliche Inhalte
Andere mochten auch
Ähnlich wie Thermal cycling screen development
Ähnlich wie Thermal cycling screen development (20)
Mehr von Hilaire (Ananda) Perera P.Eng.
Mehr von Hilaire (Ananda) Perera P.Eng. (20)
Kürzlich hochgeladen
Kürzlich hochgeladen (20)
Thermal cycling screen development
- 1. Thermal Cycling Screen Development The thermal screens in widest use today are (1) thermal cycling, (2) steady high temperature, and (3) thermal shock. The thermal cycling screen is recognized by the Institute of Environmental Sciences (IES) as being the most cost effective although the other two are used in some special situations. The thermal screens described by the two methods herein, thermal survey and heritage, should be considered only as starting profiles. The effectiveness of any screen should be evaluated by engineering analysis of the equipment and the expected flaws, using factory and field failure data, and the failure history of the equipment during and subsequent to the screen, adjusting the screen parameters as the screen matures. Method A -- Thermal Survey A thermal screen is characterized by: • Cycle characteristics – – high temperature – rate of change of temperature – • low temperature dwell times at temperature extremes Equipment condition – powered or unpowered – monitored or unmonitored • Number of cycles • Level of assembly at which screen is performed With the aid of a thermal survey, Method A tailors the cycle characteristics, equipment condition and number of cycles to the hardware to be screened. Thermal Survey Purpose Developing a temperature cycling screening profile in terms of the thermal environment to which the hardware is to be subjected establishes: • Hardware temperature history – temperature range Ref: ESS Guidelines July 1993; A Tri-Service (Army, Navy, Air Force) Technical Brief Hilaire Ananda Perera http://www.linkedin.com/in/hilaireperera
- 2. – temperature extremes – stabilization criterion – soak time at temperature extremes • Elements of the hardware to be subjected to this temperature history. It is generally not cost effective to perform a long cycle that subjects the entire mass of the item being screened to the temperature extremes. This is especially true with items (such as units, systems, and heavy modules) having high thermal inertia. Accordingly, the designer of the thermal cycling screening profile must decide what elements (such as parts, solder joints, PWA connectors) are important to be subjected to the specified hardware temperature history. This decision is based on where in the assembly the defects are expected to be precipitated by the screen. This could be, for example, in the semiconductor parts or in the PWA connectors. • The method of heat transfer to the item being screened, such as: – coolant circulated through a coldplate thermally connected to the item – chamber air blown over the exterior of the item – conditioning fluid circulated through the item To achieve a desired hardware thermal cycle, a certain temperature history of the heat transfer medium producing the thermal cycling is required. A thermal survey evaluates the thermal response of various elements in the hardware to changes in the temperature of the heat transfer medium. The temperature history of the heat transfer medium required to produce a desired hardware thermal response may then be developed. Thermal Survey Guidelines Ideally, a thermal survey should include the following four steps. However, developing a computer simulation may not always be practical, affordable, or necessary. 1. Perform a computer simulation. Develop a detailed transient thermal model of the heat transfer occurring in the thermal cycling screening setup. (This is different from thermal analysis or thermal mapping, which is the measurement of the operating temperatures of the deployed equipment in actual use.) The model should be capable of predicting, as functions of the temperature history of the heat transfer medium, the temperature histories of the electronic parts, the PWAs, and other elements in the hardware targeted for removal of screenable defects. This model should simulate: • The dissipations of active parts in the hardware being screened (in the case of powered equipment) Ref: ESS Guidelines July 1993; A Tri-Service (Army, Navy, Air Force) Technical Brief Hilaire Ananda Perera http://www.linkedin.com/in/hilaireperera
- 3. • The thermal resistances between locations in the hardware and the heat transfer medium • The thermal capacitances of the elements of the hardware Use the model to perform parametric analyses of the thermal responses of the elements in the hardware being screened to changes in the temperature of the heat transfer medium. The results of these analyses will be hardware and heat transfer medium temperature histories. These analyses will: • • Evaluate the temperature rate of change of the heat transfer medium required to achieve the specified hardware temperature rate of change (a function of the velocity of the heat transfer medium). • 2. Identify the elements having the slowest thermal response to the heat transfer medium. Evaluate the dwell time of the heat transfer medium required for stabilization of the hardware temperatures (a function of the velocity and temperature of the heat transfer medium). Construct a replica of the actual screening facility. The thermal survey must be performed with a setup that replicates the thermal characteristics of the actual Environmental Stress Screening (ESS) setup in the following respects: • • Mounting of hardware in chamber • Powering (if powered during ESS) • 3. Facility Cooling (if powered and actively cooled during ESS) Instrument the important locations. Monitor and record the following quantities: • Temperatures – – heat transfer medium, such as chamber air – • hardware (the thermal analysis performed in the first step will aid the selection of hardware locations at which to measure temperature) coolants (if actively cooled) Flow rates (velocities) – heat transfer medium, such as chamber air – coolants (if actively cooled) Ref: ESS Guidelines July 1993; A Tri-Service (Army, Navy, Air Force) Technical Brief Hilaire Ananda Perera http://www.linkedin.com/in/hilaireperera
- 4. • Power dissipations (if powered) The hardware temperature histories typically are measured with thermocouples, which are point instruments (as distinguished from infrared thermography, with which a temperature map of an area is obtained). Data are obtained only at the preselected instrumentation locations, so it is important to instrument the important locations, with the aid of the computer simulation. Thermocouples must be electrically isolated from measurement surfaces that are electrically “hot.” 4. Perform the experimental thermal survey by completing the following three distinct procedures: • The unit is soaked cold with power off until all thermocouples have stabilized at the test temperature, then power is turned on for the soak period, and then the rise to temperature at the required rate for the chamber. The chamber temperature is held at the high temperature until all thermocouples have reached the test temperature. The data is used to establish the high temperature stabilization time. • A similar cycle is run to establish the cold temperature stabilization time. • Several complete cycles are run to fine tune the parameters to adjust for the shortened stabilization times. In the same way as was done analytically in the computer simulation, measure the temperature histories as functions of the screening setup parameters. Perform at least three thermal cycles to establish a thermal steady state. The results will be experimental plots used to establish the screening parameters required to achieve the specified hardware temperature histories. The analysis in the computer simulation should minimize the amount of iteration required in the laboratory to establish the screening setup parameters. Cycle Characteristics In characterizing the thermal cycle it is important to distinguish between the temperature histories of the hardware elements and that of the chamber air. The hardware temperature histories determine the effectiveness of the screen whereas the chamber air temperature history is the controlling element. To achieve a desired hardware temperature history, a certain temperature history of the chamber air producing the thermal cycling is required. A thermal survey evaluates the thermal response of various elements in the hardware to changes in the temperature of the chamber air. The results of the thermal survey will be experimental plots of the thermal responses, measured at critical elements of the hardware, to changes in the temperature of the chamber air. The necessary temperature range and rate of change of the chamber air can then be identified for a desired response. Ref: ESS Guidelines July 1993; A Tri-Service (Army, Navy, Air Force) Technical Brief Hilaire Ananda Perera http://www.linkedin.com/in/hilaireperera
- 5. Temperature Extremes The temperature extremes in a thermal cycle affect the effectiveness of the screen. The temperature range (the difference between the high and low temperatures) dictates the thermal stress/strain to which the hardware is subjected in each cycle. The number of cycles to failure varies inversely with the temperature range: The wider the range, the earlier the failure. By optimizing the temperature extremes, the screening profile designer can minimize the number of cycles required to precipitate flaws. Thus, the temperature extremes also affect the cost of the screen. The key to selecting the temperature extremes is to stress the hardware adequately to precipitate flaws without damaging good hardware. In practice, temperature ranges from a minimum of 90 (C to a maximum of 180ºC have been used. Minimum values are: 125ºC for modules (usually 50ºC to 75ºC), 110ºC for units (usually -40ºC to 70ºC) and 100ºC for systems (usually -40ºC to 60ºC). The following key factors should be considered for the extreme value: • Storage temperature (high and low) limits of hardware such as the materials in printed wiring assemblies • Maximum turn-on and operating temperatures of electronic parts Rate of Change of Temperature The temperature rate of change affects the screening effectiveness in a complicated way. It also affects the duration and thus the cost of the screen. The physical effect of the rate of change of temperature is quite complex. If a slab of material were heated and cooled uniformly, the thermal stresses and strains would be independent of the temperature rate of change. In thermal stress screening, however the heating/cooling is nonuniform because of: • Nonuniform heat transfer to the surface of the hardware • Thermal lags between the surface and interior of the hardware • Nonuniform thermal inertia of the various portions of the hardware Consequently, instantaneous temperature gradients can exist throughout the hardware. These temperature gradients, and the resultant thermal stress/strains, increase with increasing temperature rate of change. Consistent with this phenomenon, industry has found that increasing the temperature rate of change increases the screening strength up to a point. For example, the situation is more complicated for solder, which creeps at temperatures encountered in thermal stress screening. Creep, which has been identified as the major cause of solder joint failure, requires time to occur. If the temperature rate of change is too high, the thermal stress screening profile may actually be excessively benign for the purpose f precipitating defective solder joints to failure. (If properly Ref: ESS Guidelines July 1993; A Tri-Service (Army, Navy, Air Force) Technical Brief Hilaire Ananda Perera http://www.linkedin.com/in/hilaireperera
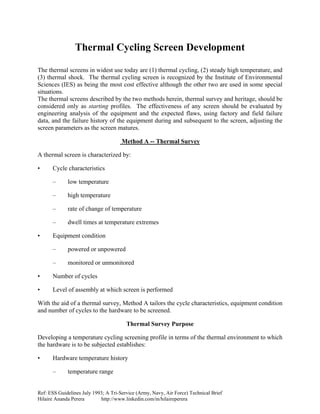
- 6. conducted, environmental stress screening to precipitate defective solder joints in a specific set of equipment should have to be performed at only one level of assembly.) If the chamber air temperature rate of change is too high, and/or if the dwell time is too short, and/or if the chamber air is too slow, then the part temperatures will not attain the chamber air temperature extremes. The result can be an unduly benign screen. This is illustrated by comparing Figures 1 and 2. In the first case, the air is fast enough and the dwell time long enough to enable the parts to stabilize and soak at the temperature extremes. In the second case, in which the air speed is six times slower and the dwell time one-sixth as long, the part temperatures do not stabilize, and instead cycle over a much smaller range than does the chamber air temperature. However, adequate experimentation and analysis can be used to tailor chamber conditions to achieve the desired temperatures and rates f change in the test items. Figure 1. -- Temperature Histories with High Chamber Air Speed and Long Dwell Times Ref: ESS Guidelines July 1993; A Tri-Service (Army, Navy, Air Force) Technical Brief Hilaire Ananda Perera http://www.linkedin.com/in/hilaireperera
- 7. Figure 2. -- Temperature Histories with Low Chamber Air Speed and Short Dwell Times The choice of temperature rate of change depends on the nature of the hardware and the flaws expected. A high temperature rate of change is expected to be the most effective for precipitating flaws in such elements as plated-through holes, whereas a slow rate of change with long dwells at high temperature is expected to be the most effective for precipitating flaws in solder joints. In practice the temperature rate of change varies from 10ºC/min to 20ºC/min with the nominal values as follows: PWA Screening 15ºC/min to 20ºC/min Unit Screening 10ºC/min to 20ºC/min System Screening 10ºC/min to 15ºC/min The screening strength does not increase indefinitely with increasing temperature rate of change. Dwell Times at Temperature Extremes The dwell time of the chamber air temperature consists of two elements, as shown in Figure 3: • The time (D(1)) required for the part temperatures to stabilize Ref: ESS Guidelines July 1993; A Tri-Service (Army, Navy, Air Force) Technical Brief Hilaire Ananda Perera http://www.linkedin.com/in/hilaireperera
- 8. • The additional time (D(2)) required to “soak” the hardware at the temperature extremes Stabilization Time The stabilization time (D(1)) required for internal components to reach the ultimate chamber temperature (chamber set point) has to be determined by the thermal survey. The choice of stabilization criterion affects the duration and thus the cost of the screen. The recommended stabilization criterion is: stabilization has occurred when the temperatures of the slowest-responding performance-related elements in the hardware being screened are within 15% (T in Figure 3) of the ultimate temperatures. During the screening of unpowered equipment, the ultimate temperatures are the chamber air high and low extremes as shown in Figure 2. With powered screening, the hardware temperatures may have other values, depending on the specifics of the equipment and the setup. The designer of the profile must decide which elements of the hardware being screened (excluding magnetics) are to be monitored. Defining stabilization as the time required for the rate of change of the part temperatures to decrease to some small specified value is not recommended. Thermal analyses indicate that this criterion can result in excessively long-duration and thus expensive screens. The stabilization time (D(1)) for a specific screen, using the criterion recommended depends on the hardware being screened and the screening facility. The most important factors are the thermal inertia of the assembly being screened and the chamber air speed. Figure 3. -- Typical Temperature Cycling Profiles Ref: ESS Guidelines July 1993; A Tri-Service (Army, Navy, Air Force) Technical Brief Hilaire Ananda Perera http://www.linkedin.com/in/hilaireperera
- 9. Soak Time The soak period (D(2)) serves two purposes. First, this period allows solder to creep. The time required for solder to relax is on the order of 5 minutes. Second, for screens in which the equipment is powered and monitored, the soak periods at the temperature extremes enable functional testing to be performed to detect failures which do not manifest themselves at ambient temperature. The recommended values of the soak time (D(2)) are as follows: • Unmonitored equipment: 5 minutes • Monitored equipment: long enough for functional testing to be performed or 5 minutes, whichever is longer. Equipment Condition Detection of failures induced by the environmental stresses generally requires that the equipment be powered and monitored. Testing the equipment to detect failures should be done during application of environmental stress screening, otherwise intermittent failures will go undetected. Testing only before or after stressing results in high risk of letting the intermittent flaws remain. Thermal cycling differs from vibration in this respect: The period of a vibration cycle is a small fraction of a second and the duration of a vibration screen is on the order of 10 minutes. During a vibration screen, there is not enough time to fully test a complex system. In contrast, the period of a thermal cycle is on the order of hours and the duration of a thermal cycling screen is on the order of several hours. In a thermal screen, therefore, one can test the system at either or both temperature extremes as well as at ambient temperature. When powered equipment is subjected to thermal cycling, the situation is complex because of the temperature rise produced by the dissipation (heat) of the electronic parts. The relation between the opening part temperatures and the chamber air temperature depends on the specific equipment and the screening parameters. In addition to the instantaneous thermal gradients occurring in screens of unpowered equipment, additional thermal gradients occur because of t he flow of heat from the dissipating parts to the surroundings. Some factors involved in deciding whether or not to have the equipment operating are as follows: • A powered screen is more effective in precipitating flaws than an unpowered screen. Powering produces temperature gradients in the hardware not present in unpowered equipment. The thermal stresses/strains resulting from these thermal gradients may precipitate flaws that escape in unpowered screens. • A powered and monitored screen may detect failures that escape in an unpowered screen (intermittent failures). Failures that do not manifest themselves in testing at ambient conditions may show up in testing at high or low temperature or during vibration. An example is a broken connection in which the pieces are touching just enough to provide continuity in the absence of thermal/vibration stresses. Ref: ESS Guidelines July 1993; A Tri-Service (Army, Navy, Air Force) Technical Brief Hilaire Ananda Perera http://www.linkedin.com/in/hilaireperera
- 10. • A powered and monitored screen is more expensive than an unpowered screen. • A power-off screen at the PWA level of assembly is often used as an effective screen for latent part defects. However, it should only be considered if the PWA will see a powered screen at the next higher level of assembly. Although details will differ for any specific item to be screened, the consensus of industry experience on the basis of technical and cost trade-off considerations is as follows: Assembly Level Equipment Condition Board Unpowered Unit Powered monitored System Powered monitored Number of Cycles As do the cycle characteristics, the choice of the number of cycles impacts the effectiveness and the duration and thus the cost of the screen. In evaluating the effect on failure of the number of cycles, it is important to distinguish between fallout at the point of screening and subsequent failures at higher levels of assembly and in the field. ESS takes life out of good an bad equipment although the decrease in the useful life of good equipment is small with a well designed screening profile. The number of failures occurring per cycle usually begins low, rapidly increases, then decreases exponentially until stabilization. When stabilization occurs, usually an optimum number of cycles has been reached. Thermal cycling produces thermal stresses which induce alternate expansion and contraction. The stresses and strains are highest at flaws because each flaw creates a stress riser that allows the stress to precipitate a flaw (i.e., latent defect) to hard (i.e., detectable) failure. The cyclic loading causes the flaws to grow. Eventually they become so large that they cause a complete structural failure and thus an electrical failure. For example, a cracked plated through hole eventually cracks completely around and causes an open circuit. The lifetime of the product is governed by the number of cycles, that is, the number of stress/strain reversals. The number of cycles to failure is a decreasing function of the stress/strain range per cycle, which in turn is a monotonically increasing function of the temperature range per cycle. However, a properly designed thermal screen will precipitate failures in flawed items, while not consuming a significant portion of the useful life of good items. For solder, the physics of failures induced by thermal cycling is more complex than for materials such as aluminum and copper. The reason is that, at the temperatures encountered in electronics equipment, solder creeps. Creep has been identified as the major cause of solder joint failures. Ref: ESS Guidelines July 1993; A Tri-Service (Army, Navy, Air Force) Technical Brief Hilaire Ananda Perera http://www.linkedin.com/in/hilaireperera
- 11. Solder creeps at a rate that increases with increasing temperature. Consequently, the number of cycles to failure of solder joints depends on other parameters s well as temperature range. The most severe thermal cycles for solder are those in which creep has sufficient time to occur. However, a screen should avoid unnecessarily inducing creep in solder joints. Although the selection of the number of thermal cycles is critical relative to the effectiveness and cost of the screen, the procedure to do so is controversial. What is recommended here is a practical empirical approach instead of estimating the residual fault content of an item and a corresponding screening strength necessary for an acceptable product. The number of cycles varies with product complexity, design and process maturity and whether the other thermal screen characteristics have been carefully chosen. The recommended procedure for selecting the number of cycles is: 1. Be sure that the thermal survey and analyses have been completed to identify the most appropriate values of temperature range (high and low value), product and chamber temperature rate-of-change, dwell times, and whether powered and monitored. 2. Based on the above, select the initial number of cycles for the thermal screen from the following ranges: PWA 20 TO 40 cycles Unit/System 12 to 20 cycles 3. Perform thermal screen as planned. Record when failures occur, types of failures, and corrective actions taken to prevent reoccurrence. Plot failures as a function of temperature cycle. When stabilization occurs in above plot, reduce the screen number of cycles to value corresponding to stabilization. 4. Continue monitoring screen results to justify any other adjustments of screening cycles, either up or down, that may be warranted. Method B -- Heritage Screen The Heritage Thermal Screen would be one derived from past, successful screening experience on equipment of comparable design and manufacture. Again, this should be an iterative process where the fallout, or flaw precipitation results, are carefully monitored so that screening strength can be adjusted to the most cost effective value as discussed in Method A. Ref: ESS Guidelines July 1993; A Tri-Service (Army, Navy, Air Force) Technical Brief Hilaire Ananda Perera http://www.linkedin.com/in/hilaireperera