Greytip launches New Dashboard
•Als PPT, PDF herunterladen•
1 gefällt mir•829 views

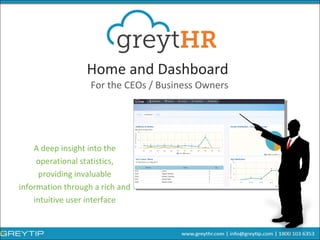
Reports have never been easy. Get an insight on operational statistics, providing invaluable information through rich and intuitive user interface.

Empfohlen
Empfohlen
Weitere ähnliche Inhalte
Ähnlich wie Greytip launches New Dashboard
Ähnlich wie Greytip launches New Dashboard (20)
Mehr von Greytip Software
Mehr von Greytip Software (20)
Kürzlich hochgeladen
Kürzlich hochgeladen (20)
Greytip launches New Dashboard
- 1. Home and Dashboard A deep insight into the operational statistics, providing invaluable information through a rich and intuitive user interface For the CEOs / Business Owners
- 2. What’s In It For You Instant access to key employee data using insightful graphs and charts News box providing updates on essential statutory information about PF, ESI, Profession Tax etc. Access to data on demand
- 3. Dashboard - A Comprehensive Console • Head counts, employee additions and attritions analysis, leave statistics, available in the form of Graphs, Charts and Tables, making it extremely informative and easy to analyze • Flexible and easy to configure. Track the data points relevant to you. • Location, designation or departments wise headcount • Salary trends • Cut down time and effort by fetching the most recent data graphically without having to spend time and effort on report generation. Improved decision making with accurate and easily consumable data
- 4. Predefined And Configurable Graphs/Charts Select from a number of predefined templates Add Dashlets from a number of predefined options and customize them. Drag and drop dashlets to place them as you want
- 5. Personalize and track data points that are relevant to you Edit Dashlet to define data points – gross, OT, incentives, bonus etc. Dynamic Dashlets
- 6. Configure by location, department, designation, or grade Track numbers by – department / location / grade Dynamic Dashlets Options to display in Tables, Graphs
- 7. • Keeps you informed about statutory updates on PF, ESI, Income Tax (TDS) and Profession Tax, so you don’t miss upgrading your company policies • Info on new and useful features to enable you to get the maximum benefit from greytHR News Box – An information kiosk
- 8. Sign up at www.greytip.in Get your 30 Day free Trial A/c set up today