OTN - Private Sector Trade Note - Vol 2 2012
•
0 gefällt mir•384 views


Empfohlen
Empfohlen
Weitere ähnliche Inhalte
Ähnlich wie OTN - Private Sector Trade Note - Vol 2 2012
Ähnlich wie OTN - Private Sector Trade Note - Vol 2 2012 (20)
Mehr von Office of Trade Negotiations (OTN), CARICOM Secretariat
Mehr von Office of Trade Negotiations (OTN), CARICOM Secretariat (20)
Kürzlich hochgeladen
Kürzlich hochgeladen (20)
OTN - Private Sector Trade Note - Vol 2 2012
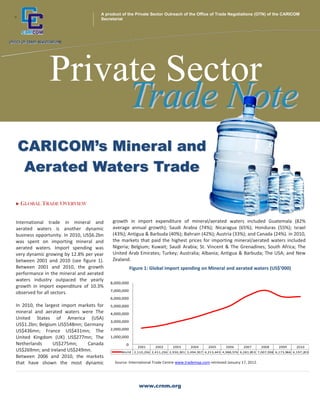
- 1. A product of the Private Sector Outreach of the Office of Trade Negotiations (OTN) of the CARICOM + Secretariat Private Sector Trade Note CARICOM’s Mineral and Aerated Waters Trade GLOBAL TRADE OVERVIEW International trade in mineral and growth in import expenditure of mineral/aerated waters included Guatemala (82% aerated waters is another dynamic average annual growth); Saudi Arabia (74%); Nicaragua (65%); Honduras (55%); Israel business opportunity. In 2010, US$6.2bn (43%); Antigua & Barbuda (40%); Bahrain (42%); Austria (33%); and Canada (24%). in 2010, was spent on importing mineral and the markets that paid the highest prices for importing mineral/aerated waters included aerated waters. Import spending was Nigeria; Belgium; Kuwait; Saudi Arabia; St. Vincent & The Grenadines; South Africa; The very dynamic growing by 12.8% per year United Arab Emirates; Turkey; Australia; Albania; Antigua & Barbuda; The USA; and New between 2001 and 2010 (see figure 1). Zealand. Between 2001 and 2010, the growth Figure 1: Global import spending on Mineral and aerated waters (US$’000) performance in the mineral and aerated waters industry outpaced the yearly 8,000,000 growth in import expenditure of 10.3% 7,000,000 observed for all sectors. 6,000,000 In 2010, the largest import markets for 5,000,000 mineral and aerated waters were The 4,000,000 United States of America (USA) 3,000,000 US$1.2bn; Belgium US$548mn; Germany US$436mn; France US$431mn; The 2,000,000 United Kingdom (UK) US$277mn; The 1,000,000 Netherlands US$275mn; Canada 0 2001 2002 2003 2004 2005 2006 2007 2008 2009 2010 US$269mn; and Ireland US$249mn. World 2,110,236 2,411,236 2,930,301 3,494,937 4,213,443 4,988,576 6,281,853 7,007,938 6,173,966 6,197,203 Between 2006 and 2010, the markets that have shown the most dynamic Source: International Trade Centre www.trademap.com retrieved January 17, 2012. www.crnm.org
- 2. CARICOM TRADE OVERVIEW Figure 2: CARICOM Trade Overview for Mineral/aerated waters (US$’000) CARICOM exporters have been facing significant difficulties in exploiting the opportunities in the dynamic global market for mineral waters/aerated waters. In 2010, CARICOM based exporters generated US$66mn from sales of mineral/aerated waters (see figure 2). CARICOM was not a major source of exports for this product as in 2010 regional sales represented only around 1.1% of global sales of this product. CARICOM’s international competitiveness has significantly deteriorated. In 2001, the region had a US$5.1 mn trade surplus. By 2010, the region spent almost US$31mn Source: International Trade Centre www.trademap.com retrieved January 17, 2012. more in imports of mineral waters/aerated waters than was earned from export sales of this product. Whilst export sales of Nevis may be successfully branding their mineral waters/aerated beverages, or may mineral waters/aerated beverages be producing higher value products, able to command higher prices and still grow expanded by an average of 3.8% annually export share. between 2001 and 2010, import spending on this product grew by almost 10% per In 2010, Jamaica was the largest CARICOM market for imported mineral year (see figure 2). waters/aerated waters accounting for under a third of this products regional import expenditure (see table 2). Dominica was the regional market that paid the highest CARICOM’s export sale of mineral/aerated price for importing mineral waters/aerated waters paying more than double the waters was dominated by Trinidad & regional average import price in 2010. At the other extreme, Haiti was the regional Tobago. In 2010, Trinidad & Tobago market that paid the lowest price for importing mineral waters/aerated waters (see generated over four‐fifths of CARICOM’s table 2). There is a negative correlation between the dynamism of import spending, total export sales of this product. Other and the import price. The “cheapest” CARICOM import markets for mineral CARICOM Member States with some waters/aerated waters such as Haiti, Belize and Trinidad & Tobago were largely the significant export sales of mineral waters/aerated beverages were Jamaica, Table 1: CARICOM’s export of mineral waters/aerated waters. Barbados and St. Lucia (see table 1). Exporters 2010 Export Unit value Export sales Export volume Export sales sales(US$’000) (USD/unit) growth 06‐10 growth 06‐10 (%) growth 09‐10 (%) CARICOM Member States exported mineral (%) waters with varying levels of price CARICOM 66,235 efficiency. At one extreme, exporters from Trinidad and Tobago 54,495 779 6 4 0 Jamaica 4,801 654 3 2 ‐3 Jamaica, Barbados, and St. Lucia were relatively cheaper exporters of this Barbados 3,013 1,002 11 12 ‐10 product. However exporters from Saint Lucia 2,296 902 23 4 9 Dominica, Suriname and St. Kitts & Nevis Saint Vincent and the Grenadines 521 672 40 58 ‐54 exported this product at relatively high unit Guyana 408 627 11 9 ‐71 costs. Interestingly however exporters Saint Kitts and Nevis 390 1,219 33 37 59 from St. Kitts and Nevis were still able to Antigua and Barbuda 253 719 ‐14 ‐3 ‐55 demonstrate significant sales growth and Bahamas 35 427 147 255 400 were the most dynamic exporters of mineral waters/aerated waters between Suriname 20 1,538 2006 and 2010 (see table 1). These Dominica 2 2,000 ‐49 ‐55 ‐33 exporters were also able to intensify their Haiti 1 1,000 ‐80 export growth between 2009 and 2010. This shows that exporters from St. Kitts and Source: International Trade Centre www.trademap.com retrieved January 17, 2012. www.crnm.org
- 3. markets that exhibited the greatest called rules of origin). However imports annually, whereas Intra‐CARICOM imports growth in import spending between 2006 from other markets that have no free grew by 6.9% annually. This seems to and 2010. There seems to be no clear trade arrangements, or special import reinforce the general price relationship between import sales and arrangements would be subject to an uncompetitiveness of regional exports. tariffs. Belize had the second highest average tariff of 0.1%. Similarly, imports tariff applied on this product but this of mineral waters/aerated waters into tariff was ineffective at stemming a 41% the European Union, are duty free from 3.3 Dynamic Market Strategy growth in import spending between 2006 CARICOM, whilst imports from other Dynamic markets earlier identified can be and 2010. Similarly, Dominica’s high markets that have no free trade another export target. Between 2001 and tariffs could not curtail the 13% average arrangements, or special import 2010, the most dynamic markets for growth in import spending between 2006 arrangements would be subject to an and 2010 (see table 2). Tariffs seem to work in conjunction with factors Table 2: CARICOM’s imports of mineral waters/aerated waters. including the import price and other industry growth factors. Importers 2010 import Unit value Import Import Import Average tariff spending (USD/unit) spending volume spending (estimated) (%) (US$’000 growth 06‐ growth 06‐ growth 09‐ Jamaica was also the top importing 10 (%) 10 (%) 10 (%) CARICOM 97,170 799 global market for CARICOM’s exports of Jamaica 32,408 964 3 ‐1 7 18.7 mineral waters/aerated waters. In 2010 Trinidad and 15,681 607 29 29 2 19 Jamaica’s import spending on this Tobago product represented 40% of CARICOM’s Guyana 11,738 803 17 13 5 19 export sales to the entire world. In 2010, Barbados 11,398 692 1 2 3 105.8 other top global markets that imported Suriname 7,150 554 10 19 CARICOM’s exports of mineral Antigua and 4,930 1,554 40 50 19.3 waters/aerated waters included Barbuda Barbados (US$9.4mn); The USA Bahamas 3,617 871 1 ‐6 ‐6 50 (US$9.1mn); Guyana (US$8.9mn), Saint Vincent and 3,297 1,884 5 ‐10 28 19.1 the Grenadines Suriname (US$3.7mn), St. Vincent & The Dominica 1,780 1,890 13 ‐11 ‐4 78.7 Grenadines (US$2.4mn), Dominica Belize 1,551 562 41 52 ‐2 96.8 (US$1.5mn), France (US$1.3mn) and The Saint Lucia 1,440 869 ‐3 ‐1 ‐8 19.1 United Kingdom (US$1mn). Haiti 1,042 405 17 3 13 20 CARICOM exporters can investigate high Grenada 594 1,086 7 ‐3 ‐19 19.1 priced markets such as those mentioned Saint Kitts and 473 837 0 ‐3 ‐9 24.1 Nevis in section 1 above. Of these premium Montserrat 71 772 47 51 51 ... priced markets, 20% tariffs are applied to aerated waters/mineral waters exports Source: International Trade Centre www.trademap.com retrieved January 17, 2012. to Nigeria and 14% tariffs in Mauritius. Hyper growth in import spending on average tariff of 2.1%. importing CARICOM’s exports of aerated mineral waters was observed in Nigeria waters/mineral waters included Colombia between 2009 and 2010 where imports Imports of mineral waters/aerated waters (74% average growth per year); Panama jumped by 4,124% in a single year from into Canada, are duty free from CARICOM, (44% average growth); The UK (18%); St. US$45,000 in 2009 to US$1.9mn in 2010. whilst imports from other markets that Vincent & the Grenadines (19%); and have no free trade arrangements, or Dominica (18%). These markets should 3.2 Tariff Preference Strategy special import arrangements would be remain markets of strategic export focus subject to an average tariff of 5%. for the industry. However, the industry CARICOM exporters enjoy a tariff Additionally, the CARICOM market could retreated from exporting mineral waters preference (i.e. a price advantage be another strategic priority as the to some markets including Montserrat; proffered because CARICOM exports are Common External Tariff (CET) applied on Trinidad & Tobago; Grenada; St. Kitts & not dutiable whilst competitors exports this product is generally high, providing a Nevis and St. Lucia. Most of these markets of aerated waters/mineral waters are “competitive blanket” for regional are duty free for CARICOM exporters. subject to duties) in most key external exporters. However, non‐CARICOM markets. Importers of aerated waters in imports of mineral/aerated waters have the USA would not have to pay duties on been penetrating CARICOM’s market. ************** imports from CARICOM countries Between 2001 and 2010, non‐CARICOM (assuming they meet the eligible criteria imports of aerated beverages grew by 14% www.crnm.org