Line Operations Analytics (Fortune 500 Technology Company)
•Als PPTX, PDF herunterladen•
0 gefällt mir•1,023 views

A technology company was experiencing issues with throughput, utilization, and yield in its printer manufacturing operations. BRIDGEi2i worked with the company over 2 months to develop an interactive Tableau dashboard accessible on mobile devices. The dashboard calculated key performance metrics from historical build data, product bills of materials, shortage reports, and other operational data sources. Using causal analysis methods, the dashboard identified gaps in throughput, utilization, and yield metrics and plotted trends to reveal leading indicators of line and station-level bottlenecks. This allowed line management to proactively monitor manufacturing performance and address issues in real-time for timely resolution.

Empfohlen
Weitere ähnliche Inhalte
Was ist angesagt?
Was ist angesagt? (20)
Andere mochten auch
Andere mochten auch (20)
Ähnlich wie Line Operations Analytics (Fortune 500 Technology Company)
Ähnlich wie Line Operations Analytics (Fortune 500 Technology Company) (20)
Mehr von BRIDGEi2i Analytics Solutions
Mehr von BRIDGEi2i Analytics Solutions (20)
Kürzlich hochgeladen
Kürzlich hochgeladen (20)
Line Operations Analytics (Fortune 500 Technology Company)
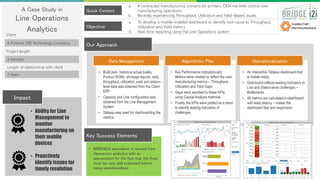
- 1. A Case Study in Line Operations Analytics A Fortune 500 Technology Company Quick Context Objective a. A contracted manufacturing scenario for printers; OEM has little control over manufacturing operations b. Recently experiencing Throughput, Utilization and Yield related issues Impact • BRIDGEi2i specializes in several Line Operations analytics with an appreciation for the fact that the fixes must be very well evaluated before being operationalized Key Success Elements Our Approach 2 Months 2 Years Client Project length Length of relationship with client • Build plan, historical actual builds, Product BOMs, shortage reports, daily throughput, utilization, yield and station- level data was obtained from the Client ERP • Capacity and Line configuration was obtained from the Line Management System • Tableau was used for dashboarding the metrics • Key Performance Indicators and Metrics were created to reflect the core manufacturing metrics – Throughput, Utilization and Yield Gaps • Gaps were ascribed to these KPIs using Causal Analysis methods • Finally, the KPIs were plotted as a trend to identify leading indicators of challenges • An Interactive Tableau dashboard that is mobile-ready • Dashboard reflects leading indicators to Line and Station-level challenges – Bottlenecks • All metrics are calculated in-dashboard with least latency – makes the dashboard fast and responsive Data Management Algorithmic Play Operationalization a. To develop a mobile-enabled dashboard to identify root cause to Throughput, Utilization and Yield metrics b. Real-time reporting using the Line Operations system • Ability for Line Management to monitor manufacturing on their mobile devices • Proactively identify issues for timely resolution