Empfohlen

Empfohlen
Weitere ähnliche Inhalte
Was ist angesagt?
Was ist angesagt? (10)
Andere mochten auch
Ähnlich wie NetBioSIG2012 paulpavlidis
Ähnlich wie NetBioSIG2012 paulpavlidis (20)
Mehr von Alexander Pico
Mehr von Alexander Pico (20)
NetBioSIG2012 paulpavlidis
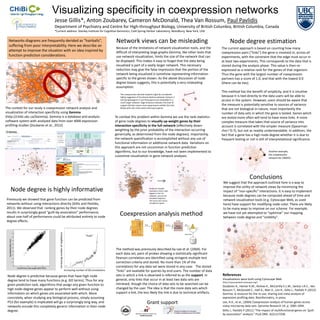
- 1. Visualizing specificity in coexpression networks Jesse Gillis*, Anton Zoubarev, Cameron McDonald, Thea Van Rossum, Paul Pavlidis Department of Psychiatry and Centre for High-throughput Biology, University of British Columbia, British Columbia, Canada *Current address: Stanley Institute for Cognitive Genomics, Cold Spring Harbor Laboratory, Woodbury, New York, USA Networks diagrams are frequently derided as “hairballs”, Network views can be misleading Node degree estimation suffering from poor interpretability. Here we describe an Because of the limitations of network visualization tools, and the The current approach is based on counting how many attempt to improve the situation with an idea inspired by difficult of interpreting large graphs Gemma, like other tools that coexpression pairs (“links”) the gene is involved in, across all function prediction considerations. use network visualization, limits the size of the network that can experiments, with the constraint that the edge must occur in be displayed. This makes it easy to forget that the data being at least two experiments. This corresponds to the data that is visualized is part of a vastly larger network. This necessary stored during the analysis phase. This value is then re- reduction may give the false impression that the portion of the expressed as a relative rank for the genes of that organism. network being visualized is somehow representing information Thus the gene with the largest number of coexpression specific to the genes shown. As the above discussion of node partners has a score of 1.0, and that with the lowest 0.0 degree biases suggests, this is potentially a very misleading (there can be ties). assumption. This method has the benefit of simplicity, and it is intuitive This coexpression-derived network might be considered highly suggestive of functional relations between Ankyrin 2 because it is tied directly to the data users will be able to and Synaptotagmin 4, but these genes are embedded in a access in the system. However, users should be aware that much larger network. Edge thickness indicates the level of support (thicker means more experiments exhibit this link). the measure is potentially sensitive to sources of variance The context for our study is coexpression network analysis and Nodes with red circles were initial query genes. that are not biological in nature, most importantly the visualization of interaction specificity using Gemma number of data sets in which the gene is tested. Genes which (http://chibi.ubc.ca/Gemma). Gemma is a database and analysis To combat this problem within Gemma we use the rank statistics are tested more often will tend to have more links. A more software system with analyzed data from over 4000 expression of gene node degrees to visually up-weight genes by their complex measure that takes that source of variance into profiling studies (Zoubarev et al., 2012) interaction specificity in the full network (effectively down- account is correlated with the simpler measure (Spearman weighting by the prior probability of the interaction occurring rho=~0.7), but not as readily understandable. In addition, the generically, as determined from the node degrees). Importantly, fact that a gene has a high node degree whether it is due to the network sparsification is accomplished without any use of frequent testing or not is still of interpretational significance. functional information or additional network data. Variations on this approach are not uncommon in function prediction algorithms, but to our knowledge, have not been implemented to Another example, the coexpression customize visualization in gene network analyses. network for CBWD5. Conclusions We suggest that the approach outlined here is a way to improve the utility of network views by minimizing the Node degree is highly informative Nodes are shaded inversely to their node degree in the full impact of “non-specific” interactions. It is easy to implement network, not just the because node degrees can be computed ahead of time and visualized fragment. Previously we showed that gene function can be predicted from The query was mouse network visualization tools (e.g. Cytoscape Web, as used networks without using interactions directly (Gillis and Pavlidis, semaphorin genes here) have support for modifying node color. There are likely 2011). We observed that ranking genes by their node degrees to be many ways to improve on our scheme. For example, results in surprisingly good “guilt-by-association” performance; about one-half of performance could be attributed entirely to node Coexpression analysis method we have not yet attempted to “optimize” our mapping between node degree and “visibility”. degree effects. Increasing number of neighbours “hubs” The method was previously described by Lee et al. (2004). For each data set, pairs of probes showing a statistically significant Pearson correlation are identified using stringent multiple test correction criteria and stored. No more than 1% of the correlations for any data set were stored in any case. The stored Increasing number of GO annotations “links” are available for queries by end-users. The number of data Node degree is predictive because genes that have high node sets in which a link is observed is referred to as the support. In References degree tend to have many functions (e.g. GO terms). Thus for any general, only links that occur in at least two data sets are Visualizations were built using Cytoscape Web (http://cytoscapeweb.cytoscape.org/) given prediction task, algorithms that assign any given function to retrieved, though the choice of data sets to be searched can be Zouberev A., Hamer K.M., Keshav K., McCarthy E.L.M., Santos J.R.C., Van high node-degree genes appear to perform well without using changed by the user. The idea is that the more data sets which Rossum T., McDonald C., Hall A., Wan X., Lim R., Gillis J., Pavlidis P. (2012) information on which genes are associated with which. More support a link, the less likely the link is due to technical artifacts. Gemma: A resource for the re-use, sharing and meta-analysis of concretely, when studying any biological process, simply assuming expression profiling data. Bioinformatics, in press. P53 (for example) is implicated will go a surprisingly long way, and Grant support Lee, H.K., et al., (2004) Coexpression analysis of human genes across networks encode this completely generic information in their node many microarray data sets. Genome Research 14: p. 1085-1094. degree. Gillis J., Pavlidis P (2011) “The impact of multifunctional genes on “guilt by association” analysis.” PLoS ONE. 6(2):e17258.