Evaluation and implications of greenhouse gas and energy targert management system in korea
•
0 gefällt mir•213 views

International peer-reviewed academic journals call for papers, http://www.iiste.org

Empfohlen
Empfohlen
Weitere ähnliche Inhalte
Was ist angesagt?
Was ist angesagt? (19)
Andere mochten auch
Andere mochten auch (20)
Ähnlich wie Evaluation and implications of greenhouse gas and energy targert management system in korea
Ähnlich wie Evaluation and implications of greenhouse gas and energy targert management system in korea (20)
Mehr von Alexander Decker
Mehr von Alexander Decker (20)
Kürzlich hochgeladen
Kürzlich hochgeladen (20)
Evaluation and implications of greenhouse gas and energy targert management system in korea
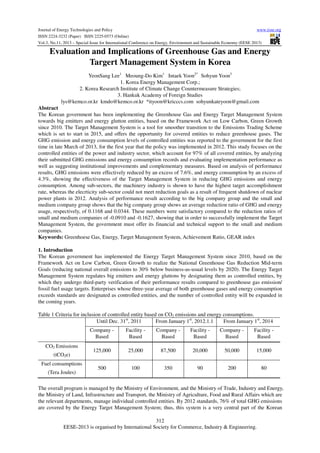
- 1. Journal of Energy Technologies and Policy www.iiste.org ISSN 2224-3232 (Paper) ISSN 2225-0573 (Online) Vol.3, No.11, 2013 – Special Issue for International Conference on Energy, Environment and Sustainable Economy (EESE 2013) Evaluation and Implications of Greenhouse Gas and Energy Targert Management System in Korea YeonSang Lee1 Meoung-Do Kim1 Intaek Yoon2* Sohyun Yoon3 1. Korea Energy Management Corp.; 2. Korea Research Institute of Climate Change Countermeasure Strategies; 3. Hankuk Academy of Foreign Studies lys@kemco.or.kr kmdo@kemco.or.kr *ityoon@kricccs.com sohyunkateyoon@gmail.com Abstract The Korean government has been implementing the Greenhouse Gas and Energy Target Management System towards big emitters and energy glutton entities, based on the Framework Act on Low Carbon, Green Growth since 2010. The Target Management System is a tool for smoother transition to the Emissions Trading Scheme which is set to start in 2015, and offers the opportunity for covered entities to reduce greenhouse gases. The GHG emission and energy consumption levels of controlled entities was reported to the government for the first time in late March of 2013, for the first year that the policy was implemented in 2012. This study focuses on the controlled entities of the power and industry sector, which account for 97% of all covered entities, by analyzing their submitted GHG emissions and energy consumption records and evaluating implementation performance as well as suggesting institutional improvements and complementary measures. Based on analysis of performance results, GHG emissions were effectively reduced by an excess of 7.6%, and energy consumption by an excess of 4.3%, showing the effectiveness of the Target Management System in reducing GHG emissions and energy consumption. Among sub-sectors, the machinery industry is shown to have the highest target accomplishment rate, whereas the elecrticity sub-sector could not meet reduction goals as a result of frequent shutdown of nuclear power plants in 2012. Analysis of performance result according to the big company group and the small and medium company group shows that the big company group shows an average reduction ratio of GHG and energy usage, respectively, of 0.1168 and 0.0344. These numbers were satisfactory compared to the reduction ratios of small and medium companies of -0.0910 and -0.1627, showing that in order to successfully implement the Target Management System, the government must offer its financial and technical support to the small and medium companies. Keywords: Greenhoese Gas, Energy, Target Management System, Achievement Ratio, GEAR index 1. Introduction The Korean government has implemented the Energy Target Management System since 2010, based on the Framework Act on Low Carbon, Green Growth to realize the National Greenhouse Gas Reduction Mid-term Goals (reducing national overall emissions to 30% below business-as-usual levels by 2020). The Energy Target Management System regulates big emitters and energy gluttons by designating them as controlled entities, by which they undergo third-party verification of their performance results compared to greenhouse gas emission/ fossil fuel usage targets. Enterprises whose three-year average of both greenhouse gases and energy consumption exceeds standards are designated as controlled entities, and the number of controlled entity will be expanded in the coming years. Table 1 Criteria for inclusion of controlled entity based on CO2 emissions and energy consumptions. Until Dec. 31st, 2011 From January 1st, 2012.1.1 From January 1st, 2014 Company Based CO2 Emissions (tCO2e) Fuel consumptions (Tera Joules) Facility Based Company Based Facility Based Company Based Facility Based 125,000 25,000 87,500 20,000 50,000 15,000 500 100 350 90 200 80 The overall program is managed by the Ministry of Environment, and the Ministry of Trade, Industry and Energy, the Ministry of Land, Infrastructure and Transport, the Ministry of Agriculture, Food and Rural Affairs which are the relevant departments, manage individual controlled entities. By 2012 standards, 76% of total GHG emissions are covered by the Energy Target Management System; thus, this system is a very central part of the Korean 312 EESE-2013 is organised by International Society for Commerce, Industry & Engineering.
- 2. Journal of Energy Technologies and Policy www.iiste.org ISSN 2224-3232 (Paper) ISSN 2225-0573 (Online) Vol.3, No.11, 2013 – Special Issue for International Conference on Energy, Environment and Sustainable Economy (EESE 2013) government’s GHG reduction policy. Table 2 shows the number of enterprises regulated by relevant departments, and the expected versus permitted GHG emissions. Also, Table 3 shows more specifically the predicted emissions, permitted emissions, and reduction coefficient in each industrial classification. Table 2 Predicted emissions and permitted emissions by controlled entities in 2012. Controlled Base year average Expected Permitted Sector Entities emissions(‘07~’09) emissions emissions Food & Agri. 26 2,351 Power & Ind. 366 466,006 Waste 21 9,390 Building & 45 7,290 Transportation Total 458 485,037 Unit : Number of Companies, 1,000tCO2e Reduction(Ave. reduction rate) 2,770 585,158 10,109 2,746 576,833 9,855 24(0.88%) 8,325(1.42%) 254(2.51%) 8,306 8,182 124(1.49%) 606,343 597,616 8,727(1.44%) Table 3 Predicted, permitted emissions, and reduction coefficient of the power and industry sector in 2012. Number of Expected emissions Permitted emissions Industrial Classification Reduction coefficient company in 2012 in 2012 Electricity Industry 33 242,924 239,279 0.985 Steel Industry 38 119,669 118,350 0.989 Cement Industry 24 50,369 49,864 0.99 Petrochemical Industry 76 59,708 58,938 0.9872 Oil Refining Industry 4 34,803 34,354 0.9871 Semiconductor, Display 34 37,358 36,268 0.9812 Paper Industry 55 9,749 9,605 0.986 Nonferrous Industry 17 6,181 6,100 0.987 Automobile Industry 19 4,462 4,415 0.9898 Ceramic Industry 20 5,257 5,193 0.986 Textile Industry 13 5,534 5,465 0.9883 Shipbuilding Industry 8 3,349 3,307 0.9882 Communication Industry 5 3,586 3,516 0.9803 Machinery Industry 18 1,969 1,942 0.9801 Mining Industry 2 240 238 0.9952 Total 366 585,158 576,834 The goal of this study is to analyze the GHG emissions and energy consumption performance of the controlled entities of the power and industry sector in 2012, which was the first year that the Target Management System was implemented. This study will analyze the outcomes of implementation, and suggest points of improvement in the policy. 2. Method There are 366 controlled entities in the power and industry sector, which accounts for approximately 80% of the total controlled entities. In terms of emissions, the subjects in the power and industry sector account for approximately 97% of total emissions. The analyzed data in this study is derived from 355 certified statements and performance result reports of 15 types of business in the power and industry sector. To evaluate target achievement, the Greenhouse Gas and Energy Achievement Ratio (GEAR) index was utilized. The GEAR ratio is defined as the ratio of GHG emissions or energy consumption levels to permitted energy consumption levels of controlled entities. Moreover, to easily gauge whether goals were met, the GEAR ratio was ultimately defined 313 EESE-2013 is organised by International Society for Commerce, Industry & Engineering.
- 3. Journal of Energy Technologies and Policy www.iiste.org ISSN 2224-3232 (Paper) ISSN 2225-0573 (Online) Vol.3, No.11, 2013 – Special Issue for International Conference on Energy, Environment and Sustainable Economy (EESE 2013) as (1-ratio) (Equation 1). That is, in the case that the target was met, the GEAR value is positive (+); if it was not and additional reduction is necessary, then the value is negative (-) GEAR(GHG)=1- or GEAR(Energy)=1- (1) where n refers to the type of business, which is the 15 industrial classifications(sub-sectors) within the power and energy sector. 3. Results This study is based on analyzed data from 335 certified statements and performance result reports of controlled entities in the power and industry sector. Target achievement evaluation consists of three methods: 1) the achievement rate of all 335 controlled entities, 2) the achievement rate of all 15 individual industrial classifications, and 3) the achievement rate of both the big company group and the small and medium company group. 3.1 Evaluation of all controlled entities of the power and industry sector As stated previously, the power and industry sector accounts for 97% of the total GHG emissions of all controlled entities; thus, this sector is an important and crucial part of the Target Management System. According to analysis, the total permitted emissions of 335 controlled entities was 564,032,343 t CO2e. The real GHG emissions was 524,338,681 t CO2e, amounting to 92.96% of the target amount and therefore reaching a surplus achievement of 7.3%. Allotted energy consumption amount was 7,180,854TJ, whereas the actual amount was 6,873,517 TJ, equaling a surplus achievement of 4.28%. The average GHG reduction rate of each enterprise was 0.0858, and the energy reduction rate was 0.0042. In the case of GHG, the emitted amount as compared to target amounts (GEAR) ranged from 0.69 to -11.17. This was a larger deviation than that of energy consumption amounts as compared to target amounts, which ranged from 0.91 to -10.96. Table 4 and Figure 1 show the GEAR values of both GHG and energy consumption of 335 companies (Fig. 1). Table 4 Statistical characteristics of the GHG and energy achievement ratio. GHG ENERGY Mean 0.085811 0.004201 Median 0.140775 0.079591 Maximum 0.696241 0.910266 Minimum -11.17002 -10.96259 Std. Dev. 0.720270 0.747279 Skewness -12.16504 -10.37013 Kurtosis 182.3040 143.3496 Jarque-Bera 457022.2 280955.8 Probability 0.000000 0.000000 Sum 28.74668 1.407179 Sum Sq. Dev. 173.2756 186.5143 Observations 335 335 314 EESE-2013 is organised by International Society for Commerce, Industry & Engineering.
- 4. Journal of Energy Technologies and Policy www.iiste.org ISSN 2224-3232 (Paper) ISSN 2225-0573 (Online) Vol.3, No.11, 2013 – Special Issue for International Conference on Energy, Environment and Sustainable Economy (EESE 2013) 1 1 G EA R (A chi evem ent R ati o) G EAR ( Achi evem ent R ati o) 0 0 -1 -2 -3 -1 -2 -3 -4 -5 -4 50 100 150 200 250 50 300 10 0 15 0 2 00 2 50 300 N N Fig. 1 Achievement ratios of 335 controlled entities (left : GHG, right : energy). Upon closer examination of the achievement ratios, it can be seen that 285 companies out of total 335 achieved goals in GHG, and 241 companies achieved goals in energy consumption, making achievement rates 85% and 72%, respectively. Most companies were distributed between 0 and 0.2 (Fig. 3) 160 160 GHG EN ER G Y 120 100 100 Freq uency 140 120 Freq u en cy 140 80 80 60 60 40 40 20 20 0 0 -12 -11 -10 -9 -8 -7 -6 -5 A ch i evem ent R ati o -4 -3 -2 -1 0 1 -1 1 -10 -9 -8 -7 -6 -5 -4 -3 -2 -1 0 1 2 A ch i evem ent R ati o Fig. 2 Histograms of the achievement ratios of 335 controlled entities (left : GHG, right : energy). 3.2 Evaluation of each industrial classification within the power and industry sector The subjects of the Target Management System in the power and industry sector are split again among 15 industrial classifications, according to the types of business. Subjects must submit GHG and energy consumption levels of the past 3 years to the government, which must in turn designate permitted GHG emission and energy consumption rates based on the GHG reduction goals and reduction coefficient of each industry. Table 5 shows the levels/amounts of standard emission, standard energy consumption, allowed GHG emissions, actual GHG emissions, allowed energy consumption, actual energy consumption, GHG goal achievement ratio, and energy goal achievement ratio. The average GHG goal achievement ratio for overall industry is 0.136, whereas the energy goal achievement ratio for overall sub-sector is 0.098, indicating that the reduction ratio of GHG was higher than that of energy (Table 6). For GHG, the achievement ratio of the machinery industry was highest, whereas for energy, the semiconductor sub-sector showed best performance. The sub-sectors that failed for GHG was the generation and energy, and for energy consumption, the mining sub-sector and the generation and energy sub-sector, showing a general failure in the generation and energy sub-sector to meet goals(Fig. 3). This is estimated to be a result of the use of fossil fuels in generation to meet summer electricity demands, due to frequent failure of nuclear power plants. According to correlation analysis of the achievement ratio of GHG and energy consumption goals of the 15 subsectors, there is a relatively high correlation of 0.85 (Table 7). This shows that the sub-sectors that were able to successfully reduce GHG emissions were also able to reduce energy usage. 315 EESE-2013 is organised by International Society for Commerce, Industry & Engineering.
- 5. Journal of Energy Technologies and Policy www.iiste.org ISSN 2224-3232 (Paper) ISSN 2225-0573 (Online) Vol.3, No.11, 2013 – Special Issue for International Conference on Energy, Environment and Sustainable Economy (EESE 2013) Table 5 Achievement ratio based on industrial classification(sub-sectors) in 2012. Industrial Classification Base emissions Base energy consum. GHG permitted GHG emission Aallowed Energy. consu. Energy usage GEAR GHG GEAR Energy Mining Indus. 236,277 1,447 238,240 236,831 1,460 1,485 0.0059 -0.0173 Textile Indus. 2,977,457 49,834 3,753,082 3,154,638 64,441 54,565 0.1595 0.1533 Paper ndustry 7,404,282 116,682 9,118,321 7,573,492 148,194 139,199 0.1694 0.0607 Oil Refining 24,814,090 287,111 34,607,124 28,639,846 397,665 381,513 0.1724 0.0406 Petrochemical 47,684,520 789,613 60,754,992 50,262,528 1,007,029 898,371 0.1727 0.1079 Ceramic Indu. 4,140,400 43,884 5,186,534 4,421,299 58,270 48,249 0.1475 0.1720 Cement Indus. 44,833,400 231,633 48,155,224 42,313,496 251,533 222,632 0.1213 0.1149 Steel Industry 82,683,488 960,085 118,167,584 105,313,072 1,430,393 1,276,413 0.1088 0.1076 Nonferrous 4,531,196 69,553 5,956,530 5,461,264 91,442 87,194 0.0831 0.0465 Machinery 1,488,358 27,175 2,114,970 1,610,348 38,784 30,861 0.2386 0.2043 Semiconduct 17,798,962 240,090 32,173,148 25,247,314 435,080 338,003 0.2153 0.2231 Automobile 3,406,751 65,460 4,402,568 3,883,793 82,617 78,405 0.1178 0.0510 Shipbuilding 2,370,265 38,666 3,307,258 2,590,439 54,570 45,027 0.2167 0.1749 Electricity 21,194,2496 2,716,011 232,610,416 240,986,080 3,052,125 3,215,926 -0.0360 -0.0537 Communi 2,458,620 47,336 3,515,586 3,000,208 67,742 61,541 0.1466 0.0915 Table 6 Statistical characteristics of GHG and energy achievement ratio based on industrial classification GHG ENERGY Mean 0.135982 0.098488 Median 0.147543 0.107649 Maximum 0.238595 0.223124 Minimum -0.036007 -0.053668 Std. Dev. 0.074882 0.079167 Skewness -0.917044 -0.214076 Kurtosis 3.329121 2.299188 Jarque-Bera 2.170125 0.421532 Probability 0.337881 0.809964 Sum 2.039732 1.477324 Sum Sq. Dev. 0.078503 0.087744 Observations 15 15 316 EESE-2013 is organised by International Society for Commerce, Industry & Engineering.
- 6. Journal of Energy Technologies and Policy www.iiste.org ISSN 2224-3232 (Paper) ISSN 2225-0573 (Online) Vol.3, No.11, 2013 – Special Issue for International Conference on Energy, Environment and Sustainable Economy (EESE 2013) .5 2 .5 2 GHG ENERGY .0 2 .0 2 A ch i ve m en t R atio e .5 1 A ch ievem en t R atio .5 1 .0 1 .5 0 .0 1 .5 0 .0 0 .0 0 -. 5 0 -. 5 0 n tio ica m Co El ec t ri cit m un in g at io n ild er bu y G Sh ip en r ile to ob uc to m nd ic o m Au s ry ro u hi ne M ac Se us t ry er nd nf lI ee en m No ry t ry st us tI nd du Ce St us t ry lI ic ica am er C em Pe t ro ch In nd ef il R g in ak O In d us t ry in in g st ry st ry du du In Te pe rM M xt ile In in in g in g ti o n ica un m m Co Pa Pe El t ro ec t ric io n at ild ip bu en er G Sh ity or to m Au Se m ob ile er y i co nd uc t us hi n ac M t ry t ry ro er No nf us nd us nd tI ee lI en St m m Ce ic In du s st ry t ry ng ra em ch M Ce i ca lI il R ef nd u in i ry du st In ak O in g ile Te xt Pa pe r M in in g In In du st du st ry ry -. 0 1 Fig. 3 Achievement ratios based on the industrial classification(sub-sector) (left : GHG, right : energy). Table 4 Correlation coefficient between GHG and energy achievement ratio. GHG GHG 1 ENERGY 0.84688 ENERGY 0.84688 1 3.3 Evaluation of achievement ratios in the big company group and small and medium company group in the power and industry sector Among the 335 controlled entiries of the Target Management System, there are 50 small and medium companies, amounting to about 15% of the total. Analysis of basic statistics shows that the average reduction ratio of big companies is 0.1168 for GHG and 0.0334 for energy. This is a relatively high achievement rate compared to 0.0910 and -0.1627 respectively for small and medium companies (Table 8). Thus, larger companies in the big company group were able to successfully reduce carbon emissions, whereas small and medium companies mostly faced difficulty in doing so. This alludes to the limited human resources, financial support, and technical support that small and medium companies receive and the poor surroundings that they face as a result. Therefore, for efficient reduction of GHG emissions and energy consumption, the government should approach policies towards small and medium companies through financial and technical support rather than regulations. Moreover, the correlation between energy and GHG goal achievement rates are shown to be higher in small and medium companies at 0.977. This shows that small and medium sized companies generally face problems in both GHG reduction and energy consumption reduction, showing a correlation in a negative sense. Figure 4 shows the achievement ratios of the big company group and the small and medium business group. Table 8 Statistical characteristics of the GHG and energy achievement ratio based on company size Big Company Group Small-medium Company Group GHG ENERGY GHG ENERGY Mean 0.116833 0.033482 -0.091012 -0.162701 Median 0.144630 0.083138 0.093431 0.060276 Maximum 0.675218 0.910266 0.696241 0.767965 Minimum -3.634059 -4.111113 -11.17002 -10.96259 Std. Dev. 0.384710 0.447245 1.607841 1.599182 Skewness -5.69345 -4.86789 -6.603505 -6.223456 Kurtosis 47.48685 37.28390 45.99964 42.46382 Jarque-Bera 25129.17 15136.21 4299.713 3638.677 Probability 0.000000 0.000000 0.000000 0.000000 Sum 33.41412 9.575732 -4.641621 -8.297772 Sum Sq. Dev. 42.18044 57.00796 129.2576 127.8692 Observations 285 285 50 50 317 EESE-2013 is organised by International Society for Commerce, Industry & Engineering.
- 7. Journal of Energy Technologies and Policy www.iiste.org ISSN 2224-3232 (Paper) ISSN 2225-0573 (Online) Vol.3, No.11, 2013 – Special Issue for International Conference on Energy, Environment and Sustainable Economy (EESE 2013) Table 9 Correlation coefficient between GHG and energy achievement ratio. Big Company Group Small-medium Company Group GHG ENERGY GHG ENERGY GHG 1 0.8857859 1.000000 0.977892 ENERGY 0.8857859 1 0.977892 1.000000 1 0 Ach i vem en t R atio e 1 0 -1 -1 -2 -2 -3 -3 EN ERG Y GHG -4 -4 25 50 75 1 00 125 1 50 1 75 200 2 25 250 2 75 25 50 75 100 Com pan y N o 1 50 1 75 2 00 225 2 50 275 Com pany N o 2 2 0 0 -2 -2 -4 -4 -6 -6 -8 A chievem ent R atio 1 25 -8 -10 -10 GHG EN ERG Y -12 -12 5 10 15 20 25 Com pany N o 30 35 40 45 50 5 10 15 20 25 30 35 40 45 50 Com pany N o Fig. 4 Achievement ratios based on company size (top: big company, bottom: small-medium company). 4. Discussion This study was conducted by analyzing the achievement ratio index of reducing GHG and energy consumption of 335 controlled entities in the power and industry sector. Three methods were utilized to evaluate target achievement. 1) the achievement ratio of all 355 controlled entities, 2) the achievement ratio of all 15 individual industrial classifications, and 3) the achievement ratio of both the big company group and the small and medium company group. Results show that the power and industry sector accomplished a surplus achievement in GHG and energy use reduction of 7.3% and 4.28%, respectively. Analysis of GHG reduction and energy consumption reduction for each company showed that GHG reduction had a lesser disparity than energy consumption reduction. According to sector analysis, the average GHG achievement ratio was 0.136 and the energy achievement rate 0.098, making the reduction ratio of GHG higher than that of energy. For individual sectors, data showed that the machinery industry had a high achievement ratio, whereas the generation and energy industry could not accomplish goals. This could be because yearly differences in energy supply and demand were not initially factored in designating allowed emission/consumption levels. Therefore, there was an increase in fossil fuel usage following frequent shutdowns of nuclear power plants in 2012 when the energy demand was high in the summer. Finally, comparison of reduction ratios of the big company group and the small and medium company group shows that the achievement ratio of the big company group for GHG and energy consumption was 0.1168 and 0.0334, respectively, which was higher than the ratio for small and medium companies at -0.0910 and -0.1627. This shows that larger companies could reduce GHG emissions through the Target Management System, whereas small and medium companies could not, indirectly bringing to light the limited human, financial, technical resources of smaller companies. Therefore, this shows the need for government support both financially and 318 EESE-2013 is organised by International Society for Commerce, Industry & Engineering.
- 8. Journal of Energy Technologies and Policy www.iiste.org ISSN 2224-3232 (Paper) ISSN 2225-0573 (Online) Vol.3, No.11, 2013 – Special Issue for International Conference on Energy, Environment and Sustainable Economy (EESE 2013) technically in order to facilitate GHG reduction and energy consumption reduction. References Greenhouse Gas Inventory & Research Center of Korea, http://www.gir.go.kr 2020 Low Carbon, Green Society Roadmap, published July 2011, http://bit.ly/13WndBU Press release (in Korean), Ministry of Environment, Finalize the emission reduction target in 2013, 2012.10.10, http://www.me.go.kr Press release (in Korean), Ministry of Environment, Finalize the emission reduction target for the controlled entities in 2012, 2011.10.10, http://www.me.go.kr Bloomberg New Energy Finance, South Korea’s Emissions Trading Scheme White Paper, 2013.5.10 Point Carbon, South Korea’s carbon market emissions forecast, 2013.9.26 319 EESE-2013 is organised by International Society for Commerce, Industry & Engineering.
- 9. This academic article was published by The International Institute for Science, Technology and Education (IISTE). The IISTE is a pioneer in the Open Access Publishing service based in the U.S. and Europe. The aim of the institute is Accelerating Global Knowledge Sharing. More information about the publisher can be found in the IISTE’s homepage: http://www.iiste.org CALL FOR JOURNAL PAPERS The IISTE is currently hosting more than 30 peer-reviewed academic journals and collaborating with academic institutions around the world. There’s no deadline for submission. Prospective authors of IISTE journals can find the submission instruction on the following page: http://www.iiste.org/journals/ The IISTE editorial team promises to the review and publish all the qualified submissions in a fast manner. All the journals articles are available online to the readers all over the world without financial, legal, or technical barriers other than those inseparable from gaining access to the internet itself. Printed version of the journals is also available upon request of readers and authors. MORE RESOURCES Book publication information: http://www.iiste.org/book/ Recent conferences: http://www.iiste.org/conference/ IISTE Knowledge Sharing Partners EBSCO, Index Copernicus, Ulrich's Periodicals Directory, JournalTOCS, PKP Open Archives Harvester, Bielefeld Academic Search Engine, Elektronische Zeitschriftenbibliothek EZB, Open J-Gate, OCLC WorldCat, Universe Digtial Library , NewJour, Google Scholar