Effects of source of reinforcement on microstructure and strength characteristics of reinforced concrete beams
•
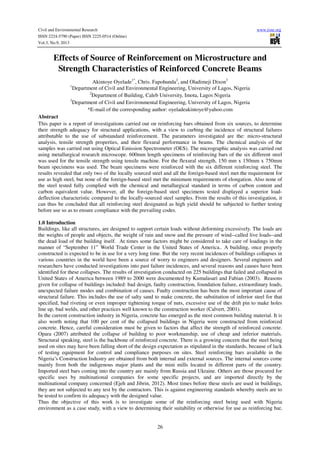
1 gefällt mir•482 views

International peer-reviewed academic journals call for papers, http://www.iiste.org

Empfohlen
Empfohlen
Weitere ähnliche Inhalte
Was ist angesagt?
Was ist angesagt? (20)
Andere mochten auch
Andere mochten auch (20)
Ähnlich wie Effects of source of reinforcement on microstructure and strength characteristics of reinforced concrete beams
Ähnlich wie Effects of source of reinforcement on microstructure and strength characteristics of reinforced concrete beams (20)
Mehr von Alexander Decker
Mehr von Alexander Decker (20)
Kürzlich hochgeladen
Kürzlich hochgeladen (20)
Effects of source of reinforcement on microstructure and strength characteristics of reinforced concrete beams
- 1. Civil and Environmental Research www.iiste.org ISSN 2224-5790 (Paper) ISSN 2225-0514 (Online) Vol.3, No.9, 2013 26 Effects of Source of Reinforcement on Microstructure and Strength Characteristics of Reinforced Concrete Beams Akintoye Oyelade1* , Chris. Fapohunda2 , and Oladimeji Dixon3 1 Department of Civil and Environmental Engineering, University of Lagos, Nigeria 2 Department of Building, Caleb University, Imota, Lagos Nigeria 3 Department of Civil and Environmental Engineering, University of Lagos, Nigeria *E-mail of the corresponding author: oyeladeakintoye@yahoo.com Abstract This paper is a report of investigations carried out on reinforcing bars obtained from six sources, to determine their strength adequacy for structural applications, with a view to curbing the incidence of structural failures attributable to the use of substandard reinforcement. The parameters investigated are the: micro-structural analysis, tensile strength properties, and their flexural performance in beams. The chemical analysis of the samples was carried out using Optical Emission Spectrometer (OES). The micrographic analysis was carried out using metallurgical research microscope. 600mm length specimens of reinforcing bars of the six different steel was used for the tensile strength using tensile machine. For the flexural strength, 150 mm x 150mm x 750mm beam specimens was used. The beam specimens were reinforced with the six different reinforcing steel. The results revealed that only two of the locally sourced steel and all the foreign-based steel met the requirement for use as high steel, but none of the foreign-based steel met the minimum requirements of elongation. Also none of the steel tested fully complied with the chemical and metallurgical standard in terms of carbon content and carbon equivalent value. However, all the foreign-based steel specimens tested displayed a superior load- deflection characteristic compared to the locally-sourced steel samples. From the results of this investigation, it can thus be concluded that all reinforcing steel designated as high yield should be subjected to further testing before use so as to ensure compliance with the prevailing codes. 1.0 Introduction Buildings, like all structures, are designed to support certain loads without deforming excessively. The loads are the weights of people and objects, the weight of rain and snow and the pressure of wind--called live loads--and the dead load of the building itself. At times some factors might be considered to take care of loadings in the manner of “September 11” World Trade Center in the United States of America.. A building, once properly constructed is expected to be in use for a very long time. But the very recent incidences of buildings collapses in various countries in the world have been a source of worry to engineers and designers. Several engineers and researchers have conducted investigations into past failure incidences, and several reasons and causes have been identified for these collapses. The results of investigation conducted on 225 buildings that failed and collapsed in United States of America between 1989 to 2000 were documented by Kumalasari and Fabian (2003). Reasons given for collapse of buildings included: bad design, faulty construction, foundation failure, extraordinary loads, unexpected failure modes and combination of causes. Faulty construction has been the most important cause of structural failure. This includes the use of salty sand to make concrete, the substitution of inferior steel for that specified, bad riveting or even improper tightening torque of nuts, excessive use of the drift pin to make holes line up, bad welds, and other practices well known to the construction worker (Calvert, 2001). In the current construction industry in Nigeria, concrete has emerged as the most common building material. It is also worth noting that 100 per cent of the collapsed buildings in Nigeria were constructed from reinforced concrete. Hence, careful consideration must be given to factors that affect the strength of reinforced concrete. Opara (2007) attributed the collapse of building to poor workmanship, use of cheap and inferior materials. Structural speaking, steel is the backbone of reinforced concrete. There is a growing concern that the steel being used on sites may have been falling short of the design expectation as stipulated in the standards, because of lack of testing equipment for control and compliance purposes on sites. Steel reinforcing bars available in the Nigeria’s Construction Industry are obtained from both internal and external sources. The internal sources come mainly from both the indigenous major plants and the mini mills located in different parts of the country. Imported steel bars coming into the country are mainly from Russia and Ukraine. Others are those procured for specific uses by multinational companies for some specific projects, and are imported directly by the multinational company concerned (Ejeh and Jibrin, 2012). Most times before these steels are used in buildings, they are not subjected to any test by the contractors. This is against engineering standards whereby steels are to be tested to confirm its adequacy with the designed value. Thus the objective of this work is to investigate some of the reinforcing steel being used with Nigeria environment as a case study, with a view to determining their suitability or otherwise for use as reinforcing bar,
- 2. Civil and Environmental Research www.iiste.org ISSN 2224-5790 (Paper) ISSN 2225-0514 (Online) Vol.3, No.9, 2013 27 capable of meeting the design objectives. The parameter investigated included: micro-structural analysis, tensile strength properties, and their flexural performance in beams. 2.0 Experimental Program 2.1 Materials In the present experimental program, steel samples from six different sources or manufacturers were used. They are named L1, L2, L3, L4, F1 and F2. The steel specimens with subscripts L1-4 were from local sources, but different manufacturers and the ones with F1-2 were from external sources from different countries. Two different bar diameter of 12mm and 16mm were used for this investigation. The cement is the ordinary Portland which conforms with British Standard B.S 12:1996. The fine aggregates used was air-dried with size fractions passing through sieve o 4.75mm according to British standard. The coarse aggregates was from crushed stone from quarry with particle size range between 10 – 20mm. Both the fine and coarse aggregates were free from dirt, silt, clay and other deleterious materials. The water used was potable water. 2.2 Experimental Investigations 2.2.1 Chemical Analysis Test 12mm diameter steel bar specimens from each manufacturer was used in this study. They were designated L1, L2, L3, L4, F1 and F2. The chemical analysis of the samples was carried out using Optical Emission Spectrometer (OES). Two specimens of 12mm bar size from each sample (a total of twelve 12 specimens), and the average percentage chemical composition of the specimens recorded as the percentage chemical composition for each sample (the percentage by weight of each constituent element for a sample recorded as the average value of the obtained percentage values of each constituent element for the 2 specimens). The surface of the Y12 bar was well grounded, and then taken to a spectrometer for spark emission. 2.2.2 Micrographic Analysis The test is conducted on representative specimens of 12mm bar size from each sample (a total of six specimens). Each test specimens was sectioned across its length at a point, and rough grounded using 320µm emery papers. The sectioned surface of the specimen was polished using polishing cloth and aluminum oxide polishing powder. Afterward, prepared surface was dipped and swabbed into a Nital for 15 seconds. Etched surface was cleaned with clean water and dried and the surface viewed under a microscope. 2.2.3 Tensile Test Specimens of steel bar with diameters 12mm and 16mm were tested for each sample (a total of 36 specimens). The test specimens were machined to a length of 600mm. Two points are marked on each specimen, 150mm to the left and right of the mid-point of the specimen to produce three clear spans of 200mm along the length of the specimens. The test specimens were placed one after the other into the machine and were thereby subjected to tensile load until a plastic deformation was observed. Three samples were tested for each manufacturer and the average values were recorded. 2.2.4 Flexural and Deflection Test Twelve 150mm x 150mm x 750mm concrete beams were used for this investigation. For each of the six different types of reinforcing bars, two beams specimens were cast. In each of the beam, two numbers of 16mm bar were used at the tension zone while two numbers of 12mm bar were used at the compression zone for anchor with 8mm as links placed at 300mm interval, with a cover of 30mm. The concrete mix ratio of 1:2:4 by weight, with water–cement ratio of 0.50 were used for this investigation. Beams were cast and compacted by shutter vibrator. They were cured in a steel tank for 28 days. The beams were tested in flexure under third point load as shown in Figure (1).
- 3. Civil and Environmental Research www.iiste.org ISSN 2224-5790 (Paper) ISSN 2225-0514 (Online) Vol.3, No.9, 2013 28 T08@300c/c FIGURE 1: Beam and Loading Arrangement (Load is in KN, and dimensions in mm) The cracking and ultimate failure loads of the test specimens were determined with the aid of Avery universal testing machine with a maximum capacity of 600kN. Dial deflection gauges were positioned at the mid-point of the span and underside of the beam. A fixed roller which serves as hinge support was placed at one end and a movable rollers support at the other end.. For each increment load of 1kN, central deflection, development and propagation of cracks as well as failure loads modes were observed. 3.0 Results and Discussions 3.1 Tensile properties The tensile properties of the steel specimens tested are presented in Figure (1), Table (1) and Figure (2). For high yield strength reinforcing steel, the code, BS 4449: 1997, stipulated a minimum strength of 460N/mm2 . Table 1: Tensile properties Diameter (mm) Steel Manufacturer L1 L2 L3 L4 F1 F2 Yield Strength (N/mm2 ) 12 459.38 491.16 470.93 459.38 586.50 496.94 16 396.54 403.04 546.05 486.05 594.81 559.05 Tensile Strength (N/mm2 12 574.94 676.07 655.84 618.28 765.63 681.84 16 541.18 559.05 680.94 604.56 721.57 687.44 % Bar Elongation 12 13.83 11.66 10.16 22.16 10.00 9.33 16 14.16 21.83 13.83 17.33 15.16 13.33 Stress Ratio Rm/Re 12 1.25 1.38 1.39 1.35 1.31 1.37 16 1.36 1.39 1.25 1.24 1.21 1.23 30 2T16 2T12 Roller Support Hinge Support Loa 30 90 I-Spreader Beam 230 230 230 150 150
- 4. Civil and Environmental Research www.iiste.org ISSN 2224-5790 (Paper) ISSN 2225-0514 (Online) Vol.3, No.9, 2013 29 Reading the figures with the table, it can be observed that only two of the locally sourced steel (L2 and L3) and all the foreign steel met the minimum requirements for 12mm bars. For 16mm diameter bar however, all the foreign-based steel and two of the locally-produced steel (L3 and L4) met the requirements. All however satisfy the strength requirements for mild steel (250N/mm2 ) According to BS 4449: 1997, the minimum percent elongation after fracture is limited to 12%. Out of the steel samples that were locally sourced, only two (L1 and L4) and none of the externally sourced steel met the requirements for 12mm steel bar. All of the steel specimens however satisfy the minimum elongation requirements for 16mm diameter specimens. However, the ratio of the tensile strength to the yield strength defined as the stress ratio, for all the steel specimens exceeded the minimum specified by the code. 3.2 Micro-Structural Analysis The difference in the microstructures of the steel bars L1, L2, L3, L4, F1 and F2 are respectively shown in Figures 4(a-f). The metallographic structure consists of ferrite and pearlite phases. The relatively coarse-grained crystals and uneven distribution of grain are noticeable in L1 and L4, while the dispersion of grains in F1 and F2 is relatively fine and uniformly distributed. The relatively coarse-grained crystals observed in samples L1 and L4 may have accounted for the lower strengths observed than the samples F1 and F2 with relatively fine-grained crystals (Table 1). 3.2 Chemical properties and Metallurgical factor Table 2 shows the results of average chemical composition of various steel bars tested. From the table, it can be observed that the steel samples L1, L2, L3, L4, F1 and F2 possessed average carbon contents of 0.284, 0.318, 0.249, 0.258, 0.367 and 0.202, respectively. The code BS 4449 (1997) limits the carbon content to the maximum value of 0.25. Thus, the steel samples specimens L2 and F2 did not comply with the requirements of the code. The phosphorus and sulfur impurities in the steel bars from all the samples exceeded the
- 5. Civil and Environmental Research www.iiste.org ISSN 2224-5790 (Paper) ISSN 2225-0514 (Online) Vol.3, No.9, 2013 30 (a) (b) (c) (d) (a) (b) (c) (d) (e) (f) Figure 4: Microstructure of the Steel specimens preferred limit of 0.01%. The combined effect of excess carbon, sulfur and phosphorus contents in L3 and F2 samples will increase the strength and hardness of the steels, and at the same time decrease their ductility, making them brittle (Kamkan and Adom-Asamoah (2002). Brittleness has been found to contribute to the collapse of building structures. (Odusote and Adeleke, 2012). F1 F2 F1 F2 L1 L2 L3 L4
- 6. Civil and Environmental Research www.iiste.org ISSN 2224-5790 (Paper) ISSN 2225-0514 (Online) Vol.3, No.9, 2013 31 Table 2: Average Chemical Composition of Selected Steel Element % Steel Specimems L1 L2 L3 L4 F1 F2 C 0.2840 0.3180 0.2490 0.2580 0.3670 0.2020 Si 0.1700 0.2460 0.2550 0.2710 0.2940 0.1800 Mn 0.4850 0.8800 0.8500 0.8600 0.7500 0.7000 P 0.0580 0.0520 0.0500 0.0420 0.0600 0.0500 S 0.0540 0.0520 0.0540 0.0520 0.0410 0.0410 Cr 0.2060 0.1810 0.1920 0.1930 0.1510 0.2030 Ni 0.0990 0.1140 0.1270 0.1270 0.0760 0.1080 Mo 0.0140 0.0220 0.0360 0.0320 0.0150 0.0110 Al <0.0001 0.0005 <0.0001 <0.0001 0.0012 <0.0001 Cu 0.2090 0.2150 0.2090 0.2090 0.2010 0.3980 Co 0.0062 0.0120 0.0090 0.0093 0.0064 0.0089 Ti 0.0007 0.0008 0.0006 0.0005 0.0008 0.0009 Nb 0.0073 0.0077 0.0081 0.0074 0.0086 0.0074 V 0.0041 0.0023 0.0017 0.0019 0.0051 0.0012 W <0.0001 0.0014 <0.0001 <0.0001 0.0130 <0.0001 Pb <0.0001 <0.0001 <0.0001 <0.0001 0.0040 <0.0001 B 0.0053 0.0021 0.0011 0.0017 0.0024 0.0013 Sn 0.0190 0.0120 0.0120 0.0130 0.0097 0.0120 Zn 0.0020 0.0044 0.0034 0.0032 0.0039 0.0032 As <0.0001 <0.0001 <0.0001 <0.0001 0.0010 0.0010 Bi 0.0010 0.0009 0.0011 0.0010 0.0009 0.0009 Ca 0.0012 0.0013 0.0008 0.0010 0.0015 0.0007 Ce 0.0025 0.0034 0.0035 0.0027 0.0033 0.0032 Zr 0.0010 0.0016 0.0012 0.0018 0.0018 0.0014 La <0.0001 <0.0001 0.0001 <0.0001 <0.0001 0.0002 Fe 98.4 97.9 97.9 97.9 98.0 98.1 Ceq 0.430187 0.52766 0.459007 0.469113 0.544687 0.39544 Copper and Tin are tramp element in steel which influences the mechanical properties of steel, Luben et al. (2003) suggested maximum tolerance content of 0.4% and 0.06% for Cu and Sn respectively. From the table, all the steel specimens possess copper and tin in quantities within the tolerable limit. The variations of the strain hardening factor are computed in terms of carbon, copper and the carbon equivalent values, according to Oelman et al. (1983) is expressed as: These values are presented in Figure 5. From the result, only samples L2 and F2 with can be characterized as non weldable, while others are weldable steel ( . By being weldable means that it can be welded into structural steel (ANSI/AWS D1.1: 2006). Thus L2 and F2 are not suitable for use as structural steel.
- 7. Civil and Environmental Research www.iiste.org ISSN 2224-5790 (Paper) ISSN 2225-0514 (Online) Vol.3, No.9, 2013 32 Figure 5: Variations in the concentrations of strain hardening factor parameter (C, Cu, Ceq) 3.4 Flexural Properties The parameters investigated under flexural properties are: crack pattern, failure loads, deflection and moments. 3.4.1 Crack and Failure pattern All the beam specimens, irrespective of the type of steel, displayed similar crack and failure pattern. A typical crack and failure pattern, produced by all the different steel is shown in Figure 6. The crack began at the support as diagonal crack, and gradually propagated towards the direction of the applied load. It began as a tiny crack, but progressively widened as the load was increased until failure, which is by crushing of the concrete at the support as shown (Figure 6c). This type of failure is known as shear failure (Arya, 2004). The immediate implication of this is that all the reinforcement will respond similar when used as shear reinforcement.
- 8. Civil and Environmental Research www.iiste.org ISSN 2224-5790 (Paper) ISSN 2225-0514 (Online) Vol.3, No.9, 2013 33 (a) Initial Crack Formation (b) Crack progression (c) At Failure Figure 6: A Typical crack and failure pattern of beam specimens with the steel 3.4.2 Failure Loads and Deflection The load-deflection curve for beam specimens containing the six types of steel bars is shown in Figure 7. Although they all showed similar behavior pattern before failure, which is linear, the beam specimens having steel labeled F1 and F2, showed better load-deflection characteristics. These two steel specimens produced lower deflection and higher failure loads in beams tested, than all other steel specimens. This can be seen in Table (3), for both experimental and theoretical failure loads. Also for all the beam specimens irrespective of the type of steel, the experimental failure loads were higher than the theoretical. But the theoretical deflections were however higher than the experimental deflection for all the beam specimens.
- 9. Civil and Environmental Research www.iiste.org ISSN 2224-5790 (Paper) ISSN 2225-0514 (Online) Vol.3, No.9, 2013 34 Figure 7: The Load-Deflection behavior of the Steel specimens This is expected because of errors arising from specimens’ preparations and instrumentations and in laboratory works, which has the effect of overestimating the failure loads but underestimate the mid-span deflections in beams specimens tested. Table 3: Failure Loads and Deflection Failure Load (KN) Deflection (mm) Experimental (PEX) Theoretical (PT) Experimental (δe) Theoretical (δt) F1 145.00 131.9168 1.20 1.29 1.099178 0.93023256 F2 145.03 125.6772 1.07 1.29 1.153988 0.82945736 L1 131.22 98.93805 1.06 1.17 1.326284 0.90598291 L2 131.22 102.2105 1.06 1.17 1.283821 0.90598291 L3 138.13 124.4888 1.32 1.23 1.109578 1.07317073 L4 117.19 110.5251 0.90 1.04 1.060302 0.86538462 3.4.3 Flexural Moments The experimental moment from the third-point loading configuration and the theoretical moments from the standard (BS 8110: 1997) are presented in Table (4). The theoretical moment, using the standard equation and taking the lever arm z to be 0.775d, is given by: (2) Where M = moments, fy = strength of reinforcement, As = area of reinforcement, and d = effective depth of the concrete section. The theoretical moments were calculated in line with Steel Designer’s Manual (1983) by the expression M = 0.167Pl (3) Where M = moment, P = the design load, and l = the beam span It can be seen from the table that the steel produced the same effect in beam specimens when tested, in the sense that experimental moments for all the beam specimens were found to be higher than the theoretical moments.
- 10. Civil and Environmental Research www.iiste.org ISSN 2224-5790 (Paper) ISSN 2225-0514 (Online) Vol.3, No.9, 2013 35 Table 4: Comparison between the Experimental and Theoretical Moments of the Beam Specimens Failure Moments (KNm) Experimental (MEX) Theoretical (MT) F1 33.35 30.34 1.10 F2 33.36 28.91 1.15 L1 30.18 22.76 1.33 L2 30.18 23.51 1.28 L3 31.77 29.63 1.07 L4 26.95 25.42 1.06 This can be further observed the ratio between the experimental and theoretical moments. These ratios were lower for foreign-sourced reinforcement when compared to the locally source ones. These might mean that the foreign based went through a better quality control than the locally produced ones. 4.0 Conclusions From the results of this investigation, the following conclusions are made. 1) All the steel met the requirements for use as mild steel. But for use as high steel, all the external source met the requirement, but did not meet the minimum requirements of elongation. 2) None of the steel tested fully complied with the chemical and metallurgical standard in terms of carbon content and carbon equivalent value 3) Load-deflection characteristics of foreign-sourced specimens were found to be superior to the locally- sourced ones. ll the reinforcement produced the same failure pattern of shear failure in beams tested. 4) The experimental moments were higher than theoretical moments, but beams specimens with foreign- based steels have lower ratio of experimental to theoretical moments References ANSI/AWS D1.1 (2006), Structural Welding Code American Welding Society. Arya, C. (2004). Design of Structural Elements. Spon Press, 2nd Edition. London. BS 12 (1996). Specification for Portland cement. British Standard Institution, London. BS 8110 (1997) Structural Use of Concrete – Part I: Code of Practice for Design and Construction. British Standard Institution, London. BS 4449 (1997) Carbon Steel Bars for the Reinforcement of Concrete. British Standard Institutions, London. Calvert, J. B. (2001). Building Collapse, why the World Trade Center towers fell so rapidly Engineering and Technology, Civil and Structural September 2001. Ejeh, S. P. and Jibrin, M. U. (2012) Tensile Tests on Reinforcing Steel Bars in the Nigerian Construction Industry. IOSR Journal of Mechanical and Civil Engineering Volume 4, Issue 2, pp. 06-12. Kankam C. K. and Adom-Asamoah, M (2002) Strength and Ductility Characteristics of Reinforcing Steel Bars Milled from Scrap Metals. Materials and Design, Vol. 23, pp. 537–545 Kumalasari, W. and Fabian C. H. (2003). Study of Recent Building Failures in United States. Journal of Performance of Constructed Facilities ASCE .Volume 17, Issue 3, August 2003, 144–150. Luben S, Elena V, Dieter J (2003).Copper and Tin in Steel Scrap Recycling Materials and Geoenvironment, Vol. 50-3, pp. 627 –640. Odusote, J. K. and Adeleke, A. A. (2012) Analysis of properties of Reinforcing Steel Bars: Case Study of Collapsed Building in Lagos Nigeria. Applied Mechanics and Materials, Vol. 204-208, pp. 3052 – 3056. Oelmann, L.A. et al, (1983). The Structure, Properties and Heat Treatment of Metals Pitman Books, Great Britain, pp. 54-57. Opara, P .N (2007). Building Failures and Collapses: A Case Study of Port Harcourt, Nigeria Journal of Technology and Education in Nigeria Vol. 12 (1) 2007: pp. 35-39. Steel Designer’s Manual (1983). Constructional Steel Research and Development Organization. The English Language Book Society and Granada Publishing, London.
- 11. This academic article was published by The International Institute for Science, Technology and Education (IISTE). The IISTE is a pioneer in the Open Access Publishing service based in the U.S. and Europe. The aim of the institute is Accelerating Global Knowledge Sharing. More information about the publisher can be found in the IISTE’s homepage: http://www.iiste.org CALL FOR JOURNAL PAPERS The IISTE is currently hosting more than 30 peer-reviewed academic journals and collaborating with academic institutions around the world. There’s no deadline for submission. Prospective authors of IISTE journals can find the submission instruction on the following page: http://www.iiste.org/journals/ The IISTE editorial team promises to the review and publish all the qualified submissions in a fast manner. All the journals articles are available online to the readers all over the world without financial, legal, or technical barriers other than those inseparable from gaining access to the internet itself. Printed version of the journals is also available upon request of readers and authors. MORE RESOURCES Book publication information: http://www.iiste.org/book/ Recent conferences: http://www.iiste.org/conference/ IISTE Knowledge Sharing Partners EBSCO, Index Copernicus, Ulrich's Periodicals Directory, JournalTOCS, PKP Open Archives Harvester, Bielefeld Academic Search Engine, Elektronische Zeitschriftenbibliothek EZB, Open J-Gate, OCLC WorldCat, Universe Digtial Library , NewJour, Google Scholar