1. IMD WORLD COMPETITIVENESS YEARBOOK 2013IMD WORLD COMPETITIVENESS YEARBOOK 2013
2004
2006
2013
2009
2010
2006
2011
2001
1997
2010
2011
2006
2013
2013
2012
1998
2005
2004
2013
2008
2009
2012
2013
2003
2007
2007
2013
2011
2011
2012
2013
2013
2013
2013
2013
2012
2013
2013
2010
2002
2013
2010
1999
2001
1998
2011
2001
2007
2002
2012
2013
2000
2010
2013
2013
2013
2013
2013
2013
2002
2003
2011
2011
2013
2013
1997
2013
2013
2000
2000
2003
1997
2006
2007
2007
2011
2004
2013
1999
2008
2007
2010
1997
2006
2012
2013
2006
1999
1997
2009
2008
2003
2001
2009
1999
2008
2012
2003
1997
2013
2010
2005
2006
2009
2004
2010
2007
2005
2008
2004
1999
2005
1999
1999
2008
19972002
2007 2010
2013
W or l d C o m p e t i t i v en e s s i n
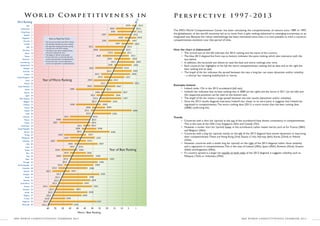
The IMD’s World Competitiveness Center has been calculating the competitiveness of nations since 1989. In 1997,
the globalization of the world’s economy led us to move from a split ranking (advanced vs. emerging economies) to an
integrated one. Because the robust methodology has been maintained since then, it is now possible to track a country’s
competitiveness evolution over that period of time.
How the chart is elaborated?
• The vertical axis on the left indicates the 2013 ranking and the name of the country.
• The blue 2013 diagonal line from top to bottom indicates the same ranking, which also intersects with the
axis below.
• In addition, the horizontal axis allows to read the best and worst rankings over time.
• Each country’s bar highlights on the left the worst competitiveness ranking and its date and on the right the
best ranking and its date.
• The length of the bar indicates the spread between the two; a long bar can mean dynamism and/or volatility
– a shorter bar meaning stability/and or inertia.
Example: Ireland
• Ireland ranks 17th in the 2013 scoreboard (left axis).
• Ireland’s bar indicates that its best ranking was in 2000 (on the right) and the worst in 2011 (on the left) and
the respective positions can be read on the bottom axis.
• The length of the bar means a large spread between the two results (dynamism and/or volatility).
• Since the 2013 results diagonal intersects Ireland’s bar closer to its worst point, it suggests that Ireland has
regressed in competitiveness.The worst ranking date (2011) is more recent than the best ranking date
(2000) confirming this.
Trends
• Countries with a short bar (spread) at the top of the scoreboard have shown consistency in competitiveness.
This is the case of the USA (1st), Singapore (5th) and Canada (7th).
• However a similar short bar (spread) lower in the scoreboard, rather means inertia, such as for France (28th)
and Belgium (26th).
• Countries with a long bar (spread) mainly on the left of the 2013 diagonal have shown dynamism in improving
their competitiveness.These are Hong Kong (3rd),Taiwan (11th), Norway (6th), Korea (22nd) or Poland
(33th).
• However countries with a similar long bar (spread) on the right of the 2013 diagonal rather show volatility
and a regression in competitiveness.This is the case of Iceland (29th), Spain (45th), Slovenia (52nd), Greece
(54th) and Argentina (59th).
• If a country spread is a longer bar equally on both sides of the 2013 diagonal, it suggests volatility, such as
Malaysia (15th) or Indonesia (39th).
P ersp e c t i v e 1 9 9 7 - 2 0 1 3
USA 1
Switzerland 2
Hong Kong 3
Sweden 4
Singapore 5
Norway 6
Canada 7
UAE 8
Germany 9
Qatar 10
Taiwan 11
Denmark 12
Luxembourg 13
Netherlands 14
Malaysia 15
Australia 16
Ireland 17
United Kingdom 18
Israel 19
Finland 20
China Mainland 21
Korea 22
Austria 23
Japan 24
New Zealand 25
Belgium 26
Thailand 27
France 28
Iceland 29
Chile 30
Lithuania 31
Mexico 32
Poland 33
Kazakhstan 34
Czech Republic 35
Estonia 36
Turkey 37
Philippines 38
Indonesia 39
India 40
Latvia 41
Russia 42
Peru 43
Italy 44
Spain 45
Portugal 46
Slovak Republic 47
Colombia 48
Ukraine 49
Hungary 50
Brazil 51
Slovenia 52
South Africa 53
Greece 54
Romania 55
Jordan 56
Bulgaria 57
Croatia 59
Argentina 59
Venezuela 60
60 55 50 45 40 45 30 25 20 15 10 5 1
2013 Ranking
Year of Best Ranking
Year of Worst Ranking
2013
How to Read the Chart
• The vertical axis (left) is the 2013 ranking
• The left date indicates the worst ranking
• The right date indicated the best ranking
• The blue line is the 2013 ranking
• The bottom axis allows reading the best
and worst ranking over time
• The length of the bar is the spread
• If most of the bar is on the left then the
country has improved in competitiveness
• If most of the bar is on the right, then a
country has regressed in competititveness
Worst / Best Ranking