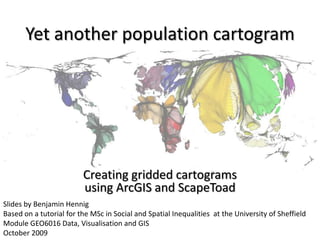
Creating gridded cartograms using ArcGIS and ScapeToad
•
5 gefällt mir•3,532 views

Slides by Benjamin Hennig, Based on a tutorial for the MSc in Social and Spatial Inequalities at the University of Sheffield, Module GEO6016 Data, Visualisation and GIS, October 2009

Empfohlen
Empfohlen
Weitere ähnliche Inhalte
Was ist angesagt?
Was ist angesagt? (20)
Ähnlich wie Creating gridded cartograms using ArcGIS and ScapeToad
Ähnlich wie Creating gridded cartograms using ArcGIS and ScapeToad (20)
Mehr von Benjamin Hennig
Mehr von Benjamin Hennig (20)
Kürzlich hochgeladen
Kürzlich hochgeladen (20)
Creating gridded cartograms using ArcGIS and ScapeToad
- 1. Yet another population cartogram Creating gridded cartograms using ArcGIS and ScapeToad Slides by Benjamin Hennig Based on a tutorial for the MSc in Social and Spatial Inequalities at the University of Sheffield Module GEO6016 Data, Visualisation and GIS October 2009
- 2. Data • Population – Gridded Population of the World (GPWv3, http://sedac.ciesin.columbia.edu/gpw/) • Country Shapes – ESRI Sample Data or – Global Administrative Boundaries (http://gadm.org/)
- 3. GIS works I • Preparing the grid: Creating a 1° fishnet ArcToolbox: Data Management Tools Feature Class Create Fishnet
- 4. GIS works I • Preparing the grid: Creating a 1° fishnet ArcToolbox: Data Management Tools Feature Class Create Fishnet
- 5. GIS works II Intermediate steps: • Coverting grid to polygons (ArcToolbox Data Management Tools Features Feature to Polygon) • Adding basedata: – population raster (gpw_1deg.bil) – country shapes (countries2007.shp)
- 6. GIS works IV • Converting the population raster: ArcToolbox: Conversion Tools From Raster Raster to Point
- 7. GIS works IV • Converting the population raster: ArcToolbox: Conversion Tools From Raster Raster to Point
- 8. GIS works V • Assigning population values to grid: ArcToolbox: Analysis Tools Overlay Spatial Join
- 9. GIS works V • Assigning population values to grid: ArcToolbox: Analysis Tools Overlay Spatial Join
- 10. GIS works VI • Cutting out the continents: ArcToolbox: Analysis Tools Overlay Intersect
- 11. GIS works VI • Cutting out the continents: ArcToolbox: Analysis Tools Overlay Intersect