SlideShare a Scribd company logo
1 of 8
Download to read offline
Setting KPIs Level
For measuring Airports
Performance
Life is a continues
learning course
Dears,
One of the key success factoris to have a targets,
Target that the airport authority try to achieve them.
One of these, is traffic flow,
Yes it is hard to predict them, but we can move towards to achieved them by
using excel spreadsheet.
Setting targets for airports can be set for
1- Traffic Passengers
2- Number of Flights
3- Air Cargo Flow
Moreover, KPIs level can be define by the difference between the forecasted
figures and the achievable numbers. According to the following Performance
Scale.
GoodCase Studies
Let the Figures Talk – Issues No. 1 to No. 7
Hope to enjoy
Mohammed Salem Awad
By: Mohammed Salem Awad
Aviation Consultant
22
Let the Figures Talk – Issue No. 1
Defining Airport Performance in 2018
Case Study: Heathrow Airport
Let the Figures Talk:
This issue is addressing the answer, for the question, why we are forecast the traffic of the
Airports. The forecasting analysis is FAIR, when R-square is greater than 90 %, and
consequently the forecasted figures are set as TARGETS to be achieved.
Errors: are the deviations between the
Historical Data with Model Fitted, always
addressing by a range percentage.
Performance: are the deviations between the
target figures and the actual figures for the
proposed target period (2018).
Results above targets are good performance
and represented by a green color, and results
below targets are poor one, represents by red
color. However, airports should set up the
right target level to define KPIs system. i.e
less than (- 10.0 % ) should consider as a poor
one.
Case Study: Heathrow Airport
By referring to issue no. 29 Heathrow
Airport,
R- Squared (monthly model) = 98.01 %
Errors range: + 4.73 % - 3.82 %
Analysis:
The figures of seven months for LHR shows an
excellent performance, keeping in mind the red color indicates below the targets level (very minor
percentage),while the green one is good performance. The performance range – 0.57 % to +2.22 %
33
Let the Figures Talk – Issue No. 2
Defining Airport Performance in 2018
Case Study: Dublin Airport
Let the Figures Talk:
Each Airport Forecasting can be review, The
forecasting analysis is FAIR, when R-square is
greater than 90 %, and consequently the
forecasted figures are set as TARGETS to be
achieved.
Errors: are the deviations between the
Historical Data with Model Fitted, always
addressing by a range percentage.
Performance: are the deviations between the
target figures and the actual figures for the
proposed target period (2018).
Results above targets are good performance
and represented by a green color, and results
below targets are poor one, represents by red
color. However, airports should set up the right
target level to define KPIs system. i.e less than
(- 10.0 % ) should consider as a poor one.
Case Study: Dublin Airport
By referring to issue no. 30 Dublin Airport,
R- Squared (monthly model) = 99.00 %
Growth: 7.81 %
Errors range: + 7.43 % - 4.26 %
Analysis:
The figures of six months for DUB shows an Good performance,keeping in mind the red color
indicates below the targets level (only two readings make a significant impact -4.63% & -5.21 % ),
while the green one is good performance. The performance range – 5.21 % to +1.13 %.
44
Let the Figures Talk – Issue No. 3
Defining Airport Performance in 2018
Case Study: ATHENS Int. Airport
Let the Figures Talk:
Each Airport Forecasting for 2018 can be
reviewed, the forecasting analysis is FAIR,
when R-square is greater than 90 %, and
consequently the forecasted figures are set as
TARGETS to be achieved.
Errors: are the deviations between the
Historical Data with Model Fitted, always
addressing by a range percentage.
Performance: are the deviations between the
target figures and the actual figures for the
proposed target period (2018).
Results above targets are good performance
and represented by a green color, and results
below targets level are poor one, represents
by red color. However, airports should set up
the right target level to define KPIs system.
i.e less than (- 10.0 % ) should consider as a
poor one.
Case Study: Athens Int. Airport
By referring to issue no. 32 Athens Airport, R- Squared (monthly model) = 99.12 %
Annual Growth = 8.48 % Errors range: + 6.75 % - 8.08 %
Analysis:
The actual data of eight months of 2018 for ATH shows an excellent performance, keeping
in mind the red color indicates below the targets level (very minor percentage), while the
green one is good performance. The performance range – 3.34 % to +7.03 %
55
Let the Figures Talk – Issue No. 4
Defining Airport Performance in 2018
Case Study: CagliariInt. Airport
Let the Figures Talk:
Each Airport Forecasting for 2018 can be
reviewed, the forecasting analysis is FAIR,
when R-square is greater than 90 %, and
consequently the forecasted figures are set as
TARGETS to be achieved.
Errors: are the deviations between the
Historical Data with Model Fitted, always
addressing by a percentage range.
Performance: are the deviations between the
target figures and the actual figures for the
proposed target period (2018).
Results above targets are good performance
and represented by a green color, and results
below targets level are poor one, represents by
red color. However, airports should set up
their own right target levels to define KPIs
system. i.e less than (- 5.0 % ) should
consider as a poor one.
Case Study: Cagliari Int. Airport
By referring to issue no. 98 Cagliari Int.
Airport, R- Squared (monthly model) = 98.67 %
Annual Growth = 5.95 %
Errors range: + 8.39 % - 4.46 %
Analysis:
The actual data of eight months of 2018 for CAG shows an excellent performance, keeping
in mind the red color indicates below the targets level (but greater than – 5.0 %), while the
green one is good performance. The performance range – 3.72 % to +1.68 %
66
Let the Figures Talk – Issue No. 5
Defining Airport Performance in 2018
Case Study:
Schiphol Amsterdam Airport
Let the Figures Talk:
Each Airport Forecasting for 2018 can be
reviewed, the forecasting analysis is FAIR,
when R-square is greater than 90 %, and
consequently the forecasted figures are set
as TARGETS to be achieved.
Errors: are the deviations between the
Historical Data with Model Fitted, always
addressing by a percentage range.
Performance: are the deviations between
the target figures and the actual figures for
the proposed target period (2018).
Results above targets are good performance
and represented by a green color, and results
below targets level are poor one, represents
by red color. However, airports should set
up their own right target levels to define
KPIs system. i.e less than (- 5.0 % ) should
consider as a poor one.
Case Study: Amsterdam Airport
By referring to issue no. 39 Schiphol Amsterdam
Airport, R- Squared (monthly model) = 99.03 %
Annual Growth = 8.27 %
Errors range: + 4.23 % - 2.72 %
Analysis:
The actual data of Seven months of 2018 for AMS shows a the performance of the airport, at
-5 % threshold level, keeping in mind the red color indicates below the targets level (but
greater than – 5.0 %), while the green one is good performance. The performance range
– 9.28 % to +1.15 %. Should we review the threshod level to -10 % !!!, it depends on the
airport policy and top management decision to review & setup these targets level.
77
Let the Figures Talk – Issue No. 6
Defining Airport Performance in 2018
Case Study:
Aéroportsde Montréal (Int. Pax)
Let the Figures Talk:
Each Airport Forecasting for 2018 can be
reviewed, the forecasting analysis is FAIR,
when R-square is greater than 90 %, and
consequently the forecasted figures are set as
TARGETS to be achieved.
Errors: are the deviations between the
Historical Data with Model Fitted, always
addressing by a percentage range.
Performance: are the deviations between
the target figures and the actual figures for
the proposed target period (2018).
Results above targets are good performance
and represented by a green color, and results
below targets level are poor one, represents
by red color. However, airports should set
up their own right target levels to define
KPIs system. i.e less than (- 5.0 % ) should
consider as a poor one.
Case Study: Montreal Airport- Int. Pax
By referring to issue no. 68 Montreal Airport,
R- Squared (monthly model) = 98.01 % Annual
Growth = 10.01 %, Errors range: + 8.25 % - 6.41 %
Analysis:
The actual data of eight months of 2018 for YUL shows the performance of the airport, at
-5 % threshold level, keeping in mind the red color indicates below the targets level (but
greater than – 5.0 %), while the green one is good performance. The performance range :
– 6.70 % to +4.97 %.
88
Let the Figures Talk – Issue No. 7
Defining Airport Performance in 2018
Case Study:
MiamiInternationalAirport
Let the Figures Talk:
Each Airport Forecasting for 2018 can be
reviewed, the forecasting analysis is FAIR,
when R-square is greater than 90 %, and
consequently the forecasted figures are set
as TARGETS to be achieved.
Errors: are the deviations between the
Historical Data with Model Fitted, always
addressing by a percentage range.
Performance: are the deviations between
the target figures and the actual figures for
the proposed target period (2018).
Results above targets are good performance
and represented by a green color, and
results below targets level are poor one,
represents by red color. However, airports
should set up their own right target levels
to define KPIs system. i.e less than (- 5.0 %
) should consider as a poor one.
Case Study: MIA Int. Airport
By referring to issue no. 75 Miami Int. Airport,
R- Squared (monthly model) = 81.60 % Annual
Growth = 00.00 %, Errors range: + 3.45 % - 4.49 %
Analysis:
The actual data of seven months of 2018 for MIA shows the performance of the airport, at
-5 % threshold level, keeping in mind the red color indicates below the targets level (but
greater than – 5.0 %), while the green one is good performance. The performance range :
– 1.73 % to + 3.96 %.

More Related Content

Similar to Let the figures talk 1 7 w int1

Predicting 2016 Airlines Performance
Predicting 2016   Airlines Performance Predicting 2016   Airlines Performance
Predicting 2016 Airlines Performance Mohammed Awad
 
Cama Aviation Articles
Cama Aviation ArticlesCama Aviation Articles
Cama Aviation ArticlesMohammed Hadi
 
Route Performance : YUL - CDG
Route Performance : YUL - CDGRoute Performance : YUL - CDG
Route Performance : YUL - CDGMohammed Awad
 
Predicting Air Transport Industry - 2018
Predicting Air Transport Industry  - 2018 Predicting Air Transport Industry  - 2018
Predicting Air Transport Industry - 2018 Mohammed Awad
 
Aviation articles - Aircraft Evaluation and selection
Aviation articles - Aircraft Evaluation and selectionAviation articles - Aircraft Evaluation and selection
Aviation articles - Aircraft Evaluation and selectionMohammed Hadi
 
Route Performance VNO - FRA
Route Performance VNO - FRA Route Performance VNO - FRA
Route Performance VNO - FRA Mohammed Awad
 
Major airport air cargo forecasting
Major airport air cargo forecastingMajor airport air cargo forecasting
Major airport air cargo forecastingMohammed Awad
 
Keeping the same rules 2
Keeping the same rules 2Keeping the same rules 2
Keeping the same rules 2Mohammed Hadi
 
Reading in the future Case Study : IAG
Reading in the future   Case Study : IAGReading in the future   Case Study : IAG
Reading in the future Case Study : IAGMohammed Hadi
 
Forecasting - MENA 2012 Conference
Forecasting - MENA 2012 ConferenceForecasting - MENA 2012 Conference
Forecasting - MENA 2012 ConferenceMohammed Hadi
 
Advanced Pricing in General Insurance
Advanced Pricing in General InsuranceAdvanced Pricing in General Insurance
Advanced Pricing in General InsuranceSyed Danish Ali
 
WELCOMEFinancial Projections ModelFor Business PlansFran.docx
WELCOMEFinancial Projections ModelFor Business PlansFran.docxWELCOMEFinancial Projections ModelFor Business PlansFran.docx
WELCOMEFinancial Projections ModelFor Business PlansFran.docxalanfhall8953
 
WELCOMEFinancial Projections ModelFor Business PlansFran.docx
WELCOMEFinancial Projections ModelFor Business PlansFran.docxWELCOMEFinancial Projections ModelFor Business PlansFran.docx
WELCOMEFinancial Projections ModelFor Business PlansFran.docxphilipnelson29183
 
Asset enlargement certification part 2
Asset enlargement certification part 2Asset enlargement certification part 2
Asset enlargement certification part 2Aleksandr Shepelev
 
Aviation Article : Getting The Right Picture
Aviation Article  : Getting The Right PictureAviation Article  : Getting The Right Picture
Aviation Article : Getting The Right PictureMohammed Hadi
 
Tolerance range in transfer pricing
Tolerance range in transfer pricingTolerance range in transfer pricing
Tolerance range in transfer pricingDVSResearchFoundatio
 
Reading in the future2
Reading in the future2Reading in the future2
Reading in the future2Mohammed Awad
 
ASI 07 - How Auditing Radio campaigns helps Improve Planning and Buying Effic...
ASI 07 - How Auditing Radio campaigns helps Improve Planning and Buying Effic...ASI 07 - How Auditing Radio campaigns helps Improve Planning and Buying Effic...
ASI 07 - How Auditing Radio campaigns helps Improve Planning and Buying Effic...Paola Furlanetto
 
ASI 2007 European Radio Symposium - Furlanetto - How auditing radio campaigns...
ASI 2007 European Radio Symposium - Furlanetto - How auditing radio campaigns...ASI 2007 European Radio Symposium - Furlanetto - How auditing radio campaigns...
ASI 2007 European Radio Symposium - Furlanetto - How auditing radio campaigns...A+
 
Reading in the future Turkish Air
Reading in the future    Turkish AirReading in the future    Turkish Air
Reading in the future Turkish AirMohammed Hadi
 

Similar to Let the figures talk 1 7 w int1 (20)

Predicting 2016 Airlines Performance
Predicting 2016   Airlines Performance Predicting 2016   Airlines Performance
Predicting 2016 Airlines Performance
 
Cama Aviation Articles
Cama Aviation ArticlesCama Aviation Articles
Cama Aviation Articles
 
Route Performance : YUL - CDG
Route Performance : YUL - CDGRoute Performance : YUL - CDG
Route Performance : YUL - CDG
 
Predicting Air Transport Industry - 2018
Predicting Air Transport Industry  - 2018 Predicting Air Transport Industry  - 2018
Predicting Air Transport Industry - 2018
 
Aviation articles - Aircraft Evaluation and selection
Aviation articles - Aircraft Evaluation and selectionAviation articles - Aircraft Evaluation and selection
Aviation articles - Aircraft Evaluation and selection
 
Route Performance VNO - FRA
Route Performance VNO - FRA Route Performance VNO - FRA
Route Performance VNO - FRA
 
Major airport air cargo forecasting
Major airport air cargo forecastingMajor airport air cargo forecasting
Major airport air cargo forecasting
 
Keeping the same rules 2
Keeping the same rules 2Keeping the same rules 2
Keeping the same rules 2
 
Reading in the future Case Study : IAG
Reading in the future   Case Study : IAGReading in the future   Case Study : IAG
Reading in the future Case Study : IAG
 
Forecasting - MENA 2012 Conference
Forecasting - MENA 2012 ConferenceForecasting - MENA 2012 Conference
Forecasting - MENA 2012 Conference
 
Advanced Pricing in General Insurance
Advanced Pricing in General InsuranceAdvanced Pricing in General Insurance
Advanced Pricing in General Insurance
 
WELCOMEFinancial Projections ModelFor Business PlansFran.docx
WELCOMEFinancial Projections ModelFor Business PlansFran.docxWELCOMEFinancial Projections ModelFor Business PlansFran.docx
WELCOMEFinancial Projections ModelFor Business PlansFran.docx
 
WELCOMEFinancial Projections ModelFor Business PlansFran.docx
WELCOMEFinancial Projections ModelFor Business PlansFran.docxWELCOMEFinancial Projections ModelFor Business PlansFran.docx
WELCOMEFinancial Projections ModelFor Business PlansFran.docx
 
Asset enlargement certification part 2
Asset enlargement certification part 2Asset enlargement certification part 2
Asset enlargement certification part 2
 
Aviation Article : Getting The Right Picture
Aviation Article  : Getting The Right PictureAviation Article  : Getting The Right Picture
Aviation Article : Getting The Right Picture
 
Tolerance range in transfer pricing
Tolerance range in transfer pricingTolerance range in transfer pricing
Tolerance range in transfer pricing
 
Reading in the future2
Reading in the future2Reading in the future2
Reading in the future2
 
ASI 07 - How Auditing Radio campaigns helps Improve Planning and Buying Effic...
ASI 07 - How Auditing Radio campaigns helps Improve Planning and Buying Effic...ASI 07 - How Auditing Radio campaigns helps Improve Planning and Buying Effic...
ASI 07 - How Auditing Radio campaigns helps Improve Planning and Buying Effic...
 
ASI 2007 European Radio Symposium - Furlanetto - How auditing radio campaigns...
ASI 2007 European Radio Symposium - Furlanetto - How auditing radio campaigns...ASI 2007 European Radio Symposium - Furlanetto - How auditing radio campaigns...
ASI 2007 European Radio Symposium - Furlanetto - How auditing radio campaigns...
 
Reading in the future Turkish Air
Reading in the future    Turkish AirReading in the future    Turkish Air
Reading in the future Turkish Air
 

More from Mohammed Awad

Air Cargo Forecast 2023 for Aviation Industry
Air Cargo Forecast 2023 for Aviation IndustryAir Cargo Forecast 2023 for Aviation Industry
Air Cargo Forecast 2023 for Aviation IndustryMohammed Awad
 
BCG Matrix Analysis for Airlines for period Dec 2019
BCG Matrix Analysis for Airlines for period Dec 2019BCG Matrix Analysis for Airlines for period Dec 2019
BCG Matrix Analysis for Airlines for period Dec 2019Mohammed Awad
 
Air Cargo Forecast.pdf
Air Cargo Forecast.pdfAir Cargo Forecast.pdf
Air Cargo Forecast.pdfMohammed Awad
 
Aviation Business Leader - Global Ceo Excellence
Aviation Business Leader - Global Ceo ExcellenceAviation Business Leader - Global Ceo Excellence
Aviation Business Leader - Global Ceo ExcellenceMohammed Awad
 
New destination 4.pdf
New destination 4.pdfNew destination 4.pdf
New destination 4.pdfMohammed Awad
 
Rush Hour Analysis final 12.pdf
Rush Hour Analysis final 12.pdfRush Hour Analysis final 12.pdf
Rush Hour Analysis final 12.pdfMohammed Awad
 
Has Airline Forecasting changed forever?
Has Airline Forecasting changed forever?Has Airline Forecasting changed forever?
Has Airline Forecasting changed forever?Mohammed Awad
 
Back To Norms DXB 2022
Back To Norms DXB 2022 Back To Norms DXB 2022
Back To Norms DXB 2022 Mohammed Awad
 
Solar Presentation 1.pdf
Solar Presentation 1.pdfSolar Presentation 1.pdf
Solar Presentation 1.pdfMohammed Awad
 
JFK AIRPORT 2021-3.pdf
JFK  AIRPORT    2021-3.pdfJFK  AIRPORT    2021-3.pdf
JFK AIRPORT 2021-3.pdfMohammed Awad
 
Fare Mapping Analysis.pdf
Fare Mapping Analysis.pdfFare Mapping Analysis.pdf
Fare Mapping Analysis.pdfMohammed Awad
 
Back To Norms 123 y.pdf
Back To Norms 123 y.pdfBack To Norms 123 y.pdf
Back To Norms 123 y.pdfMohammed Awad
 
Ceo article arabic11
Ceo article arabic11Ceo article arabic11
Ceo article arabic11Mohammed Awad
 
Is Low Cost Carrier Profitable -Ryan article - Issue No. 2
Is Low Cost Carrier Profitable -Ryan article - Issue No. 2Is Low Cost Carrier Profitable -Ryan article - Issue No. 2
Is Low Cost Carrier Profitable -Ryan article - Issue No. 2Mohammed Awad
 
Is Low Cost Carrier Profitable - Norwegian article - Issue No. 1
Is Low Cost Carrier Profitable  - Norwegian article - Issue No. 1Is Low Cost Carrier Profitable  - Norwegian article - Issue No. 1
Is Low Cost Carrier Profitable - Norwegian article - Issue No. 1Mohammed Awad
 
Standout From The Crowds
Standout From The CrowdsStandout From The Crowds
Standout From The CrowdsMohammed Awad
 
All roads lead to rome final
All roads lead to rome finalAll roads lead to rome final
All roads lead to rome finalMohammed Awad
 
Predicting Singapore Tourism Market 2020
Predicting Singapore Tourism Market 2020  Predicting Singapore Tourism Market 2020
Predicting Singapore Tourism Market 2020 Mohammed Awad
 
Predicting air cargo global 2020
Predicting air cargo global 2020Predicting air cargo global 2020
Predicting air cargo global 2020Mohammed Awad
 

More from Mohammed Awad (20)

Air Cargo Forecast 2023 for Aviation Industry
Air Cargo Forecast 2023 for Aviation IndustryAir Cargo Forecast 2023 for Aviation Industry
Air Cargo Forecast 2023 for Aviation Industry
 
BCG Matrix Analysis for Airlines for period Dec 2019
BCG Matrix Analysis for Airlines for period Dec 2019BCG Matrix Analysis for Airlines for period Dec 2019
BCG Matrix Analysis for Airlines for period Dec 2019
 
Air Cargo Forecast.pdf
Air Cargo Forecast.pdfAir Cargo Forecast.pdf
Air Cargo Forecast.pdf
 
Aviation Business Leader - Global Ceo Excellence
Aviation Business Leader - Global Ceo ExcellenceAviation Business Leader - Global Ceo Excellence
Aviation Business Leader - Global Ceo Excellence
 
New destination 4.pdf
New destination 4.pdfNew destination 4.pdf
New destination 4.pdf
 
Rush Hour Analysis final 12.pdf
Rush Hour Analysis final 12.pdfRush Hour Analysis final 12.pdf
Rush Hour Analysis final 12.pdf
 
Has Airline Forecasting changed forever?
Has Airline Forecasting changed forever?Has Airline Forecasting changed forever?
Has Airline Forecasting changed forever?
 
Back To Norms DXB 2022
Back To Norms DXB 2022 Back To Norms DXB 2022
Back To Norms DXB 2022
 
Solar Presentation 1.pdf
Solar Presentation 1.pdfSolar Presentation 1.pdf
Solar Presentation 1.pdf
 
JFK AIRPORT 2021-3.pdf
JFK  AIRPORT    2021-3.pdfJFK  AIRPORT    2021-3.pdf
JFK AIRPORT 2021-3.pdf
 
black swan.pdf
black swan.pdfblack swan.pdf
black swan.pdf
 
Fare Mapping Analysis.pdf
Fare Mapping Analysis.pdfFare Mapping Analysis.pdf
Fare Mapping Analysis.pdf
 
Back To Norms 123 y.pdf
Back To Norms 123 y.pdfBack To Norms 123 y.pdf
Back To Norms 123 y.pdf
 
Ceo article arabic11
Ceo article arabic11Ceo article arabic11
Ceo article arabic11
 
Is Low Cost Carrier Profitable -Ryan article - Issue No. 2
Is Low Cost Carrier Profitable -Ryan article - Issue No. 2Is Low Cost Carrier Profitable -Ryan article - Issue No. 2
Is Low Cost Carrier Profitable -Ryan article - Issue No. 2
 
Is Low Cost Carrier Profitable - Norwegian article - Issue No. 1
Is Low Cost Carrier Profitable  - Norwegian article - Issue No. 1Is Low Cost Carrier Profitable  - Norwegian article - Issue No. 1
Is Low Cost Carrier Profitable - Norwegian article - Issue No. 1
 
Standout From The Crowds
Standout From The CrowdsStandout From The Crowds
Standout From The Crowds
 
All roads lead to rome final
All roads lead to rome finalAll roads lead to rome final
All roads lead to rome final
 
Predicting Singapore Tourism Market 2020
Predicting Singapore Tourism Market 2020  Predicting Singapore Tourism Market 2020
Predicting Singapore Tourism Market 2020
 
Predicting air cargo global 2020
Predicting air cargo global 2020Predicting air cargo global 2020
Predicting air cargo global 2020
 

Recently uploaded

India Consumer 2024 Redacted Sample Report
India Consumer 2024 Redacted Sample ReportIndia Consumer 2024 Redacted Sample Report
India Consumer 2024 Redacted Sample ReportMintel Group
 
Buy gmail accounts.pdf Buy Old Gmail Accounts
Buy gmail accounts.pdf Buy Old Gmail AccountsBuy gmail accounts.pdf Buy Old Gmail Accounts
Buy gmail accounts.pdf Buy Old Gmail AccountsBuy Verified Accounts
 
PSCC - Capability Statement Presentation
PSCC - Capability Statement PresentationPSCC - Capability Statement Presentation
PSCC - Capability Statement PresentationAnamaria Contreras
 
Marketplace and Quality Assurance Presentation - Vincent Chirchir
Marketplace and Quality Assurance Presentation - Vincent ChirchirMarketplace and Quality Assurance Presentation - Vincent Chirchir
Marketplace and Quality Assurance Presentation - Vincent Chirchirictsugar
 
Global Scenario On Sustainable and Resilient Coconut Industry by Dr. Jelfina...
Global Scenario On Sustainable  and Resilient Coconut Industry by Dr. Jelfina...Global Scenario On Sustainable  and Resilient Coconut Industry by Dr. Jelfina...
Global Scenario On Sustainable and Resilient Coconut Industry by Dr. Jelfina...ictsugar
 
APRIL2024_UKRAINE_xml_0000000000000 .pdf
APRIL2024_UKRAINE_xml_0000000000000 .pdfAPRIL2024_UKRAINE_xml_0000000000000 .pdf
APRIL2024_UKRAINE_xml_0000000000000 .pdfRbc Rbcua
 
Call US-88OO1O2216 Call Girls In Mahipalpur Female Escort Service
Call US-88OO1O2216 Call Girls In Mahipalpur Female Escort ServiceCall US-88OO1O2216 Call Girls In Mahipalpur Female Escort Service
Call US-88OO1O2216 Call Girls In Mahipalpur Female Escort Servicecallgirls2057
 
IoT Insurance Observatory: summary 2024
IoT Insurance Observatory:  summary 2024IoT Insurance Observatory:  summary 2024
IoT Insurance Observatory: summary 2024Matteo Carbone
 
Future Of Sample Report 2024 | Redacted Version
Future Of Sample Report 2024 | Redacted VersionFuture Of Sample Report 2024 | Redacted Version
Future Of Sample Report 2024 | Redacted VersionMintel Group
 
(Best) ENJOY Call Girls in Faridabad Ex | 8377087607
(Best) ENJOY Call Girls in Faridabad Ex | 8377087607(Best) ENJOY Call Girls in Faridabad Ex | 8377087607
(Best) ENJOY Call Girls in Faridabad Ex | 8377087607dollysharma2066
 
Ms Motilal Padampat Sugar Mills vs. State of Uttar Pradesh & Ors. - A Milesto...
Ms Motilal Padampat Sugar Mills vs. State of Uttar Pradesh & Ors. - A Milesto...Ms Motilal Padampat Sugar Mills vs. State of Uttar Pradesh & Ors. - A Milesto...
Ms Motilal Padampat Sugar Mills vs. State of Uttar Pradesh & Ors. - A Milesto...ShrutiBose4
 
Market Sizes Sample Report - 2024 Edition
Market Sizes Sample Report - 2024 EditionMarket Sizes Sample Report - 2024 Edition
Market Sizes Sample Report - 2024 EditionMintel Group
 
Flow Your Strategy at Flight Levels Day 2024
Flow Your Strategy at Flight Levels Day 2024Flow Your Strategy at Flight Levels Day 2024
Flow Your Strategy at Flight Levels Day 2024Kirill Klimov
 
8447779800, Low rate Call girls in Tughlakabad Delhi NCR
8447779800, Low rate Call girls in Tughlakabad Delhi NCR8447779800, Low rate Call girls in Tughlakabad Delhi NCR
8447779800, Low rate Call girls in Tughlakabad Delhi NCRashishs7044
 
Cybersecurity Awareness Training Presentation v2024.03
Cybersecurity Awareness Training Presentation v2024.03Cybersecurity Awareness Training Presentation v2024.03
Cybersecurity Awareness Training Presentation v2024.03DallasHaselhorst
 
Annual General Meeting Presentation Slides
Annual General Meeting Presentation SlidesAnnual General Meeting Presentation Slides
Annual General Meeting Presentation SlidesKeppelCorporation
 
MAHA Global and IPR: Do Actions Speak Louder Than Words?
MAHA Global and IPR: Do Actions Speak Louder Than Words?MAHA Global and IPR: Do Actions Speak Louder Than Words?
MAHA Global and IPR: Do Actions Speak Louder Than Words?Olivia Kresic
 
Call Us 📲8800102216📞 Call Girls In DLF City Gurgaon
Call Us 📲8800102216📞 Call Girls In DLF City GurgaonCall Us 📲8800102216📞 Call Girls In DLF City Gurgaon
Call Us 📲8800102216📞 Call Girls In DLF City Gurgaoncallgirls2057
 

Recently uploaded (20)

India Consumer 2024 Redacted Sample Report
India Consumer 2024 Redacted Sample ReportIndia Consumer 2024 Redacted Sample Report
India Consumer 2024 Redacted Sample Report
 
Buy gmail accounts.pdf Buy Old Gmail Accounts
Buy gmail accounts.pdf Buy Old Gmail AccountsBuy gmail accounts.pdf Buy Old Gmail Accounts
Buy gmail accounts.pdf Buy Old Gmail Accounts
 
PSCC - Capability Statement Presentation
PSCC - Capability Statement PresentationPSCC - Capability Statement Presentation
PSCC - Capability Statement Presentation
 
Marketplace and Quality Assurance Presentation - Vincent Chirchir
Marketplace and Quality Assurance Presentation - Vincent ChirchirMarketplace and Quality Assurance Presentation - Vincent Chirchir
Marketplace and Quality Assurance Presentation - Vincent Chirchir
 
Corporate Profile 47Billion Information Technology
Corporate Profile 47Billion Information TechnologyCorporate Profile 47Billion Information Technology
Corporate Profile 47Billion Information Technology
 
Global Scenario On Sustainable and Resilient Coconut Industry by Dr. Jelfina...
Global Scenario On Sustainable  and Resilient Coconut Industry by Dr. Jelfina...Global Scenario On Sustainable  and Resilient Coconut Industry by Dr. Jelfina...
Global Scenario On Sustainable and Resilient Coconut Industry by Dr. Jelfina...
 
Enjoy ➥8448380779▻ Call Girls In Sector 18 Noida Escorts Delhi NCR
Enjoy ➥8448380779▻ Call Girls In Sector 18 Noida Escorts Delhi NCREnjoy ➥8448380779▻ Call Girls In Sector 18 Noida Escorts Delhi NCR
Enjoy ➥8448380779▻ Call Girls In Sector 18 Noida Escorts Delhi NCR
 
APRIL2024_UKRAINE_xml_0000000000000 .pdf
APRIL2024_UKRAINE_xml_0000000000000 .pdfAPRIL2024_UKRAINE_xml_0000000000000 .pdf
APRIL2024_UKRAINE_xml_0000000000000 .pdf
 
Call US-88OO1O2216 Call Girls In Mahipalpur Female Escort Service
Call US-88OO1O2216 Call Girls In Mahipalpur Female Escort ServiceCall US-88OO1O2216 Call Girls In Mahipalpur Female Escort Service
Call US-88OO1O2216 Call Girls In Mahipalpur Female Escort Service
 
IoT Insurance Observatory: summary 2024
IoT Insurance Observatory:  summary 2024IoT Insurance Observatory:  summary 2024
IoT Insurance Observatory: summary 2024
 
Future Of Sample Report 2024 | Redacted Version
Future Of Sample Report 2024 | Redacted VersionFuture Of Sample Report 2024 | Redacted Version
Future Of Sample Report 2024 | Redacted Version
 
(Best) ENJOY Call Girls in Faridabad Ex | 8377087607
(Best) ENJOY Call Girls in Faridabad Ex | 8377087607(Best) ENJOY Call Girls in Faridabad Ex | 8377087607
(Best) ENJOY Call Girls in Faridabad Ex | 8377087607
 
Ms Motilal Padampat Sugar Mills vs. State of Uttar Pradesh & Ors. - A Milesto...
Ms Motilal Padampat Sugar Mills vs. State of Uttar Pradesh & Ors. - A Milesto...Ms Motilal Padampat Sugar Mills vs. State of Uttar Pradesh & Ors. - A Milesto...
Ms Motilal Padampat Sugar Mills vs. State of Uttar Pradesh & Ors. - A Milesto...
 
Market Sizes Sample Report - 2024 Edition
Market Sizes Sample Report - 2024 EditionMarket Sizes Sample Report - 2024 Edition
Market Sizes Sample Report - 2024 Edition
 
Flow Your Strategy at Flight Levels Day 2024
Flow Your Strategy at Flight Levels Day 2024Flow Your Strategy at Flight Levels Day 2024
Flow Your Strategy at Flight Levels Day 2024
 
8447779800, Low rate Call girls in Tughlakabad Delhi NCR
8447779800, Low rate Call girls in Tughlakabad Delhi NCR8447779800, Low rate Call girls in Tughlakabad Delhi NCR
8447779800, Low rate Call girls in Tughlakabad Delhi NCR
 
Cybersecurity Awareness Training Presentation v2024.03
Cybersecurity Awareness Training Presentation v2024.03Cybersecurity Awareness Training Presentation v2024.03
Cybersecurity Awareness Training Presentation v2024.03
 
Annual General Meeting Presentation Slides
Annual General Meeting Presentation SlidesAnnual General Meeting Presentation Slides
Annual General Meeting Presentation Slides
 
MAHA Global and IPR: Do Actions Speak Louder Than Words?
MAHA Global and IPR: Do Actions Speak Louder Than Words?MAHA Global and IPR: Do Actions Speak Louder Than Words?
MAHA Global and IPR: Do Actions Speak Louder Than Words?
 
Call Us 📲8800102216📞 Call Girls In DLF City Gurgaon
Call Us 📲8800102216📞 Call Girls In DLF City GurgaonCall Us 📲8800102216📞 Call Girls In DLF City Gurgaon
Call Us 📲8800102216📞 Call Girls In DLF City Gurgaon
 

Let the figures talk 1 7 w int1

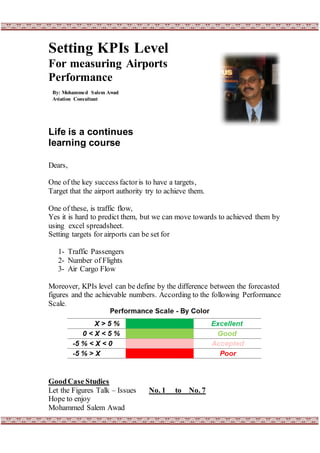
  • 1. Setting KPIs Level For measuring Airports Performance Life is a continues learning course Dears, One of the key success factoris to have a targets, Target that the airport authority try to achieve them. One of these, is traffic flow, Yes it is hard to predict them, but we can move towards to achieved them by using excel spreadsheet. Setting targets for airports can be set for 1- Traffic Passengers 2- Number of Flights 3- Air Cargo Flow Moreover, KPIs level can be define by the difference between the forecasted figures and the achievable numbers. According to the following Performance Scale. GoodCase Studies Let the Figures Talk – Issues No. 1 to No. 7 Hope to enjoy Mohammed Salem Awad By: Mohammed Salem Awad Aviation Consultant
  • 2. 22 Let the Figures Talk – Issue No. 1 Defining Airport Performance in 2018 Case Study: Heathrow Airport Let the Figures Talk: This issue is addressing the answer, for the question, why we are forecast the traffic of the Airports. The forecasting analysis is FAIR, when R-square is greater than 90 %, and consequently the forecasted figures are set as TARGETS to be achieved. Errors: are the deviations between the Historical Data with Model Fitted, always addressing by a range percentage. Performance: are the deviations between the target figures and the actual figures for the proposed target period (2018). Results above targets are good performance and represented by a green color, and results below targets are poor one, represents by red color. However, airports should set up the right target level to define KPIs system. i.e less than (- 10.0 % ) should consider as a poor one. Case Study: Heathrow Airport By referring to issue no. 29 Heathrow Airport, R- Squared (monthly model) = 98.01 % Errors range: + 4.73 % - 3.82 % Analysis: The figures of seven months for LHR shows an excellent performance, keeping in mind the red color indicates below the targets level (very minor percentage),while the green one is good performance. The performance range – 0.57 % to +2.22 %
  • 3. 33 Let the Figures Talk – Issue No. 2 Defining Airport Performance in 2018 Case Study: Dublin Airport Let the Figures Talk: Each Airport Forecasting can be review, The forecasting analysis is FAIR, when R-square is greater than 90 %, and consequently the forecasted figures are set as TARGETS to be achieved. Errors: are the deviations between the Historical Data with Model Fitted, always addressing by a range percentage. Performance: are the deviations between the target figures and the actual figures for the proposed target period (2018). Results above targets are good performance and represented by a green color, and results below targets are poor one, represents by red color. However, airports should set up the right target level to define KPIs system. i.e less than (- 10.0 % ) should consider as a poor one. Case Study: Dublin Airport By referring to issue no. 30 Dublin Airport, R- Squared (monthly model) = 99.00 % Growth: 7.81 % Errors range: + 7.43 % - 4.26 % Analysis: The figures of six months for DUB shows an Good performance,keeping in mind the red color indicates below the targets level (only two readings make a significant impact -4.63% & -5.21 % ), while the green one is good performance. The performance range – 5.21 % to +1.13 %.
  • 4. 44 Let the Figures Talk – Issue No. 3 Defining Airport Performance in 2018 Case Study: ATHENS Int. Airport Let the Figures Talk: Each Airport Forecasting for 2018 can be reviewed, the forecasting analysis is FAIR, when R-square is greater than 90 %, and consequently the forecasted figures are set as TARGETS to be achieved. Errors: are the deviations between the Historical Data with Model Fitted, always addressing by a range percentage. Performance: are the deviations between the target figures and the actual figures for the proposed target period (2018). Results above targets are good performance and represented by a green color, and results below targets level are poor one, represents by red color. However, airports should set up the right target level to define KPIs system. i.e less than (- 10.0 % ) should consider as a poor one. Case Study: Athens Int. Airport By referring to issue no. 32 Athens Airport, R- Squared (monthly model) = 99.12 % Annual Growth = 8.48 % Errors range: + 6.75 % - 8.08 % Analysis: The actual data of eight months of 2018 for ATH shows an excellent performance, keeping in mind the red color indicates below the targets level (very minor percentage), while the green one is good performance. The performance range – 3.34 % to +7.03 %
  • 5. 55 Let the Figures Talk – Issue No. 4 Defining Airport Performance in 2018 Case Study: CagliariInt. Airport Let the Figures Talk: Each Airport Forecasting for 2018 can be reviewed, the forecasting analysis is FAIR, when R-square is greater than 90 %, and consequently the forecasted figures are set as TARGETS to be achieved. Errors: are the deviations between the Historical Data with Model Fitted, always addressing by a percentage range. Performance: are the deviations between the target figures and the actual figures for the proposed target period (2018). Results above targets are good performance and represented by a green color, and results below targets level are poor one, represents by red color. However, airports should set up their own right target levels to define KPIs system. i.e less than (- 5.0 % ) should consider as a poor one. Case Study: Cagliari Int. Airport By referring to issue no. 98 Cagliari Int. Airport, R- Squared (monthly model) = 98.67 % Annual Growth = 5.95 % Errors range: + 8.39 % - 4.46 % Analysis: The actual data of eight months of 2018 for CAG shows an excellent performance, keeping in mind the red color indicates below the targets level (but greater than – 5.0 %), while the green one is good performance. The performance range – 3.72 % to +1.68 %
  • 6. 66 Let the Figures Talk – Issue No. 5 Defining Airport Performance in 2018 Case Study: Schiphol Amsterdam Airport Let the Figures Talk: Each Airport Forecasting for 2018 can be reviewed, the forecasting analysis is FAIR, when R-square is greater than 90 %, and consequently the forecasted figures are set as TARGETS to be achieved. Errors: are the deviations between the Historical Data with Model Fitted, always addressing by a percentage range. Performance: are the deviations between the target figures and the actual figures for the proposed target period (2018). Results above targets are good performance and represented by a green color, and results below targets level are poor one, represents by red color. However, airports should set up their own right target levels to define KPIs system. i.e less than (- 5.0 % ) should consider as a poor one. Case Study: Amsterdam Airport By referring to issue no. 39 Schiphol Amsterdam Airport, R- Squared (monthly model) = 99.03 % Annual Growth = 8.27 % Errors range: + 4.23 % - 2.72 % Analysis: The actual data of Seven months of 2018 for AMS shows a the performance of the airport, at -5 % threshold level, keeping in mind the red color indicates below the targets level (but greater than – 5.0 %), while the green one is good performance. The performance range – 9.28 % to +1.15 %. Should we review the threshod level to -10 % !!!, it depends on the airport policy and top management decision to review & setup these targets level.
  • 7. 77 Let the Figures Talk – Issue No. 6 Defining Airport Performance in 2018 Case Study: Aéroportsde Montréal (Int. Pax) Let the Figures Talk: Each Airport Forecasting for 2018 can be reviewed, the forecasting analysis is FAIR, when R-square is greater than 90 %, and consequently the forecasted figures are set as TARGETS to be achieved. Errors: are the deviations between the Historical Data with Model Fitted, always addressing by a percentage range. Performance: are the deviations between the target figures and the actual figures for the proposed target period (2018). Results above targets are good performance and represented by a green color, and results below targets level are poor one, represents by red color. However, airports should set up their own right target levels to define KPIs system. i.e less than (- 5.0 % ) should consider as a poor one. Case Study: Montreal Airport- Int. Pax By referring to issue no. 68 Montreal Airport, R- Squared (monthly model) = 98.01 % Annual Growth = 10.01 %, Errors range: + 8.25 % - 6.41 % Analysis: The actual data of eight months of 2018 for YUL shows the performance of the airport, at -5 % threshold level, keeping in mind the red color indicates below the targets level (but greater than – 5.0 %), while the green one is good performance. The performance range : – 6.70 % to +4.97 %.
  • 8. 88 Let the Figures Talk – Issue No. 7 Defining Airport Performance in 2018 Case Study: MiamiInternationalAirport Let the Figures Talk: Each Airport Forecasting for 2018 can be reviewed, the forecasting analysis is FAIR, when R-square is greater than 90 %, and consequently the forecasted figures are set as TARGETS to be achieved. Errors: are the deviations between the Historical Data with Model Fitted, always addressing by a percentage range. Performance: are the deviations between the target figures and the actual figures for the proposed target period (2018). Results above targets are good performance and represented by a green color, and results below targets level are poor one, represents by red color. However, airports should set up their own right target levels to define KPIs system. i.e less than (- 5.0 % ) should consider as a poor one. Case Study: MIA Int. Airport By referring to issue no. 75 Miami Int. Airport, R- Squared (monthly model) = 81.60 % Annual Growth = 00.00 %, Errors range: + 3.45 % - 4.49 % Analysis: The actual data of seven months of 2018 for MIA shows the performance of the airport, at -5 % threshold level, keeping in mind the red color indicates below the targets level (but greater than – 5.0 %), while the green one is good performance. The performance range : – 1.73 % to + 3.96 %.