

Empfohlen
Empfohlen
Weitere ähnliche Inhalte
Andere mochten auch
Ähnlich wie Geog2 question 2
Ähnlich wie Geog2 question 2 (20)
Mehr von Will Williams
Mehr von Will Williams (20)
Kürzlich hochgeladen
Kürzlich hochgeladen (20)
Geog2 question 2
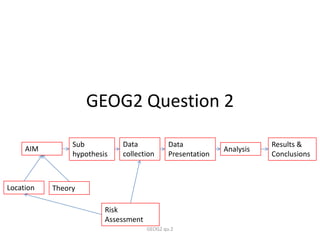
- 1. GEOG2 Question 2 Sub Data Data Results & AIM Analysis hypothesis collection Presentation Conclusions Location Theory Risk Assessment GEOG2 qu.2
- 2. The Enquiry Process Some Advice Specifically use the fieldwork practice in GEOG2 Question 2 o Use clear evidence that you have experienced the investigative process e.g. detail of sampling techniques used, names of locations where sampling took place etc o The assumption must be that you have not just undertaken the fieldwork but that you will have written it up – in the interests of the subject we will forgo a formal write up stage. The Personal Fieldwork Investigation has the following task: “....investigation of a geographical argument, assertion, hypothesis, issue or problem..” The stages of the “Enquiry Process” 1. The “aim”, “research question” or “hypotheses” The “aim” is what you are trying to achieve overall in your fieldwork location. This will depend on the time, environmental conditions, equipment and risk assessment. The “hypothesis” is a statement and more significantly the “null hypothesis” is a statement the highest quality of statement to form at the base of an investigation. GEOG2 (b)
- 3. 1. The “aim”, “research question” or “hypotheses” For any Investigation there will always be a; “Locational Context” that pertains to the area within which the study is to take place and a ““Theoretical Context”” that refers to the theory base of the investigation. It is important to recognise all potential sources of data on ether of these themes. This must include and range from GIS to personal visits. From the outset is important that Risk Assessment has featured heavily in the planning of the investigation. All Risk Assessments follow the same sequence: • Recognition of hazard • Recognition of Risk • Development of Risk mitigation strategies After recognising every potential risk and assessment should be done of the likely impact of the risk and the likelihood of the event occurring. Then a mitigation strategy needs to be developed. GEOG2 (b)
- 4. 1. The “aim”, “research question” or “hypotheses” Practice Questions: • a. Outline the aim and describe the theory, idea or concept from which your aim was derived. (4 marks) • b. Explain the geographical concept, process or theory that underpinned your enquiry. (4 marks) • c. Outline one source of information that you used and assess the extent to which it was "fit for purpose". (4 marks) • d. Explain how you devised your aim and how you responded to the risks associated with your chosen site for fieldwork . (4 marks) • e. Describe the location of your fieldwork and explain why it was suitable for your investigation. (4 marks) GEOG2 (b)
- 5. 2. Methodology and Data Collection To attempt any answering or refuting of assertions requires the gathering of data. As it is (usually) impossible to gather the full set of data from anywhere (the “population”) sampling must feature at the beginning of this stage. The sampling techniques that could be considered: Random, Systematic, Stratified or Clustered ( a form of stratification). You will need to explain the pros and cons of the technique used relative to the others. In addition any technique must be piloted. GEOG2 (b)
- 6. 2. Methodology and Data Collection There is no excuse for not knowing in detail the reasons for everything that has been done to gather information. GEOG2 (b)
- 7. 2. Methodology and Data Collection Practice Questions • a. Outline and justify one method of data collection that you used. • b. (6 marks) • c. Examine the limitations of your chosen methodology. (6marks) • d. Outline one hypothesis and describe one methodology for primary data collection in relation to this. (6 marks) • e. How did you respond to risks associated with undertaking primary data collection? (6 marks) • f. Discuss the strengths and weaknesses of the method of data collection. (6 marks) GEOG2 (b)
- 8. 3. Data presentation • The simple aim of all data presentation is to allow trends and patterns to be seen. This should also through up anomalies that may be of more importance as they often yield significant geographical issues. Principles for this section: • Variety of appropriate forms • Differentiate between cartographic or graphical methods as the most suitable • Annotated photographs have great value – be able to explain why. • Excel, repeated use of “Chart Wizard” leads to inappropriate masses of graphs that may have limited value • Quantitative and Qualitative techniques are always to be used • Integrate the presentation in with the analysis – an improvement on a “Data Presentation” section GEOG2 (b)
- 9. 3. Data presentation Practice Questions • a. Describe one method used to present your data. (6 marks) • b. Describe one application of ICT skills in carrying out your fieldwork and comment on its usefulness. (6 marks) • c. Describe and illustrate one technique you used to present data in this enquiry. (6 marks) • d. What difficulties did you face when presenting your results? (6 marks) • e. Describe a method of presentation that you used in your investigation and indicate how the chosen method was useful. (6 marks) GEOG2 (b)
- 10. 4. Results and Analysis • Collation is the first stage – look at everything and look again. Draw simple conclusions from each piece of data presentation. The highest level skill is to make links between data sets. • Find and state patterns, relationship and clear anomalies. • Be able to refer how ICT can have helped such as using multi- layering of maps to show relationships. This of course is taken one step further with layers in GIS such as Google Earth. • Be able to comment on the use of GIS in the exam. • Fully complete any statistical test to include significance testing. Always refer back to the original questions, aims, hypotheses etc. Evaluate the results with relation to any geographical theory that may be pertinent. • KNOW YOUR SPEARMAN, LOVE SIGNIFICANCE GEOG2 (b)
- 11. 4. Results and Analysis Practice Questions • a. What are the advantages and disadvantages of the analysis technique(s) that you used? (6marks) • b. Outline and justify the use of one or more techniques used to statistically analyse your results (6marks) • c. Name one technique of data analysis and describe how it was used (6marks) • d. What is meant by the term 'significance' in the analysis of fieldwork data? (6marks) • e. In the context of the analysis of fieldwork data, outline the meaning of 'anomalies'. (6marks) GEOG2 (b)
- 12. 5. Conclusion and Evaluation • Draw all threads together, make a final summative statement to all questions and to any over-arching hypotheses or aim. Indicate what you would do next to develop the work further, evaluate the strengths and weakness of the techniques that have been used. • Evaluate what has been done from the original aim through the method of data collection to the data presentation skills. GEOG2 (b)
- 13. 5. Conclusion and Evaluation • Practice Questions • a. How far did your fieldwork conclusions match the geographical theory, concept or idea on which your study was based. (6 marks) • b. Summarise your findings and suggest how this enquiry could be improved. (6 marks) • c. Making specific reference to your results, suggest how your enquiry could be improved. (6 marks) • d. In what ways would your conclusions be of use to other people? (6 marks) • e. Drawing upon your findings, explain how your enquiry improved your understanding of the topic area. (6 marks) GEOG2 (b)