
![PAGE 13
CHIEF COUNSEL OFFICE
05/20/2061 15:06 3012861713
.
Greenhouse Gas Mixing Ratdos
(ppm) ~. H(ppb>.
192a -
IS92z -*
10 - tro
350 ice core
O 100 T 'Ictv
NZOWb)
in svellarionario
4. -1
c cr
!c- instu
~ ~ 0
300~ ~ I-
[PC 9
201 -ta-H-nd300
S2aseasfrC
320se
scenarioC sis Ful
owe
4.2 CpC4--
4,
300
-0C1
0
insiu
-'--othe alo
2050 1~~50 19752000 ZS05
2025
1975 2000
O.CH n 2 0[P
1900ceaisfo 199250 i~taedfrcmasn
20001
Hanseneta]-
ro felwoK ndssiodns from] Felsmt ox~c yN.Mlo3
eisio
Figre8.C0
Uiveri Y
Rockfellr 2](data:image/gif;base64,R0lGODlhAQABAIAAAAAAAP///yH5BAEAAAAALAAAAAABAAEAAAIBRAA7)
Empfohlen
Weitere ähnliche Inhalte
Andere mochten auch
Andere mochten auch (18)
Mehr von Obama White House
Mehr von Obama White House (20)
Kürzlich hochgeladen
Kürzlich hochgeladen (10)
Climate Graphs 9.20.01
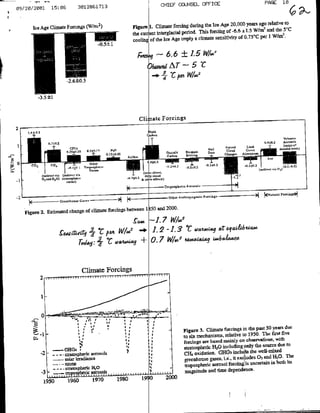
- 1. 1 CHIEF COUN4SEL OFFICEPAE 83/20/2001 15:05 3012861713 Ae200yesagrlaiet 2 Fgr1.Climate forcing during theI Ice Age Climate Forcrngs (W/m ) 2 of -6 .6 *1.5 W/m and the 5'C the current interglacial period. This forcing 2 of O.75 0 C per 1 W/m . -0.5± 1 cooli. of the Ice Age imply a climate sensitivity re=g- 6. 6 +LSK/WM 4 CeWn -2.6±0.5 -3.5*±1 Climate Forcings I 2 I0,7+0,Z to W~~~ 0.4±0.2dAt-0 0Is iG W,±.3 V~aI 0.35.0.05 .9±0.4~~-030. Meal~~~~~~~~~~~~~~~CTU ~ tdLona~ 0 -0 I -0.2r0. 2 2 ,drc vi ~ 1 -0.1+0 1 rnosbeLGO Troposphcfl; Acro6pI.i ~ ~ ~ ~ ~ ~ I Otbet Anthr ...... iCFotilng% ----- ) 4aci )~cnt5-j G'.C0'4'C forctngs between LLS and 2000. Figure 2. Estimated change of climate C~w L1.7 KW Tot/ag: 3T r wau,56KY ± 0. 7 Wli 2~ uoaxUxy inkbatzao Climate Forcings 2 due Figure 3. Clmt forcmgs inthe past 50 year ~~~~~~~~~~~~torltv six mnechanisms, o15-Tefrtfv C fordongs am based mainly on observationls, with 4.1~~~~~~~ due to stratiospheri 1120 jBcuding only the source -GHGs * gaies. itnecludesth 03llmandH0.Th ~ so2a wroo trradpheiace CH, oxidation. 010inlSetewl-xd n 40 h -2 soratser iCrfl)S'IS *rehuegss ~. t xlds0 -.ozone troposphedec aerosol forchig;I~s uncertain in both its H20 - .stratospheric i magnitude and time dependence- ti siti3ersl 1950 1960 1970 190 1980~~~~~9 2000
- 2. PAGE 13 CHIEF COUNSEL OFFICE 05/20/2061 15:06 3012861713 . Greenhouse Gas Mixing Ratdos (ppm) ~. H(ppb>. 192a - IS92z -* 10 - tro 350 ice core O 100 T 'Ictv NZOWb) in svellarionario 4. -1 c cr !c- instu ~ ~ 0 300~ ~ I- [PC 9 201 -ta-H-nd300 S2aseasfrC 320se scenarioC sis Ful owe 4.2 CpC4-- 4, 300 -0C1 0 insiu -'--othe alo 2050 1~~50 19752000 ZS05 2025 1975 2000 O.CH n 2 0[P 1900ceaisfo 199250 i~taedfrcmasn 20001 Hanseneta]- ro felwoK ndssiodns from] Felsmt ox~c yN.Mlo3 eisio Figre8.C0 Uiveri Y Rockfellr 2
- 3. CHIEF COUNSEL OFFICE PAGE 12 09/20/2001 15:0E 30122e1713 0 4] (a) Stratospheric Temperature ( C) [MSU Channel 2.0 -1.5 ~ Bsns-SUtl Ocean, Wini) (c) Planetary Energy Imbalance (Heat Storage in FigureS5. Simulated temperatures and Planetary energy for the six ~~~~~~~~~~~~~~~~~~~~~~~im 1'0 forcings in Figure 3 for 1950-1999 with two scenarios for 2000-2050, .0 ~~~~~~~~~~~~~~~~~~~~with businesl-aM-u9ual (1% CO 2 year, 2.9 Wtjn) .5 ~~~~~~~~~~~~~~~~~~~~~~~~a the alternative scenario (Figure 7, W/n 2 ). ~~~~~~~~~~~~~~~~~~~~~1.1I 1.0 1990 2db203 20.50 1950 1970 Alternative ScenariO Business-As-Usual Scenario 3W Gasotes 1 C02 Other GasesGae 1050 in a "business-as-usual" scenario and the "alternative" Figure 6. Added climate forcings between 2000 and scenlario.
- 4. qn~~~~~ CHIEF ~~~~~PAGE COUNSEL OFFICE 11 CIFCUSLOFC @3/20/2001 15:06 3012861713 simulated and Observed0 Climate (Change Channel 4] (a) Stratospheric Temper~tr ( C)[MStI -.5 Base Perid 1984-90 -10(b) Tropospheric Temprn rC(oC) (MS'U Channel 23 -. 2~ .6 -.01 Coeri(d: OceanBIce (e) 4~~~~~~~~~~~~~~6~~~~~~ lnc (Heat t198g 19n OcenWI lntayEnry6m0 1950 I'0~~~~~~~~~~~~~st~l~a~ih05 hnefr15.00 hs Figre . imuatd adosre lmt f iue3 si heoen Ciaefrcnsae hs clmt odlepoyepnalmxn a
- 5. 4 CHIEF COUNSEL OFFICEPAE 09/20/2001 15:0E 30128E1713 The Forcing Agent Ud yngClimate Change Group Briefing for:0 iba Clmten DChag Working Max~ 29, 2001 lanes B.Linsen, Head Studies NASA Goddard Inhtitute for Space climate chanlge. I am director of the NASA. Tankyouforti-s oporlinty to discuss Goamonin- C olumia of Goddard Space Fligh Cetr oatda Goddard hnstitute for Space Studies a division h at'&ciate -thowpbit University in New York, We specialize in the stud ofpaethseill icntattes publaic varies, and why it varies. One of our prime 0 beolstopoiesintfcifra not our job tosuggest polce.,n 31 help wake i5L policies- It is and their representatives canuet qI aRtitati'v adas clear as the data permit. infrmatin thtseas from year to Year is toprovie tnor&stio thmarie as few aiconet. The Earth's climate fluctuates itopermvitde socane from day to day. It is a. chaotic system, responds to and century to century, just as the weath~t filuctae in magnitude. The climate also change aelitd occot. without any forcing, te sn chaotic but the art beoms warmer- if a large volcand spews bighen, anatra focin, te faring. I ol wyadteBrhtnst aerosols into the stratosphere. these small particl~rfetsnih l h ua-ae Fieape There ate also hurman-made forcings. squarentt Cwim) o xmlaltehmnmd We measure forcings in watts per miniature . 2W/rn. It is as if we have placed twoincreasing the as ocn fmr greenos gae2o meeoof h Earth's surface That is equivalent to C nhoutmS ga lbs cuever squrein ge nov u otrlal teErhsciaei oafrig brightness of the sun by about 1 percent. sensiieteErhsciaei oafrig u otrlal We understand reasonably well how can compare the current warm period, which has the Earth. measure comes from the history of ic gaout 20,000 years ago- We know the previous existed several thousand Years, to the were trapped as the ice sheets the ice ag rmbubbles of air that composition of the atmosphere during less carbon dioxide (GO2 ) and less frmsofl.Teewas on Greenland and Antarctica built up with ice sheets covering Canada (CH 4 , but more dust in the arTesuAfacc was different then, sea level methane even the coast-lines differed, because and parts of Europe, differenit distributos fVejetatiofl, a negative climate forcing of as Summarie6d in Figure 1, caused was 300 feet lower. These changes, than today. This empirical a plant that was 5 C colder about 61½ W&n. That forcing maintained /4urVC watt of forcing- Climate models per have the informatiOn implies that climate sensitivity is a the complex agreement between the real world and sane sensitivity, which shows an encouraginghoclmt may change in the future. predict computer models that we are using -to h climate cannot respond immediately to a There is another important concept to undesad to achieve just half of to wan the ocean. It takes a few decades only 75-90 percent forcing, because of the long tint needed respofise may be a forcing. Een in10yerth the equilibrium climate response to o oiymkr. It means that we can put complete. This long response time complicates th rbe children and grandclhildtren. will only ermergeduigtelvsoor into the pipeline climate change that n so that the most appropriate and undersdand cliaecag al Therefore we must be alert to detect policies can be adopted. summasrized in Figure 2. The greenhouse gases. With that preamble, let',s discuss the climate forcings has the largest forcing, but woujl tend to cause warming- C0O, on the left, have a positive forcing, which a forcing half as large as that of CO~. effect on other gases, causes methane, when you include its indirect are not negligible- inth future, but the other forcings CO 2 is likely to be increasinlgly dominaml particles in the air. Some of these, such as sulfate, Aerosols, in the middle of the figureaefn oil burning, are white, so they scatter sunlight and cause in coal aid which comes from the sulfur released especially of diesel fuel a cooling. Black carbon, which is soot, is a prddut of incomplete combustion,
- 6. PAGE 05 CHIEF COUNSEL OFFICE 15:O8 3012851713 03/20/2001 increaseffeth s humbergof th plntoArslstn toe and coal. Soot a~bsorbs sunlight and thus warms a#d longer-lived. Alloftearslfecshvlrg brighter coddoplets, in turn making the clouds urncerstainties, is wolmtd.cnld t are, inadqae n uncertainty bars, because our measurements fC Beganth~ e wrrrubrd concludeth, If we accepted these estimates at face value, desieterlag ro as nsm by 13 W asnethIdsra eoui~lbgn[h warming from a clmt forcing has increased ntentfrigo Wi]-The equilibrium cliate n ctvyedauneant we would expect a u2-.3c.ri Hoevr beaue of the ocean' s long response time, fasein ofu1.7ctive, yis remiglos, wittatrmuch yimaac ofC0.7 W/nothe a global warming to date of only about 3/400. AA This moans there istohr120gobal' warming' than going out- more energy com-ing into the planet siio remispefixdatl tday'sth values5 - it will occur even if atmospercaom yeaescilydrnthpst2 already in the pipeline more, Pleciseliy for the past 50 We Jcnow these climate forcings axe shown in Figure 3. The history Of the yeas o saellte neaureefts. Our best estimates tis vr Of postv n eaIves dorcings tropsphricaerosol forcing', Which involves Partil cancellation whichaelrgfoinsdigtis forcings, uncrtan.However, the GHU adsrtpbfcerosol 1= oe ocluaeth lmt hne ssoni sSoni period. are known accurately. aclt h lmt hne a global claemdlt When we use these forcings in EWe make five model runs, because of the chaos in Figure 4, the results are consistent with observati ts. black dots are observations-I The is the average of the five runs. The the climate system. The red curve increase, but it warms after volcanic of ozone dep letion and C02 Earth's stratosphere cools as a result the predominantly positive forcing by exnptions. The troposphere and the surface warminbecatQtC of with observations. reasonably good agreement iticreases of greenhouse gases, in that the simulated planet has au increasing energy in Figure 4 is important. It Khows is energy The fourth panel the planet, from the sun, than there imbalance with spate. There is more energy coxrirg intit implies that imbalance today is about 0.7 Wi . This, as mentioned above, going out- The calculated even if the atnosphefic warming al ready in the pipeline, there is about 0-5CC additional global confirmationl of this energy imbalaiice has occurred coniposition does not change frh.Aniprtartf study, by Syd Levitfls of NOAA. shows the deep ocean isIwanng. That t~he past 50 years, which is.reasonably recently~vith the discovery that average rate of 63 W/nt during as that the ocean took up heat at an global sea ice cover has also decreased from climate models. Observed consistent with the predictions the models predict scenlarios into the future for two climate forcing We extend these climate model simulations scenario, which the newspapers love, the illustrated in Figure 5. In the popular "busirie5~ss-ti-sual" years. Ttis leads to additional global warming 3 W/n? in tile next 50 climate forcing increases by almost the "alternative scentario fossil fuels continue to and several degrees by '100 In growth of about 1.5CC by 2050 CO 2 emissions, but there is no farther The be used at about today's rate, with a slow trend toaward less any worse that it is today. air pollut~iou is iot allowed to get of the other forcmg.s. In simple termis, scenario is just over 1 W/11? in the next 50 years- added climate forcing in the alternative scenario. is about ¾/ 00, much the next 50b years in the alternative declines in the additional global warming in The the business45s-sual scenario. In addition, the rate of stratosphefle cooling planetary less than for begins to recover. The stop entirely if ~aop~l ozone scenario, but by almost 1 Wlm? in alternative scenario, and it way only about ¼/Wni the alrernative energy imbalance increases by the busine5ssas-usflal scenarid. the alternative scenario. First, we must kceep thethe is Figure 6 adde C07foringsat emphasizing the two arts of of C02 increase in the next 50 years to be about a cartoon W&.Thisrequres rate in the C02 growtb the sceflafio has a slow decline recent decades. More precisely, the second half same as it has been in further decrease growth rates in rat& during this 50 years, which would make~ractical to it that means is assumed to cease. Principally of the century. Second. the growth of other cliia~te forcings specific trace gas scenarios used in the and black carbon aerosols, [The methane. tropospheric ozone, in Figure 7-1 GCM simulations are shown rate from exceeding that of today? Figure 8 ,C~abonDiwde.Is it realistic to keep theC02 growth than 4% increased exponentially at mote helps us to think about this. After World War Ci emnissions % 2
- 7. CHIEF COUNSEL OFFICEPAE0 15:06 3012861713 09/20/2001 PericeaI ta e ol% by fossil fael6energy Sinc 0ther peortya- per year, as economries anudwealth eXpanded rapidlydriven was raehsbenjs oe1veeya.btt19si weohav bas nothear short perios shock in the 19705, the growth a ea lk slightly negative. efisDoty ard from having the past three years it has been syta the wrld emissions- H-owever, tisfrto nryefcec n eeal with negative rate of CO2CC growth of . This suggests that incr~e mhsso flat emission emission rates and declining emission the difference between ibrasn C 2 eergysucscnwk However. I do want to make ~ ~ ge no djCYo seiicplcies. rates.~ gtit doayo pcfcPl -ndont want to inappropriately basis of actions that make is a practical Scenario. it is doable on the or renewable energy can clea ttteatraiesnario, u stinig that energy efficiency a larger goodar onornthe andtstatiegi s~ens."'mnt will continue to increase, as Shortae. ELMoblts BIg trical power needs Indeed, this is helpful for the sake of aloeone olve curndsrtepowe use is electrical. alne slarer puroet poweofour andte wrorld's ee- cras neg to reduce air pollbutinadin achieving the alternative scenario, It is more praltcS aruhaing-ma local sources of fossil fuel should al~so be awar itia effilenY ata mdempower station than at I pote that policy-makers, scenario if aging nuclear aruet, Atiiec ris mofdlterigmman meain ngrgume ath sms~ions in the alternative the lutein slowl t~ciV y lmt plants.ieaing bedfiut improved effiienc cleaos-oal by coal-tfired plants. evwusing bullet' for teproeo nnm7il lmt powet plants are replaced power is close to being a silver Other issues a"ide, nuclear contrast the: merits of these policY-malbag rersentatives should carefully If clean-cOal tecbnology forcitigs. Thtpflblic and their are each develoed to their modern Potentials- different energy sources as they hnaheeet of the alternative scenario way for coal in Power geeain C2 Cpueof CO2 at power plants leads to an increasing role of some of the coaile- te to be require capture and sequeStratiOfl methods of sequestraItion an the uLtimate effects of sequestrfttidflneed way in fact be practical, but scenario, in understood better. for achieving the alternative ~~~~~2~ns The other requiremenit of nion-C0z forcng.rncpl. and of C0'2, [is to stop the growth (03) addition to flattening the emissions rate the growtb of black carbon (soot), tropospheric ozone better reverse dilute amouflts methane is that means to halt, or even a-s air pollution, although in methane (CE1 ). 'These can loosely be descrbd carbon, nitrates and sulfates, and txdpospheflc carbon, with adsore orsanic 4 not harmful to health, Black in air po1 ilib 1 very ozone are the principal ingredients 1 case of exhaust puffs from carbon acrosOliexcept~il the extreme Black carbon (soot). Black tiny 5ponges that soajc up toxic are invisibly small i~articles. They aie like small that they dirty diesel tracks or buses, product of fossil fuel combustion. The aerosols are so ogncmaterial that is also a into the lug.Iti:lt i oluinhsbe penetrat human tissue deeply when they are breathed A recent study in Europe [Kunzil. 20001 respiratory and cardiac problems.25,000 new cases of chronic bronchitis, increasingly implicated in caused arnuallY 40k00 deaths, Switzerland and estimated that air pollution 500,000 asthma attacks in France, of therO? 20000 episodes of bronchitis in children, and~ percent olto from the human health impacts equal to 1.6 carbon in the Austria alone, with a net cost level- Primary sources of black the U5S. are at a comrparable levels and health effects in In h eeoigwrdaesagdl.Asuyrcnl West are coal burning and diesel fuels. pollutioni h eeoigwrdaepagrn.Asuyrcnl air The human~ costs of particulate that about Sciences [Smirh. 2000] concluded of the National Academoy of infections arising from published in the Proceedings per year from acute respiratory nfiin the age of fie- uyb o eprtr 270,000 Indianpollution. under case the: air pollto scue ~ children In This of cooking and pariculate air ad coal within households for I the purpose burnngo fied co dun, biwa reidu, use isthlagtsore bad, but there residential coal heating. pollution levels in China are compa~rbly [Streets. 2001V. black followed by residential biofii4 cause cooling, in addition to note that ibeiej are several aerosols thnt eimssiofls or reduce pReferring back to Figure 2. oso h growth of sullijt Ifot There are Ongoii scenario for climate carbon that causes warm~ing. of reduinacdrn.I our alternative emissionis absolutely, for the purpose 3
- 8. Il CONLOFIEPt 15:05 3012881713CHE 03/20/2001 cleaner mOrf cenrmeefincintdieusel motorsand eri placetof heating. Principal opportunities in the West are o Lie developing world ofpnldeue io Opporunmities in efficient coal buturnin at utilities. eventually use atelectrical energy produced at centralpoeplns solidfuej forhoushold use, and ourganicf ethae alozonetfributi)n arevoatil Ozone (Os). Chemical emissions that lead to anopo cntrbete. PBecausores foei o h anpetaeolo compounds and nitrogen oxides (carbon monoXidJ plants and industrialprcse.Baueoneith power cemcal ar tansportatiofl Vehicles, thee leemissi onsei Sloaltrbem, eig., ospheric ozone is a can have a lifetime of weeks, trop cozon ofd free troposphere quality in the United S ates ihlevelsh Asia are projected to have a significanit effect on air health andero s Of the impacts an theUanie helthandecoystemn effects. Annual costs billion per year i'teUie hav aders Order Lt $10 ttsaoe be on the harodctvetrsaeheacth adecstiatd to to stop further -growthof polltarnt ths Our alternative scenario assumes that it will bepsil downwind of reginuhas Western ozone d ti easing Recent evidence suggests that tropospheric nowonrle but increasing downwind Of EasAia are Europe, where nitrogen Oxide esnissiofls combusintcnlg oaheea There is aclear potential for cleaner energy source and improved dcyo raiiatrudr ozone reduction.mehnismcba smcoildcyo rai ae ne Methane (CR4-. The primary natural soarce b ehn as the natural AnthropogeIic sore, hc in sum may be twice as great leakage anoxic conditions in wetlands. rumin ts, baceildecay in landfills and sewage, sourc, include rice cultivation, domestic from naD a gas pipelines, and biomiass burning. during the wining of fossil fuels, leakage wil bposible to stop further growth of methane VithinL 1-2 that it our alternative scenario assumes are economic benefits to reduction and bring about a small reduction in mtae by 2050- There and waste decades to methane Ca-pture from landfills of methane lass from pipelines and during miiAand clean fuel. There is also an incentive and methods can be usdas a. management lagoans, as the methane as their goalsartopduem tilanpwr available for farmers to reduce methane production~ and fiber flora the fields, not methane. However, to produce food fromn the animals, not methane, and automaticaly. The large climate benefits are not so great that the¶ are: likely to happen gas. these economic more attention being paid to this forcing by methane, which is half as large as that yc~,wrat are important focnbtseveral other forcings Su~marn- CO, causes the single largest clat the sum of these forchigs. Figure, 2 emphasizes ems rdce Indeed& (Figure 2). To reduce global warmuing troposphlic03.o~ and CE4 are important climoate forcings. carbon, that, in addition to CO~. black that fossil fuel burning will of C0 2 . Although it can be assumed their forcing, in sum, exceeds that (alternative to business-as--Usual) we suggest aul alternative scenario of a Continue in the foreseeable future, 50 years and allow the possibility that would result in relatively moderate climate th ngeh the next possibility of stronger remedies in later in the Cetu, as well as the ,,soft landing", for climate change a necessity. onclmtLhfg indicates such is only I W/m .- t decades ahead if empirical evidence climate forcing in the next 50 years energy theade Alternative scenario. In this scenario sA!s which could be achieved via improved Thi rquresony dwnten i CO e .sal The other requiieifltft in from no3tfossil fuel sources of energy. conceited attack on air efficiency and increased contributions clmt forcings, which implies a this scenario is stop the growth Of non1-C02 pollution. forcing scenario, - benefits- There are multipl benefits of the alternative climate opportunities world, increased States and especially in the developing jncluding improved public health in the United for business and technology. Indeed, the energy independence for the United States, and opportunities hum-an health and agricultural productivity. benefits via improved alternative scenario leads to i6conormic putting the United States in a positive leadership role in a strategy of This, scenario also has the advantage wo rld, as well as the developed world- the alternative scenario that should be welcomed by the developing MO limat chage. Te increase of climate forcing in Soft andinfor the case with business-as-USal. energy imaac"tan would be results in a much smaller "planetary a much lower chance of dramatic climate Thus we will be willing to our children andgrncidn be feasible to with C0 2 emissiof! elnn slowly toward 2050, it should problems. In this scenario, In the worst4 opsto ae nte etury with advanced energy technologies. stabilize atopeL
- 9. CHIEF COUNSEL OFFICE 15:05 3012851713 09/20/2001 energy we fail to have developed non-fossil cas, i clmat cang aceleats unacceptably ad should and setluester it, as a Ilarger and larger CO2 at p wer station sores,ifbteshould epactic~alto cpture power stations. gescnb po IDof energy generation Will occur at cetral progrsban be2 scenaopoidsennfakagntwhh n aamnrhtoieUiedSae g eloblC M'easurabk Progress. The alternative demonstrated. Ini the 1990s Idespite extensive gloa aretwel beusaCOopenisiohc) fossil fuel us ad emissions increased, as did global air pollution, mrvn-thus ethseereail years wien th reodsta af air Pollutionpolluti[onr levels during tenx eea er ihteted level tabulated and measurements and air vr teNS will allow comparison of ernissionlE that occurred in the recent Past. ond'efo~c~ the eie-Hwv' NASA has no to seen :oel mind oel ntetpc Disclaimer.Danielspecilic discussion this Goldin, has encouraged mtosek my Administrator, century; an alternativC , .Sto. Watecd- A- Lacis and V. Oinas, Global warming in the twenty-first Rdy, Sc, 91. 9875-9880, 2000- Hansn scnajlo,Sato . foughtoli. Lfl. Meira ClmtcCag 992, edited by J.T- IntgOeD~~nProlane o Cimt ChangeS(DCC) 1992 . ubou61x resS -. york., geN ew Filha. B -. caliander and A S.K. Varney, Cambhridge O. Fi - Sommry,M Hora20c, '..Publnic-helt M-, Chanel. 0Idilier a]dSmmr - 00,~ulc.c~ N.,YKaisor,RB-, Medinla, S. studnicka, B... ver gnau& J.C. I Kunzli, VQenel.p., chneidr I, Seetbalor : a European assessment'. The Lancet 35679-01 Texie. air pollution Teiepc f o. utdnctr and, tafc-related Ridge, TN, .19798. 8-323 ork Nallt-oab, POcak aidg Marlarnd, G. and T. Hoden, co, Information Cenec ssi. i Chin-a29, 97 disease in India fro idoarpllin.Pc.NtAcd Smith., K R-, National burden of msinnCia 7C odadB iuBakcro Stretts, D-G-, S. Gupta, S1-TwaidhoffM.Q. Wan~g, Atrns. Environ-, in press, 2001. 5-
- 10. B9/20/2001 15:0IB 3012861713 CHIEF COUNSEL OFFICEPAL , Summary: CliaeForcings 1. Climate is being forced by' human actions 2. It takes a long time for foirings to have their full effect 3. Reducing the net forcing is clearly desirable 4. CH!, black carbon, and oospheric 03 are almnost as 4 important as CO 2 over tile next 50 years 5. Aggressively targeting the non-CO,2 forcings wvill lead to slower growth in the net forcing than just 'thckling CO 2 would, while also leading to other benefits, especially for human he~lth 6. CO2 remains important, especially on longer time I~~~~~~~~~I