
Recommended
More Related Content
What's hot
What's hot (20)
Similar to Data analysis & report writing
Similar to Data analysis & report writing (20)
Recently uploaded
Recently uploaded (20)
Data analysis & report writing
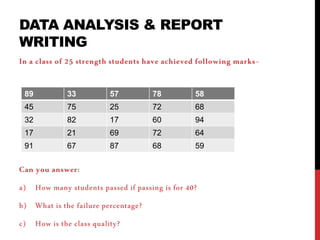
- 1. DATA ANALYSIS & REPORT WRITING In a class of 25 strength students have achieved following marks- Can you answer: a) How many students passed if passing is for 40? b) What is the failure percentage? c) How is the class quality? 89 33 57 78 58 45 75 25 72 68 32 82 17 60 94 17 21 69 72 64 91 67 87 68 59
- 2. DATA ANALYSIS DATA ANALYSIS refers to the computation of certain measures along with searching for patterns of relationship that exist among data groups. • The general flow in the research process is – a) Data Collection b) Data Processing & c) Data Analysis • However Data Collection is already covered in the last chapter.
- 3. DATA PROCESSING DATA PROCESSING includes- • Editing: (Field & Office) (Completeness, Accuracy, Uniformity etc.) • Coding: (Specify various Categories & Allocate Responses) (Appropriate, Exhaustive, Mutually Exclusive, Single Dimension, Code Sheet etc.) • Classification: (According to Attributes, According to Intervals) • Tabulation: (The logical listing of related quantitative data in vertical columns and horizontal rows with details)
- 4. RULES OF DATA TABULATION A) Rules regarding table structure- • Table Number • Table Title • No of Rows & Columns • Captions & Stubs • Ruling & Spacing • Column Size • Arrangement of Items • Table Units • Explanatory Notes • Source • Totals
- 5. RULES OF DATA TABULATION B) General Rules- • Attractive Shape • Simplicity • Place of Approximation • Free from Irrelevant Data • Use of Circle or Box • Miscellaneous Columns • Non availability of the data
- 6. FREQUENCY • Frequency: It is the number of times a given quantity (or a group of quantities) occurs in a set of data. • Types of Frequency: a) Relative Frequency b) Cumulative Frequency & c) Percentage Frequency • Frequency Distribution: a) Discrete or Ungrouped Frequency Distribution b) Continuous or Grouped Frequency Distribution c) Cumulative Frequency Distribution
- 7. DISCRETE OR UNGROUPED FREQUENCY DISTRIBUTION • Income of 10 peoples in the Colony- Person Profession Income Nasir Pvt.Employee Rs.3.5 Lac Anand Govt.Employee Rs.2.8Lac Sachin Business Rs.7.0Lac Shivam Pvt.Employee Rs.4.3Lac Tanvi Govt.Employee Rs.11.4Lac Shravya Pvt.Employee Rs.1.8Lac Rajiv Farmer Rs.75,000 Tina Farmer Rs.97,000 Jyoti Farmer Rs.13.6Lac Manoj Govt.Employee Rs.8.6Lac
- 8. CONTINUOUS OR GROUPED FREQUENCY DISTRIBUTION • Income of 10 peoples in the Colony- IncomeSlab Frequency GE PE F B Total Upto01Lac - - 2 - 2 01to05Lac 1 3 4 05to10Lac 1 - - 1 2 Above10Lac 1 - 1 - 2 Total 3 3 3 1 10
- 9. BASIC COMPONENTS OF CONTINUOUS OR GROUPED FREQUENCY DISTRIBUTION • Class Limits: • Class Intervals: [C.I. = (𝐿−𝑆) 𝐾 ] [Exclusive/Continuous Class, Inclusive/Discontinuous Class, Open Ended Class] • Range • Mid Value or Mid Point • Frequency • Number of Class Intervals: [K=1 + 3.322log10 𝑁] • Size of Class Interval: [C= 𝑅𝑎𝑛𝑔𝑒 1+3.322log10 𝑁 ] i.e. 𝑅𝑎𝑛𝑔𝑒 𝐾
- 10. GRAPHICAL REPRESENTATION OF DATA • Bar Chart • Pie Chart • Histogram • Leaf & Stem • Candle Stick • Box Plot (Smallest Value, Lower Quartile, Median, Upper Quartile, Largest Value)
- 11. TYPES OF DATA ANALYSIS UNIVARIATE ANALYSIS: (Measures of Central Tendency i.e. a) Mean, b) Median, c) Mode etc. ) BIVARIATE ANALYSIS: a) Correlation Analysis b) Linear Regression c) Association of Attributes d) Two Way ANOVA Multivariate Analysis: DESCRIPTIVE ANALYSIS Statistical Estimation: Hypothesis Testing: INFERENTIAL ANALYSIS
- 12. UNIVARIATE ANALYSIS MEAN: x= ∑𝑋 𝑁 ------for Individual Series x= ∑𝑓𝑋 𝑁 ------for Discrete/Ungrouped Frequency distribution x= ∑𝑓𝑋 𝑁 ------for Continuous/Grouped Frequency distribution
- 13. UNIVARIATE ANALYSIS MEDIAN: Md= Value of [ 𝑁+1 2 ]th Observation in ascending order ------for Individual Series Md= Value of [ 𝑁+1 2 ]th Observation in ascending order ------for Discrete/Ungrouped Frequency distribution i) Find Less Than c.f. ii) Then find median class= class to which [ 𝑁 2 ]th observation belongs iii) Md= l+ ℎ 𝑓 [ 𝑁 2 − 𝑐] (where, l-Lower Limit of Median Class, h- Size of Median Class, f- Frequency of Median Class, C- Cumulative Frequency of Class immediately preceding the Median Class) ------for Continuous/Grouped Frequency distribution
- 14. UNIVARIATE ANALYSIS MODE: M0= Value with maximum frequency ------for Individual Series M0= Value having maximum frequency ------for Discrete/Ungrouped Frequency distribution i) Find Modal Class i.e. class with highest frequency then ii) M0= l+h [ 𝑓1 −𝑓0 2𝑓1 −𝑓0 −𝑓2 − ] ------for Continuous/Grouped Frequency distribution Mode = [3Median - 2Mean]
- 15. UNIVARIATE ANALYSIS STANDARD DEVIATION (6): 6= 1 𝑁 ∑(𝑥−𝑥)2 ------for Individual Series 6= 1 𝑁 ∑𝑓(𝑥−𝑥)2 ------for Discrete/Ungrouped Frequency distribution 6= 1 𝑁 ∑𝑓(𝑥−𝑥)2 ------for Continuous/Grouped Frequency distribution
- 16. UNIVARIATE ANALYSIS VARIANCE = (62) COEFFICIENT OF VARIATION = 𝟔 𝑿 × 100 RANGE = L - S QUARTILE DEVIATION = 𝟐 𝟑 𝟔 MEAN DEVIATION = 𝟒 𝟓 𝟔
- 17. BIVARIATE ANALYSIS A) CORRELATION ANALYSIS: a) Simple Correlation b) Multiple Correlation c) Partial Correlation B) REGRESSION ANALYSIS : a) Regression line of y on x b) Regression line of x on y
- 18. CORRELATION ANALYSIS KARL PEARSON’S COEFFIECIENT OF CORRELATION (r): rxy = 𝑪𝒐𝒗(𝒙,𝒚) 𝟔 𝒙 𝟔 𝒚 = 𝑵∑𝒙𝒚− ∑𝒙 −(∑𝒚) √[𝑵∑𝒙 𝟐 − ∑𝒙 𝟐 ][𝑵∑𝒚 𝟐 − ∑𝒚 𝟐 ] COEFFICIENT OF DETERMINATION = r2 SPEARMAN’S RANK CORRELATION COEFFICIENT (þ): Þ=1- 𝟔∑𝒅 𝟐 𝑵(𝑵 𝟐 −𝟏) (where d is difference between ranks)
- 19. REGRESSION ANALYSIS Regression Line of y on x: (y- y ) = byx (x - x ) byx= 𝐫 𝟔 𝒚 𝟔 𝒙 = 𝑵∑𝒙𝒚−(∑𝒙)(∑𝒚) 𝑵∑𝒙 𝟐 − ∑𝒙 𝟐 Regression Line of x on y: (x- x ) = bxy (y - y ) bxy= 𝐫 𝟔 𝒙 𝟔 𝒚 = 𝑵∑𝒙𝒚−(∑𝒙)(∑𝒚) 𝑵∑𝒚 𝟐 − ∑𝒚 𝟐
- 20. TESTING OF HYPOTHESIS/ TEST OF SIGNIFICANCE Parametric Test t test z test f test Non Parametric Test Sign Test Mann- Whitney U test Wilcoxon Signed Rank Test Run test for Randomness Kruskal- Wallis Test
- 21. DIFFERENCE BETWEEN PARAMETRIC TESTS & NON PARAMETRIC TESTS: ParametricTests (Makesassumptions about Parameters.e.g. DataisNormally/Intervally Distributed) Non-ParametricTests (Don’t Makes assumptions aboutParameters. AlsoDatais FreelyDistributed) NormalDistributiondataisrequired. NormalDistributiondataisnotrequired. UsesMetricdata OrdinalorIntervalScale dataisused. Canbeapplied forbothsmall & large samples. Canbeapplied forsmall samples. Onesample using zorttest. Onesample using theSign test. Twoindependentsamples using atorztest. Twoindependentsamples using the Mann- WhitneyUStatistics. Twopairedsamples usingatorztest. Twopairedsamples usingtheWilcoxonsigned ranktest. Randomness-Notestavailable Randomness-Run testforRandomness Several independentsamples usingF testin ANOVA Several independentsamples using Kruskal- Wallistest.
- 22. HYPOTHESIS TESTING (PARAMETRIC TESTS) Steps in Hypothesis Testing • Setting up of a Hypothesis • Setting up of a suitable level of significance (∝) • Determination of test statistic • Determination of critical region • Computing the value of test statistic • Making decisions/Hypothesis testing Various Terminologies in Hypothesis Testing: • Level of Significance • Confidence Level • Critical Region • Acceptance Region • Normal Distribution
- 23. HYPOTHESIS TESTING (PARAMETRIC TESTS) Various Test Statistics: a) t test; b) z test; c) p test a) t test: (Used when sample is small i.e. <30 and S.D. is not known) 𝒕 𝒏 − 𝟏 = 𝒙 − µ 𝑯𝟎 𝟔𝒙 b) z test: (Used when sample is large/small i.e. ><30 and S.D. is known) Z= 𝒙−µ 𝑯𝟎 𝟔/√𝒏 c) p test: (Alternate method based on probability) In this method no need to find Critical Value (z value) Reject Ho if p ≤ ∝ Accept Ho if p > ∝
- 24. HYPOTHESIS TESTING (NON PARAMETRIC TESTS) CHI SQUARE TEST: (Requires data in terms of frequencies) • Chi Square test can be used when data is unsymmetrically distributed. • A Chi Square test is used for Goodness of fit • Chi Square test for the independence of variables • Chi Square test for the equality of more than two population proportions. Chi Square= ∑𝒊=𝟏 𝑲 𝑶 𝒊 − 𝑬𝒊 𝟐/𝑬𝒊
- 25. RESEARCH REPORT • A report is a statement of collected & considered facts, so drawn up as to give clear & concise information to persons who are not in possession of the full facts of the subject matter of the report. - - Lancaster • Characteristics of good research Report: a) Accuracy; b) Clarity & Completeness; c) Appearance; d) Reliability; e) Timeliness; f) Simplicity; g) Brevity; h) Economy and i) Logical Content • Mechanism of Writing a Research Report/Steps in writing a Research Report: a. Investigating the sources of Information b. Taking Notes c. Analyzing the data; d. Making an Outline
- 26. STRUCTURE OF A RESEARCH REPORT 1. EXECUTIVE SUMMARY: A. BRIEF ABOUT THE PROJECT: 2. INTRODUCTION: A. WHY TOPIC IS SO IMPORTANT? B. BRIEF ABOUT COMPANY C. BRIEF ABOUT YOUR PROJECT D. WHAT YOU ARE GOING TO DO IN THE PROJECT? 3. INDUSTRY PROFILE: A. WORLD SCENARIO B. INDIAN SCENARIO C. NUMBER OF COMPANIES AND THEIR PERFORMANCE
- 27. STRUCTURE OF A RESEARCH REPORT 4. COMPANY PROFILE: A. HISTORY B. VISION C. MISSION, D. MILESTONES E. ORGANIZATION STRUCTURE 5. PRODUCT PROFILE: A. BRIEF ABOUT PRODUCTS OF COMPANY IN THE AREAS 6. OBJECTIVE OF STUDY: A. RELATED TO YOUR TITLE SET 3-5 OBJECTIVES
- 28. STRUCTURE OF A RESEARCH REPORT 7. RESEARCH METHODOLOGY: A. INTRODUCTION TO RESEARCH METHODOLOGY: B. RESEARCH TYPE: C. PRIMARY DATA: DEFINITION OF PRIMARY DATA AND HOW YOU COLLECTED PRIMARY DATA D. SECONDARY DATA: DEFINITION OF SECONDARY DATA AND HOW YOU COLLECTED SECONDARY DATA E. SAMPLING: VARIOUS METHODS OF SAMPLING AND WHICH METHOD YOU USED FOR SAMPLING F. POPULATION: G. SAMPLING AREA: H. SAMPLING UNIT: I. SAMPLE SIZE: J. SCOPE OF THE STUDY: EXPLAIN FURTHER AREAS OF RESEARCH AND IMPORTANCE OF RESEARCH K. LIMITATIONS OF THE STUDY: EXPLAIN THE CONSTRAINTS, HURDLES AND BOUNDARIES
- 29. STRUCTURE OF A RESEARCH REPORT 8. THEORETICAL BACKGROUND OF THE STUDY: A. MANAGEMENT THEORY RELATED TO YOUR TITLE AND REVIEW OF LITERATURE IF ANY 9. DATA ANALYSIS AND INTERPRETATION: A. WRITE QUESTION B. MAKE TABLE HAVING COLUMN OF SR. NO. , DETAILS, NO. OF RESPONDENTS AND % C. GIVE TABLE NUMBER AND MENTION SOURCE D. DRAW CHARTS (IF PI- MENTION %, IF BAR MENTION FREQUENCY) E. INTERPRETATION 10. FINDINGS: A. INTERPRETATION AND GENERAL FINDINGS DURING RESEARCH
- 30. STRUCTURE OF A RESEARCH REPORT 11. CONCLUSION: A. CONCLUDE WHOLE PROJECT IN ONE PARAGRAPH WITH MAJOR FINDINGS & SUGGESTIONS. 12. SUGGESTIONS: a. SUGGESTIONS AS PER THE FINDINGS 13. BIBLIOGRAPHY: a. REFERENCES AS PER APA STYLE 14. ANNEXURE: A. QUESTIONNAIRE B. COMPANY REPORTS IF REFERRED C. LIST OF RESPONDENTS D. PHOTOGRAPHS RELATED TO VISITS IF ANY
Editor's Notes
- port
- port
- port
- port
- port
- port
- port
- port